Stay Ahead, Stay ONMINE

😲 Quantifying Surprise – A Data Scientist’s Intro To Information Theory – Part 1/4: Foundations

Surprise! Generated using Gemini. During the telecommunication boom, Claude Shannon, in his seminal 1948 paper¹, posed a question that would revolutionise technology: How can we quantify communication? Shannon’s findings remain fundamental to expressing information quantification, storage, and communication. These insights made major contributions to the creation of technologies ranging from signal processing, data compression (e.g., Zip files and compact discs) to the Internet and artificial intelligence. More broadly, his work has significantly impacted diverse fields such as neurobiology, statistical physics and computer science (e.g, cybersecurity, cloud computing, and machine learning). [Shannon’s paper is the] Magna Carta of the Information Age Scientific American This is the first article in a series that explores information quantification – an essential tool for data scientists. Its applications range from enhancing statistical analyses to serving as a go-to decision heuristic in cutting-edge machine learning algorithms. Broadly speaking, quantifying information is assessing uncertainty, which may be phrased as: “how surprising is an outcome?”. This article idea quickly grew into a series since I found this topic both fascinating and diverse. Most researchers, at one stage or another, come across commonly used metrics such as entropy, cross-entropy/KL-divergence and mutual-information. Diving into this topic I found that in order to fully appreciate these one needs to learn a bit about the basics which we cover in this first article. By reading this series you will gain an intuition and tools to quantify: Bits/Nats – Unit measures of information. Self-Information – **** The amount of information in a specific event. Pointwise Mutual Information – The amount of information shared between two specific events. Entropy – The average amount of information of a variable’s outcome. Cross-entropy – The misalignment between two probability distributions (also expressed by its derivative KL-Divergence – a distance measure). Mutual Information – The co-dependency of two variables by their conditional probability distributions. It expresses the information gain of one variable given another. No prior knowledge is required – just a basic understanding of probabilities. I demonstrate using common statistics such as coin and dice 🎲 tosses as well as machine learning applications such as in supervised classification, feature selection, model monitoring and clustering assessment. As for real world applications I’ll discuss a case study of quantifying DNA diversity 🧬. Finally, for fun, I also apply to the popular brain twister commonly known as the Monty Hall problem 🚪🚪 🐐 . Throughout I provide python code 🐍 , and try to keep formulas as intuitive as possible. If you have access to an integrated development environment (IDE) 🖥 you might want to plug 🔌 and play 🕹 around with the numbers to gain a better intuition. This series is divided into four articles, each exploring a key aspect of Information Theory: 😲 Quantifying Surprise: 👈 👈 👈 YOU ARE HERE In this opening article, you’ll learn how to quantify the “surprise” of an event using _self-informatio_n and understand its units of measurement, such as _bit_s and _nat_s. Mastering self-information is essential for building intuition about the subsequent concepts, as all later heuristics are derived from it. 🤷 Quantifying Uncertainty: Building on self-information, this article shifts focus to the uncertainty – or “average surprise” – associated with a variable, known as entropy. We’ll dive into entropy’s wide-ranging applications, from Machine Learning and data analysis to solving fun puzzles, showcasing its adaptability. 📏 Quantifying Misalignment: Here, we’ll explore how to measure the distance between two probability distributions using entropy-based metrics like cross-entropy and KL-divergence. These measures are particularly valuable for tasks like comparing predicted versus true distributions, as in classification loss functions and other alignment-critical scenarios. 💸 Quantifying Gain: Expanding from single-variable measures, this article investigates the relationships between two. You’ll discover how to quantify the information gained about one variable (e.g, target Y) by knowing another (e.g., predictor X). Applications include assessing variable associations, feature selection, and evaluating clustering performance. Each article is crafted to stand alone while offering cross-references for deeper exploration. Together, they provide a practical, data-driven introduction to information theory, tailored for data scientists, analysts and machine learning practitioners. Disclaimer: Unless otherwise mentioned the formulas analysed are for categorical variables with c≥2 classes (2 meaning binary). Continuous variables will be addressed in a separate article. 🚧 Articles (3) and (4) are currently under construction. I will share links once available. Follow me to be notified 🚧 Quantifying Surprise with Self-Information Self-information is considered the building block of information quantification. It is a way of quantifying the amount of “surprise” of a specific outcome. Formally self-information, or also referred to as Shannon Information or information content, quantifies the surprise of an event x occurring based on its probability, p(x). Here we denote it as hₓ: Self-information _h_ₓ is the information of event x that occurs with probability p(x). The units of measure are called bits. One bit (binary digit) is the amount of information for an event x that has probability of p(x)=½. Let’s plug in to verify: hₓ=-log₂(½)= log₂(2)=1 bit. This heuristic serves as an alternative to probabilities, odds and log-odds, with certain mathematical properties which are advantageous for information theory. We discuss these below when learning about Shannon’s axioms behind this choice. It’s always informative to explore how an equation behaves with a graph: Bernoulli trial self-information h(p). Key features: Monotonic, h(p=1)=0, h(p →)→∞. To deepen our understanding of self-information, we’ll use this graph to explore the said axioms that justify its logarithmic formulation. Along the way, we’ll also build intuition about key features of this heuristic. To emphasise the logarithmic nature of self-information, I’ve highlighted three points of interest on the graph: At p=1 an event is guaranteed, yielding no surprise and hence zero bits of information (zero bits). A useful analogy is a trick coin (where both sides show HEAD). Reducing the probability by a factor of two (p=½​) increases the information to _hₓ=_1 bit. This, of course, is the case of a fair coin. Further reducing it by a factor of four results in hₓ(p=⅛)=3 bits. If you are interested in coding the graph here is a python script: To summarise this section: Self-Information hₓ=-log₂(p(x)) quantifies the amount of “surprise” of a specific outcome x. Three Axioms Referencing prior work by Ralph Hartley, Shannon chose -log₂(p) as a manner to meet three axioms. We’ll use the equation and graph to examine how these are manifested: An event with probability 100% is not surprising and hence does not yield any information. In the trick coin case this is evident by p(x)=1 yielding hₓ=0. Less probable events are more surprising and provide more information. This is apparent by self-information decreasing monotonically with increasing probability. The property of Additivity – the total self-information of two independent events equals the sum of individual contributions. This will be explored further in the upcoming fourth article on Mutual Information. There are mathematical proofs (which are beyond the scope of this series) that show that only the log function adheres to all three². The application of these axioms reveals several intriguing and practical properties of self-information: Important properties : Minimum bound: The first axiom hₓ(p=1)=0 establishes that self-information is non-negative, with zero as its lower bound. This is highly practical for many applications. Monotonically decreasing: The second axiom ensures that self-information decreases monotonically with increasing probability. No Maximum bound: At the extreme where _p→_0, monotonicity leads to self-information growing without bound hₓ(_p→0) →_ ∞, a feature that requires careful consideration in some contexts. However, when averaging self-information – as we will later see in the calculation of entropy – probabilities act as weights, effectively limiting the contribution of highly improbable events to the overall average. This relationship will become clearer when we explore entropy in detail. It is useful to understand the close relationship to log-odds. To do so we define p(x) as the probability of event x to happen and p(¬x)=1-p(x) of it not to happen. log-odds(x) = log₂(p(x)/p(¬x))= h(¬x) – h(x). The main takeaways from this section are Axiom 1: An event with probability 100% is not surprising Axiom 2: Less probable events are more surprising and, when they occur, provide more information. Self information (1) monotonically decreases (2) with a minimum bound of zero and (3) no upper bound. In the next two sections we further discuss units of measure and choice of normalisation. Information Units of Measure Bits or Shannons? A bit, as mentioned, represents the amount of information associated with an event that has a 50% probability of occurring. The term is also sometimes referred to as a Shannon, a naming convention proposed by mathematician and physicist David MacKay to avoid confusion with the term ‘bit’ in the context of digital processing and storage. After some deliberation, I decided to use ‘bit’ throughout this series for several reasons: This series focuses on quantifying information, not on digital processing or storage, so ambiguity is minimal. Shannon himself, encouraged by mathematician and statistician John Tukey, used the term ‘bit’ in his landmark paper. ‘Bit’ is the standard term in much of the literature on information theory. For convenience – it’s more concise Normalisation: Log Base 2 vs. Natural Throughout this series we use base 2 for logarithms, reflecting the intuitive notion of a 50% chance of an event as a fundamental unit of information. An alternative commonly used in machine learning is the natural logarithm, which introduces a different unit of measure called nats (short for natural units of information). One nat corresponds to the information gained from an event occurring with a probability of 1/e where e is Euler’s number (≈2.71828). In other words, 1 nat = -ln(p=(1/e)). The relationship between bits (base 2) and nats (natural log) is as follows: 1 bit = ln(2) nats ≈ 0.693 nats. Think of it as similar to a monetary current exchange or converting centimeters to inches. In his seminal publication Shanon explained that the optimal choice of base depends on the specific system being analysed (paraphrased slightly from his original work): “A device with two stable positions […] can store one bit of information” (bit as in binary digit). “A digit wheel on a desk computing machine that has ten stable positions […] has a storage capacity of one decimal digit.”³ “In analytical work where integration and differentiation are involved the base e is sometimes useful. The resulting units of information will be called natural units.” Key aspects of machine learning, such as popular loss functions, often rely on integrals and derivatives. The natural logarithm is a practical choice in these contexts because it can be derived and integrated without introducing additional constants. This likely explains why the machine learning community frequently uses nats as the unit of information – it simplifies the mathematics by avoiding the need to account for factors like ln(2). As shown earlier, I personally find base 2 more intuitive for interpretation. In cases where normalisation to another base is more convenient, I will make an effort to explain the reasoning behind the choice. To summarise this section of units of measure: bit = amount of information to distinguish between two equally likely outcomes. Now that we are familiar with self-information and its unit of measure let’s examine a few use cases. Quantifying Event Information with Coins and Dice In this section, we’ll explore examples to help internalise the self-information axioms and key features demonstrated in the graph. Gaining a solid understanding of self-information is essential for grasping its derivatives, such as entropy, cross-entropy (or KL divergence), and mutual information – all of which are averages over self-information. The examples are designed to be simple, approachable, and lighthearted, accompanied by practical Python code to help you experiment and build intuition. Note: If you feel comfortable with self-information, feel free to skip these examples and go straight to the Quantifying Uncertainty article. Generated using Gemini. To further explore the self-information and bits, I find analogies like coin flips and dice rolls particularly effective, as they are often useful analogies for real-world phenomena. Formally, these can be described as multinomial trials with n=1 trial. Specifically: A coin flip is a Bernoulli trial, where there are c=2 possible outcomes (e.g., heads or tails). Rolling a die represents a categorical trial, where c≥3 outcomes are possible (e.g., rolling a six-sided or eight-sided die). As a use case we’ll use simplistic weather reports limited to featuring sun 🌞 , rain 🌧 , and snow ⛄️. Now, let’s flip some virtual coins 👍 and roll some funky-looking dice 🎲 … Fair Coins and Dice Generated using Gemini. We’ll start with the simplest case of a fair coin (i.e, 50% chance for success/Heads or failure/Tails). Imagine an area for which at any given day there is a 50:50 chance for sun or rain. We can write the probability of each event be: p(🌞 )=p(🌧 )=½. As seen above, according the the self-information formulation, when 🌞 or 🌧 is reported we are provided with h(🌞 __ )=h(🌧 )=-log₂(½)=1 bit of information. We will continue to build on this analogy later on, but for now let’s turn to a variable that has more than two outcomes (c≥3). Before we address the standard six sided die, to simplify the maths and intuition, let’s assume an 8 sided one (_c=_8) as in Dungeons Dragons and other tabletop games. In this case each event (i.e, landing on each side) has a probability of p(🔲 ) = ⅛. When a die lands on one side facing up, e.g, value 7️⃣, we are provided with h(🔲 =7️⃣)=-log₂(⅛)=3 bits of information. For a standard six sided fair die: p(🔲 ) = ⅙ → an event yields __ h(🔲 )=-log₂(⅙)=2.58 bits. Comparing the amount of information from the fair coin (1 bit), 6 sided die (2.58 bits) and 8 sided (3 bits) we identify the second axiom: The less probable an event is, the more surprising it is and the more information it yields. Self information becomes even more interesting when probabilities are skewed to prefer certain events. Loaded Coins and Dice Generated using Gemini. Let’s assume a region where p(🌞 ) = ¾ and p(🌧 )= ¼. When rain is reported the amount of information conveyed is not 1 bit but rather h(🌧 )=-log₂(¼)=2 bits. When sun is reported less information is conveyed: h(🌞 )=-log₂(¾)=0.41 bits. As per the second axiom— a rarer event, like p(🌧 )=¼, reveals more information than a more likely one, like p(🌞 )=¾ – and vice versa. To further drive this point let’s now assume a desert region where p(🌞 ) =99% and p(🌧 )= 1%. If sunshine is reported – that is kind of expected – so nothing much is learnt (“nothing new under the sun” 🥁) and this is quantified as h(🌞 )=0.01 bits. If rain is reported, however, you can imagine being quite surprised. This is quantified as h(🌧 )=6.64 bits. In the following python scripts you can examine all the above examples, and I encourage you to play with your own to get a feeling. First let’s define the calculation and printout function: import numpy as np def print_events_self_information(probs): for ps in probs: print(f”Given distribution {ps}”) for event in ps: if ps[event] != 0: self_information = -np.log2(ps[event]) #same as: -np.log(ps[event])/np.log(2) text_ = f’When `{event}` occurs {self_information:0.2f} bits of information is communicated’ print(text_) else: print(f’a `{event}` event cannot happen p=0 ‘) print(“=” * 20) Next we’ll set a few example distributions of weather frequencies # Setting multiple probability distributions (each sums to 100%) # Fun fact – 🐍 💚 Emojis! probs = [{‘🌞 ‘: 0.5, ‘🌧 ‘: 0.5}, # half-half {‘🌞 ‘: 0.75, ‘🌧 ‘: 0.25}, # more sun than rain {‘🌞 ‘: 0.99, ‘🌧 ‘: 0.01} , # mostly sunshine ] print_events_self_information(probs) This yields printout Given distribution {‘🌞 ‘: 0.5, ‘🌧 ‘: 0.5} When `🌞 ` occurs 1.00 bits of information is communicated When `🌧 ` occurs 1.00 bits of information is communicated ==================== Given distribution {‘🌞 ‘: 0.75, ‘🌧 ‘: 0.25} When `🌞 ` occurs 0.42 bits of information is communicated When `🌧 ` occurs 2.00 bits of information is communicated ==================== Given distribution {‘🌞 ‘: 0.99, ‘🌧 ‘: 0.01} When `🌞 ` occurs 0.01 bits of information is communicated When `🌧 ` occurs 6.64 bits of information is communicated Let’s examine a case of a loaded three sided die. E.g, information of a weather in an area that reports sun, rain and snow at uneven probabilities: p(🌞 ) = 0.2, p(🌧 )=0.7, p(⛄️)=0.1. Running the following print_events_self_information([{‘🌞 ‘: 0.2, ‘🌧 ‘: 0.7, ‘⛄️’: 0.1}]) yields Given distribution {‘🌞 ‘: 0.2, ‘🌧 ‘: 0.7, ‘⛄️’: 0.1} When `🌞 ` occurs 2.32 bits of information is communicated When `🌧 ` occurs 0.51 bits of information is communicated When `⛄️` occurs 3.32 bits of information is communicated What we saw for the binary case applies to higher dimensions. To summarise – we clearly see the implications of the second axiom: When a highly expected event occurs – we do not learn much, the bit count is low. When an unexpected event occurs – we learn a lot, the bit count is high. Event Information Summary In this article we embarked on a journey into the foundational concepts of information theory, defining how to measure the surprise of an event. Notions introduced serve as the bedrock of many tools in information theory, from assessing data distributions to unraveling the inner workings of machine learning algorithms. Through simple yet insightful examples like coin flips and dice rolls, we explored how self-information quantifies the unpredictability of specific outcomes. Expressed in bits, this measure encapsulates Shannon’s second axiom: rarer events convey more information. While we’ve focused on the information content of specific events, this naturally leads to a broader question: what is the average amount of information associated with all possible outcomes of a variable? In the next article, Quantifying Uncertainty, we build on the foundation of self-information and bits to explore entropy – the measure of average uncertainty. Far from being just a beautiful theoretical construct, it has practical applications in data analysis and machine learning, powering tasks like decision tree optimisation, estimating diversity and more. Claude Shannon. Credit: Wikipedia Loved this post? ❤️🍕 💌 Follow me here, join me on LinkedIn or 🍕 buy me a pizza slice! About This Series Even though I have twenty years of experience in data analysis and predictive modelling I always felt quite uneasy about using concepts in information theory without truly understanding them. The purpose of this series was to put me more at ease with concepts of information theory and hopefully provide for others the explanations I needed. 🤷 Quantifying Uncertainty – A Data Scientist’s Intro To Information Theory – Part 2/4: EntropyGa_in intuition into Entropy and master its applications in Machine Learning and Data Analysis. Python code included. 🐍 me_dium.com Check out my other articles which I wrote to better understand Causality and Bayesian Statistics: Footnotes ¹ A Mathematical Theory of Communication, Claude E. Shannon, Bell System Technical Journal 1948. It was later renamed to a book The Mathematical Theory of Communication in 1949. [Shannon’s “A Mathematical Theory of Communication”] the blueprint for the digital era – Historian James Gleick ² See Wikipedia page on Information Content (i.e, self-information) for a detailed derivation that only the log function meets all three axioms. ³ The decimal-digit was later renamed to a hartley (symbol Hart), a ban or a dit. See Hartley (unit) Wikipedia page. Credits Unless otherwise noted, all images were created by the author. Many thanks to Will Reynolds and Pascal Bugnion for their useful comments.
Surprise! Generated using Gemini.

During the telecommunication boom, Claude Shannon, in his seminal 1948 paper¹, posed a question that would revolutionise technology:

How can we quantify communication?

Shannon’s findings remain fundamental to expressing information quantification, storage, and communication. These insights made major contributions to the creation of technologies ranging from signal processing, data compression (e.g., Zip files and compact discs) to the Internet and artificial intelligence. More broadly, his work has significantly impacted diverse fields such as neurobiology, statistical physics and computer science (e.g, cybersecurity, cloud computing, and machine learning).

[Shannon’s paper is the]

Magna Carta of the Information Age

  • Scientific American

This is the first article in a series that explores information quantification – an essential tool for data scientists. Its applications range from enhancing statistical analyses to serving as a go-to decision heuristic in cutting-edge machine learning algorithms.

Broadly speaking, quantifying information is assessing uncertainty, which may be phrased as: “how surprising is an outcome?”.

This article idea quickly grew into a series since I found this topic both fascinating and diverse. Most researchers, at one stage or another, come across commonly used metrics such as entropy, cross-entropy/KL-divergence and mutual-information. Diving into this topic I found that in order to fully appreciate these one needs to learn a bit about the basics which we cover in this first article.

By reading this series you will gain an intuition and tools to quantify:

  • Bits/Nats – Unit measures of information.
  • Self-Information – **** The amount of information in a specific event.
  • Pointwise Mutual Information – The amount of information shared between two specific events.
  • Entropy – The average amount of information of a variable’s outcome.
  • Cross-entropy – The misalignment between two probability distributions (also expressed by its derivative KL-Divergence – a distance measure).
  • Mutual Information – The co-dependency of two variables by their conditional probability distributions. It expresses the information gain of one variable given another.

No prior knowledge is required – just a basic understanding of probabilities.

I demonstrate using common statistics such as coin and dice 🎲 tosses as well as machine learning applications such as in supervised classification, feature selection, model monitoring and clustering assessment. As for real world applications I’ll discuss a case study of quantifying DNA diversity 🧬. Finally, for fun, I also apply to the popular brain twister commonly known as the Monty Hall problem 🚪🚪 🐐 .

Throughout I provide python code 🐍 , and try to keep formulas as intuitive as possible. If you have access to an integrated development environment (IDE) 🖥 you might want to plug 🔌 and play 🕹 around with the numbers to gain a better intuition.

This series is divided into four articles, each exploring a key aspect of Information Theory:

  1. 😲 Quantifying Surprise: 👈 👈 👈 YOU ARE HERE
    In this opening article, you’ll learn how to quantify the “surprise” of an event using _self-informatio_n and understand its units of measurement, such as _bit_s and _nat_s. Mastering self-information is essential for building intuition about the subsequent concepts, as all later heuristics are derived from it.

  2. 🤷 Quantifying Uncertainty: Building on self-information, this article shifts focus to the uncertainty – or “average surprise” – associated with a variable, known as entropy. We’ll dive into entropy’s wide-ranging applications, from Machine Learning and data analysis to solving fun puzzles, showcasing its adaptability.
  3. 📏 Quantifying Misalignment: Here, we’ll explore how to measure the distance between two probability distributions using entropy-based metrics like cross-entropy and KL-divergence. These measures are particularly valuable for tasks like comparing predicted versus true distributions, as in classification loss functions and other alignment-critical scenarios.
  4. 💸 Quantifying Gain: Expanding from single-variable measures, this article investigates the relationships between two. You’ll discover how to quantify the information gained about one variable (e.g, target Y) by knowing another (e.g., predictor X). Applications include assessing variable associations, feature selection, and evaluating clustering performance.

Each article is crafted to stand alone while offering cross-references for deeper exploration. Together, they provide a practical, data-driven introduction to information theory, tailored for data scientists, analysts and machine learning practitioners.

Disclaimer: Unless otherwise mentioned the formulas analysed are for categorical variables with c≥2 classes (2 meaning binary). Continuous variables will be addressed in a separate article.

🚧 Articles (3) and (4) are currently under construction. I will share links once available. Follow me to be notified 🚧


Quantifying Surprise with Self-Information

Self-information is considered the building block of information quantification.

It is a way of quantifying the amount of “surprise” of a specific outcome.

Formally self-information, or also referred to as Shannon Information or information content, quantifies the surprise of an event x occurring based on its probability, p(x). Here we denote it as hₓ:

Self-information _h_ₓ is the information of event x that occurs with probability p(x).

The units of measure are called bits. One bit (binary digit) is the amount of information for an event x that has probability of p(x)=½. Let’s plug in to verify: hₓ=-log₂(½)= log₂(2)=1 bit.

This heuristic serves as an alternative to probabilities, odds and log-odds, with certain mathematical properties which are advantageous for information theory. We discuss these below when learning about Shannon’s axioms behind this choice.

It’s always informative to explore how an equation behaves with a graph:
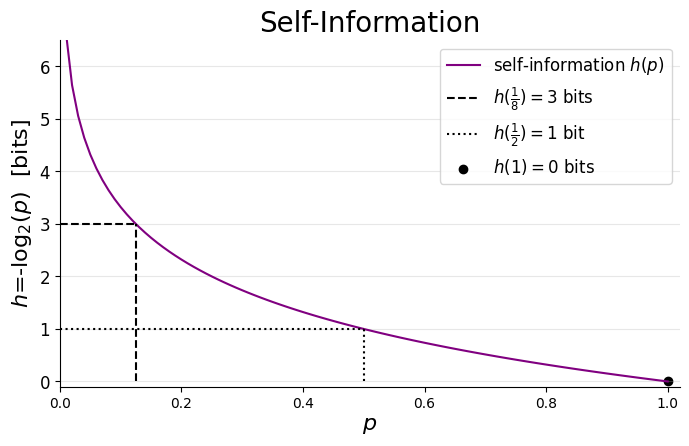
Bernoulli trial self-information h(p). Key features: Monotonic, h(p=1)=0, h(p →)→∞.

To deepen our understanding of self-information, we’ll use this graph to explore the said axioms that justify its logarithmic formulation. Along the way, we’ll also build intuition about key features of this heuristic.

To emphasise the logarithmic nature of self-information, I’ve highlighted three points of interest on the graph:

  • At p=1 an event is guaranteed, yielding no surprise and hence zero bits of information (zero bits). A useful analogy is a trick coin (where both sides show HEAD).
  • Reducing the probability by a factor of two (p=½​) increases the information to _hₓ=_1 bit. This, of course, is the case of a fair coin.
  • Further reducing it by a factor of four results in hₓ(p=⅛)=3 bits.

If you are interested in coding the graph here is a python script:

To summarise this section:

Self-Information hₓ=-log₂(p(x)) quantifies the amount of “surprise” of a specific outcome x.

Three Axioms

Referencing prior work by Ralph Hartley, Shannon chose -log₂(p) as a manner to meet three axioms. We’ll use the equation and graph to examine how these are manifested:

  1. An event with probability 100% is not surprising and hence does not yield any information.
    In the trick coin case this is evident by p(x)=1 yielding hₓ=0.

  2. Less probable events are more surprising and provide more information.
    This is apparent by self-information decreasing monotonically with increasing probability.

  3. The property of Additivity – the total self-information of two independent events equals the sum of individual contributions. This will be explored further in the upcoming fourth article on Mutual Information.

There are mathematical proofs (which are beyond the scope of this series) that show that only the log function adheres to all three².

The application of these axioms reveals several intriguing and practical properties of self-information:

Important properties :

  • Minimum bound: The first axiom hₓ(p=1)=0 establishes that self-information is non-negative, with zero as its lower bound. This is highly practical for many applications.
  • Monotonically decreasing: The second axiom ensures that self-information decreases monotonically with increasing probability.
  • No Maximum bound: At the extreme where _p→_0, monotonicity leads to self-information growing without bound hₓ(_p→0) →_ ∞, a feature that requires careful consideration in some contexts. However, when averaging self-information – as we will later see in the calculation of entropy – probabilities act as weights, effectively limiting the contribution of highly improbable events to the overall average. This relationship will become clearer when we explore entropy in detail.

It is useful to understand the close relationship to log-odds. To do so we define p(x) as the probability of event x to happen and px)=1-p(x) of it not to happen. log-odds(x) = log₂(p(x)/px))= hx) – h(x).

The main takeaways from this section are

Axiom 1: An event with probability 100% is not surprising

Axiom 2: Less probable events are more surprising and, when they occur, provide more information.

Self information (1) monotonically decreases (2) with a minimum bound of zero and (3) no upper bound.

In the next two sections we further discuss units of measure and choice of normalisation.

Information Units of Measure

Bits or Shannons?

A bit, as mentioned, represents the amount of information associated with an event that has a 50% probability of occurring.

The term is also sometimes referred to as a Shannon, a naming convention proposed by mathematician and physicist David MacKay to avoid confusion with the term ‘bit’ in the context of digital processing and storage.

After some deliberation, I decided to use ‘bit’ throughout this series for several reasons:

  • This series focuses on quantifying information, not on digital processing or storage, so ambiguity is minimal.
  • Shannon himself, encouraged by mathematician and statistician John Tukey, used the term ‘bit’ in his landmark paper.
  • ‘Bit’ is the standard term in much of the literature on information theory.
  • For convenience – it’s more concise

Normalisation: Log Base 2 vs. Natural

Throughout this series we use base 2 for logarithms, reflecting the intuitive notion of a 50% chance of an event as a fundamental unit of information.

An alternative commonly used in machine learning is the natural logarithm, which introduces a different unit of measure called nats (short for natural units of information). One nat corresponds to the information gained from an event occurring with a probability of 1/e where e is Euler’s number (≈2.71828). In other words, 1 nat = -ln(p=(1/e)).

The relationship between bits (base 2) and nats (natural log) is as follows:

1 bit = ln(2) nats ≈ 0.693 nats.

Think of it as similar to a monetary current exchange or converting centimeters to inches.

In his seminal publication Shanon explained that the optimal choice of base depends on the specific system being analysed (paraphrased slightly from his original work):

  • “A device with two stable positions […] can store one bit of information” (bit as in binary digit).
  • “A digit wheel on a desk computing machine that has ten stable positions […] has a storage capacity of one decimal digit.”³
  • “In analytical work where integration and differentiation are involved the base e is sometimes useful. The resulting units of information will be called natural units.

Key aspects of machine learning, such as popular loss functions, often rely on integrals and derivatives. The natural logarithm is a practical choice in these contexts because it can be derived and integrated without introducing additional constants. This likely explains why the machine learning community frequently uses nats as the unit of information – it simplifies the mathematics by avoiding the need to account for factors like ln(2).

As shown earlier, I personally find base 2 more intuitive for interpretation. In cases where normalisation to another base is more convenient, I will make an effort to explain the reasoning behind the choice.

To summarise this section of units of measure:

bit = amount of information to distinguish between two equally likely outcomes.

Now that we are familiar with self-information and its unit of measure let’s examine a few use cases.

Quantifying Event Information with Coins and Dice

In this section, we’ll explore examples to help internalise the self-information axioms and key features demonstrated in the graph. Gaining a solid understanding of self-information is essential for grasping its derivatives, such as entropy, cross-entropy (or KL divergence), and mutual information – all of which are averages over self-information.

The examples are designed to be simple, approachable, and lighthearted, accompanied by practical Python code to help you experiment and build intuition.

Note: If you feel comfortable with self-information, feel free to skip these examples and go straight to the Quantifying Uncertainty article.

Generated using Gemini.

To further explore the self-information and bits, I find analogies like coin flips and dice rolls particularly effective, as they are often useful analogies for real-world phenomena. Formally, these can be described as multinomial trials with n=1 trial. Specifically:

  • A coin flip is a Bernoulli trial, where there are c=2 possible outcomes (e.g., heads or tails).
  • Rolling a die represents a categorical trial, where c≥3 outcomes are possible (e.g., rolling a six-sided or eight-sided die).

As a use case we’ll use simplistic weather reports limited to featuring sun 🌞 , rain 🌧 , and snow ⛄️.

Now, let’s flip some virtual coins 👍 and roll some funky-looking dice 🎲 …

Fair Coins and Dice

Generated using Gemini.

We’ll start with the simplest case of a fair coin (i.e, 50% chance for success/Heads or failure/Tails).

Imagine an area for which at any given day there is a 50:50 chance for sun or rain. We can write the probability of each event be: p(🌞 )=p(🌧 )=½.

As seen above, according the the self-information formulation, when 🌞 or 🌧 is reported we are provided with h(🌞 __ )=h(🌧 )=-log₂(½)=1 bit of information.

We will continue to build on this analogy later on, but for now let’s turn to a variable that has more than two outcomes (c≥3).

Before we address the standard six sided die, to simplify the maths and intuition, let’s assume an 8 sided one (_c=_8) as in Dungeons Dragons and other tabletop games. In this case each event (i.e, landing on each side) has a probability of p(🔲 ) = ⅛.

When a die lands on one side facing up, e.g, value 7️⃣, we are provided with h(🔲 =7️⃣)=-log₂(⅛)=3 bits of information.

For a standard six sided fair die: p(🔲 ) = ⅙ → an event yields __ h(🔲 )=-log₂(⅙)=2.58 bits.

Comparing the amount of information from the fair coin (1 bit), 6 sided die (2.58 bits) and 8 sided (3 bits) we identify the second axiom: The less probable an event is, the more surprising it is and the more information it yields.

Self information becomes even more interesting when probabilities are skewed to prefer certain events.

Loaded Coins and Dice

Generated using Gemini.

Let’s assume a region where p(🌞 ) = ¾ and p(🌧 )= ¼.

When rain is reported the amount of information conveyed is not 1 bit but rather h(🌧 )=-log₂(¼)=2 bits.

When sun is reported less information is conveyed: h(🌞 )=-log₂(¾)=0.41 bits.

As per the second axiom— a rarer event, like p(🌧 )=¼, reveals more information than a more likely one, like p(🌞 )=¾ – and vice versa.

To further drive this point let’s now assume a desert region where p(🌞 ) =99% and p(🌧 )= 1%.

If sunshine is reported – that is kind of expected – so nothing much is learnt (“nothing new under the sun” 🥁) and this is quantified as h(🌞 )=0.01 bits. If rain is reported, however, you can imagine being quite surprised. This is quantified as h(🌧 )=6.64 bits.

In the following python scripts you can examine all the above examples, and I encourage you to play with your own to get a feeling.

First let’s define the calculation and printout function:

import numpy as np

def print_events_self_information(probs):
    for ps in probs:
        print(f"Given distribution {ps}")
        for event in ps:
            if ps[event] != 0:
                self_information = -np.log2(ps[event]) #same as: -np.log(ps[event])/np.log(2) 
                text_ = f'When `{event}` occurs {self_information:0.2f} bits of information is communicated'
                print(text_)
            else:
                print(f'a `{event}` event cannot happen p=0 ')
        print("=" * 20)

Next we’ll set a few example distributions of weather frequencies

# Setting multiple probability distributions (each sums to 100%)
# Fun fact - 🐍  💚  Emojis!
probs = [{'🌞   ': 0.5, '🌧   ': 0.5},   # half-half
        {'🌞   ': 0.75, '🌧   ': 0.25},  # more sun than rain
        {'🌞   ': 0.99, '🌧   ': 0.01} , # mostly sunshine
]

print_events_self_information(probs)

This yields printout

Given distribution {'🌞      ': 0.5, '🌧      ': 0.5}
When `🌞      ` occurs 1.00 bits of information is communicated 
When `🌧      ` occurs 1.00 bits of information is communicated 
====================
Given distribution {'🌞      ': 0.75, '🌧      ': 0.25}
When `🌞      ` occurs 0.42 bits of information is communicated 
When `🌧      ` occurs 2.00 bits of information is communicated 
====================
Given distribution {'🌞      ': 0.99, '🌧      ': 0.01}
When `🌞      ` occurs 0.01 bits of information is communicated 
When `🌧      ` occurs 6.64 bits of information is communicated  

Let’s examine a case of a loaded three sided die. E.g, information of a weather in an area that reports sun, rain and snow at uneven probabilities: p(🌞 ) = 0.2, p(🌧 )=0.7, p(⛄️)=0.1.

Running the following

print_events_self_information([{'🌞 ': 0.2, '🌧 ': 0.7, '⛄️': 0.1}])

yields

Given distribution {'🌞  ': 0.2, '🌧  ': 0.7, '⛄️': 0.1}
When `🌞  ` occurs 2.32 bits of information is communicated 
When `🌧  ` occurs 0.51 bits of information is communicated 
When `⛄️` occurs 3.32 bits of information is communicated 

What we saw for the binary case applies to higher dimensions.

To summarise – we clearly see the implications of the second axiom:

  • When a highly expected event occurs – we do not learn much, the bit count is low.
  • When an unexpected event occurs – we learn a lot, the bit count is high.

Event Information Summary

In this article we embarked on a journey into the foundational concepts of information theory, defining how to measure the surprise of an event. Notions introduced serve as the bedrock of many tools in information theory, from assessing data distributions to unraveling the inner workings of machine learning algorithms.

Through simple yet insightful examples like coin flips and dice rolls, we explored how self-information quantifies the unpredictability of specific outcomes. Expressed in bits, this measure encapsulates Shannon’s second axiom: rarer events convey more information.

While we’ve focused on the information content of specific events, this naturally leads to a broader question: what is the average amount of information associated with all possible outcomes of a variable?

In the next article, Quantifying Uncertainty, we build on the foundation of self-information and bits to explore entropy – the measure of average uncertainty. Far from being just a beautiful theoretical construct, it has practical applications in data analysis and machine learning, powering tasks like decision tree optimisation, estimating diversity and more.

Claude Shannon. Credit: Wikipedia

Loved this post? ❤️🍕

💌 Follow me here, join me on LinkedIn or 🍕 buy me a pizza slice!

About This Series

Even though I have twenty years of experience in data analysis and predictive modelling I always felt quite uneasy about using concepts in information theory without truly understanding them.

The purpose of this series was to put me more at ease with concepts of information theory and hopefully provide for others the explanations I needed.

🤷 Quantifying Uncertainty – A Data Scientist’s Intro To Information Theory – Part 2/4: EntropyGa_in intuition into Entropy and master its applications in Machine Learning and Data Analysis. Python code included. 🐍 me_dium.com

Check out my other articles which I wrote to better understand Causality and Bayesian Statistics:

Footnotes

¹ A Mathematical Theory of Communication, Claude E. Shannon, Bell System Technical Journal 1948.

It was later renamed to a book The Mathematical Theory of Communication in 1949.

[Shannon’s “A Mathematical Theory of Communication”] the blueprint for the digital era – Historian James Gleick

² See Wikipedia page on Information Content (i.e, self-information) for a detailed derivation that only the log function meets all three axioms.

³ The decimal-digit was later renamed to a hartley (symbol Hart), a ban or a dit. See Hartley (unit) Wikipedia page.

Credits

Unless otherwise noted, all images were created by the author.

Many thanks to Will Reynolds and Pascal Bugnion for their useful comments.

Shape
Shape
Stay Ahead

Explore More Insights

Stay ahead with more perspectives on cutting-edge power, infrastructure, energy,  bitcoin and AI solutions. Explore these articles to uncover strategies and insights shaping the future of industries.

Shape

Mobile demands spur enterprise Wi-Fi upgrades

Performance requirements (reduced latency, jitter, packet drops): 67.1% Increased bandwidth consumption: 59.9% User mobility (roaming, broader coverage): 53.3% Connectivity for operational technology (industrial systems, medical imaging, video surveillance): 50.0% Return-to-office policies driving up office occupancy: 48.7% Density requirements (users congregating): 44.7% End-of-life network equipment: 40.8% Need for location-based services: 40.1%

Read More »

Anthropic signs billion-dollar deal with Google Cloud

US-based AI company Anthropic has signed a major deal with Google Cloud that is said to be worth tens of billions of dollars. As part of the deal, Anthropic will have access to up to one million of Google’s purpose-built Tensor Processing Unit (TPU) AI accelerators. “Anthropic and Google have

Read More »

PG&E avoids ‘big bets’ as data center demand softens

$73 billion Capital investment plan, unchanged from Q2. PG&E Corp., which owns Pacific Gas & Electric Co., has adopted a “no big bets” philosophy to avoid issuing equity while the company stock price is low.  9.6 GW Datacenter pipeline, down 400 MW from June. But the number of projects entering final engineering has increased slightly. $1.1 billion Core earnings, up 44% from Q3 2024, partly driven by reduced operations and maintenance expenses. 9% Annual core EPS growth guidance for 2027-2030. Steady course Figures on early-stage data center projects remain “very fluid” and the company has seen “modest attrition” since June, PG&E Corp. CEO Patti Poppe said during a third-quarter earnings call Thursday. But of the 9.6 GW in the company’s data center queue, 18 projects totaling 1.6 GW have entered final engineering — up from 1.5 GW at the end of the second quarter, according to PG&E. The company expects 95% of projects that reach final engineering to enter service by 2030; several may begin service as early as 2026. PG&E holds that it can cut customer bills by 1% to 2% per gigawatt of new load by using revenue from new large load customers to offset its five-year, $73 billion capital investment plan. But CFO Carolyn Burke said it was unlikely that PG&E would expand its capital plan to try to attract additional large load customers given the company’s low stock valuation. Instead, she said, the company would stick to a “no big bets plan” and focus on upgrading existing assets and investing in safety and reliability while working to improve PG&E’s credit rating. Burke said the company’s financial metrics meet the credit rating agencies’ criteria for investment-grade ratings, but that the agencies are watching regulatory developments in California for signs that it is time to upgrade the utility. Wildfire

Read More »

North America Adds Rigs For 3 Straight Weeks

North America added three rigs week on week, according to Baker Hughes’ latest North America rotary rig count, which was published on October 24. The total U.S. rig count increased by two week on week and the total Canada rig count rose by one during the same period, taking the total North America rig count up to 749, comprising 550 rigs from the U.S. and 199 rigs from Canada, the count outlined. Of the total U.S. rig count of 550, 527 rigs are categorized as land rigs, 21 are categorized as offshore rigs, and two are categorized as inland water rigs. The total U.S. rig count is made up of 420 oil rigs, 121 gas rigs, and nine miscellaneous rigs, according to Baker Hughes’ count, which revealed that the U.S. total comprises 485 horizontal rigs, 53 directional rigs, and 12 vertical rigs. Week on week, the U.S. offshore rig count rose by four, and its land and inland water rig counts each dropped by one, Baker Hughes highlighted. The U.S. oil rig count rose by two week on week, and its gas and miscellaneous rig counts remained unchanged during the period, the count showed. The U.S. directional rig count rose by two week on week, while its vertical rig count increased by one and its horizontal rig count dropped by one, the count revealed. A major state variances subcategory included in the rig count showed that, week on week, Louisiana added three rigs, Wyoming added two rigs, and Colorado and Texas each dropped one rig. A major state variances subcategory included in the rig count showed that, week on week, the Eagle Ford and Permian basins each dropped one rig. Canada’s total rig count of 199 is made up of 138 oil rigs and 61 gas rigs, Baker Hughes pointed

Read More »

Lukoil to Sell Foreign Assets amid Sanctions

(Update) October 28, 2025, 10:00 AM GMT+1: Article updated with details throughout. Lukoil PJSC, Russia’s second-largest oil producer, announced plans to sell international assets after being hit by US sanctions last week.  The company is has started considering bids from potential buyers, according to a statement posted on its website late on Monday. The divestment process is being conducted under a wind-down license from the US Treasury’s Office of Foreign Assets Control, which Lukoil said it could ask to be extended “to ensure uninterrupted operations of its international assets.” Last week, President Donald Trump’s administration slapped sanctions on Russia’s two biggest oil producers – Lukoil and state-controlled Rosneft PJSC – to pressure the Kremlin to end the war in Ukraine. The oil and gas industry is a key source of tax revenues for the nation’s budget, and two producers account for just under a half of the country’s crude exports. The goal of the White House is to make Russia’s oil trade harder, costlier and riskier, rather than stopping the flows altogether in a way that could spike global crude prices. The UK also blacklisted the two companies earlier this month. Lukoil is the most internationally diverse of Russia’s oil giants, with upstream businesses in former Soviet countries such as Kazakstan, Uzbekistan and Azerbaijan, as well as in Egypt, the United Arab Emirates and West African nations of Ghana, Nigeria, Cameroon and Congo.  In all these projects, the Russian producer holds minority stakes, and their share in Lukoil’s total crude production last year was only 5 percent, according to the company’s annual report. International assets jointly account for around a quarter of Lukoil’s current capitalization, according to estimates from Kirill Bakhtin, senior analyst at Moscow-based BCS. One notable exception is Iraq, where Lukoil holds 75 percent of the giant West Qurna 2 oil

Read More »

QatarEnergy Joins North Rafah Exploration Block in Egypt

QatarEnergy said Monday it had completed the purchase of a 40 percent stake in the North Rafah exploration block offshore Egypt from Eni SpA. The Italian state-backed energy major retains 60 percent as operator, state-owned QatarEnergy said in a press release. North Rafah spans nearly 3,000 square kilometers (1,158.31 square miles) in the Mediterranean Sea off the northeastern coast of Egypt, QatarEnergy noted. The block has a water depth of up to 450 meters (1,476.38 feet), it said. The acquisition “strengthens our presence in Egypt and marks another important step in advancing our ambitious international exploration strategy”, said QatarEnergy president and chief executive Saad Sherida Al-Kaabi, who is also Qatar’s energy minister. Earlier this month QatarEnergy said it has entered into an agreement to buy a 27 percent ownership in the North Cleopatra exploration block on Egypt’s side of the Mediterranean Sea from operator Shell PLC. Shell will retain 36 percent. The other partners are Chevron Corp with a 27 percent interest and Egypt’s state-owned Tharwa Petroleum Co with 10 percent, according to a QatarEnergy statement October 5. North Cleopatra spans 3,400 square kilometers with waters up to 2,600 meters (8,530.18 feet) deep, QatarEnergy noted. The license area is in the frontier Herodotus basin and adjacent to the northern portion of the North El-Dabaa block, where QatarEnergy holds 23 percent, QatarEnergy said. QatarEnergy obtained its North El-Dabaa stake from United States oil and gas heavyweight Chevron, in an agreement announced November 11, 2024. North El-Dabaa lies about 10 kilometers off Egypt’s Mediterranean shore. The block has a water depth of 100-3,000 meters, according to QatarEnergy. On May 12, 2024, QatarEnergy announced a deal to acquire 40 percent each in the Cairo and Masry exploration blocks offshore Egypt from sole owner Exxon Mobil Corp. The blocks cover around 11,400 square kilometers

Read More »

Baker Hughes Wins New Aramco Drilling Services Contract

Baker Hughes Co has signed an agreement with Saudi Arabian Oil Co (Aramco) expanding its integrated underbalanced coiled tubing drilling (UBCTD) operations across Saudi Arabia’s natural gas fields. “Under the multi-year agreement, Baker Hughes will expand its current UBCTD fleet from four to 10 units for re-entry and greenfield drilling projects across fields in the kingdom”, the Houston, Texas-based company said in a press release. “The company will provide integrated solutions to manage all aspects of the UBCTD operations, including coiled tubing drilling units, underbalanced drilling services, operational management, well construction and geosciences to scale and accelerate their access to gas from new and established fields”. Work under the expanded contract is scheduled to start next year. “Baker Hughes’ integrated approach to UBCTD includes the industry-leading CoilTrak™ bottomhole assembly system and enhanced reservoir analysis driven by GaffneyCline™ energy advisory”, Baker Hughes said. “This unique pairing of technology and insight allows operators to more effectively navigate the subsurface environment during horizontal drilling and re-entry operations. “By combining these solutions with holistic project management services, Baker Hughes will enhance production efficiency, speed and safety while mitigating reservoir damage when compared to traditional development methods”. Amerino Gatti, Baker Hughes executive vice president for oilfield services and equipment, said, “This project is the result of nearly two decades of successful collaboration between Baker Hughes and Aramco, which have set the standard for UBCTD. By combining advanced technologies with a holistic, integrated approach, we can support Aramco to more efficiently access bypassed and hard-to-reach hydrocarbons and produce the resources that help the kingdom thrive”. “This expansion sets the stage for further innovation in UBCTD, which has the potential to shape how oil and gas are produced around the world”, Gatti added. Baker Hughes entered the Saudi UBCTD market in 2008, according to the company. In a separate contract, Baker Hughes said Monday it has been tapped

Read More »

Crude Pauses After Sanction-Fueled Rally

Oil swung between gains and losses on the back of the biggest weekly increase since June as attention turned to the wider outlook for supply as the US and China made progress on trade. West Texas Intermediate slipped 0.3% to settle just above $61, extending its decline for a second day. Top Chinese and US negotiators said they came to terms on a range of points, setting the table for President Donald Trump and counterpart Xi Jinping to finalize a deal to ease trade tensions between the world’s two biggest economies and crude importers. Still, oil was little changed Monday after adding nearly 7% last week when the US sanctioned Russian oil giants Rosneft and Lukoil to squeeze Russia over its ongoing war in Ukraine. The move added output risks to a market that’s showing signs of entering a surplus. Lukoil announced in a statement that it intends to sell its international assets due to the latest sanctions. “The market is taking a breather here,” said Dennis Kissler, senior vice president for trading at BOK Financial. “While US-China negotiations continue, no real outcome has been agreed as of yet…and the sanctions on Russia may halt some shipments though it’s more likely most of that oil will still find a home.” The Trump administration is seeking to make Russia’s trade harder, costlier and riskier, but without forcing a sudden supply shock that might spike global oil prices, officials familiar with the matter said over the weekend. The measures helped oil rebound from a five-month low last week, but part of the move was likely driven by extreme market positioning. Traders had amassed record bearish wagers on the global Brent benchmark in anticipation of oversupply in the next few months. In the meantime, commodity trading advisers, or CTAs, are set to accelerate

Read More »

Qualcomm goes all-in on inferencing with purpose-built cards and racks

From a strategy perspective, there is a longer term enterprise play here, noted Moor’s Kimball; Humain is Qualcomm’s first customer, and a cloud service provider (CSP) or hyperscaler will likely be customer number two. However, at some point, these rack-scale systems will find their way into the enterprise. “If I were the AI200 product marketing lead, I would be thinking about how I demonstrate this as a viable platform for those enterprise workloads that will be getting ‘agentified’ over the next several years,” said Kimball. It seems a natural step, as Qualcomm saw success with its AI100 accelerator, a strong inference chip, he noted. Right now, Nvidia and AMD dominate the training market, with CUDA and ROCm enjoying a “stickiness” with customers. “If I am a semiconductor giant like Qualcomm that is so good at understanding the performance-power balance, this inference market makes perfect sense to really lean in on,” said Kimball. He also pointed to the company’s plans to re-enter the datacenter CPU space with its Oryon CPU, which is featured in Snapdragon and loosely based on technology it acquired with its $1.4 billion Nuvia acquisition. Ultimately, Qualcomm’s move demonstrates how wide open the inference market is, said Kimball. The company, he noted, has been very good at choosing target markets and has seen success when entering those markets. “That the company would decide to go more ‘in’ on the inference market makes sense,” said Kimball. He added that, from an ROI perspective, inferencing will “dwarf” training in terms of volume and dollars.

Read More »

AI data center building boom risks fueling future debt bust, bank warns

However, that’s only one part of the problem. Meeting the power demands of AI data centers will require the energy sector to make large investments. Then there’s data center demand for microprocessors, rare earth elements, and other valuable metals such as copper, which could, in a bust, make data centers the most expensively-assembled unwanted assets in history. “Financial stability consequences of an AI-related asset price fall could arise through multiple channels. If forecasted debt-financed AI infrastructure growth materializes, the potential financial stability consequences of such an event are likely to grow,” warned the BoE blog post. “For companies who depend on the continued demand for massive computational capacity to train and run inference on AI models, an algorithmic breakthrough or other event which challenges that paradigm could cause a significant re-evaluation of asset prices,” it continued. According to Matt Hasan, CEO of AI consultancy aiRESULTS, the underlying problem is the speed with which AI has emerged. “What we’re witnessing isn’t just an incremental expansion, it’s a rush to construct power-hungry, mega-scale data centers,” he told Network World. The dot.com reversal might be the wrong comparison; it dented the NASDAQ and hurt tech investment, but the damage to organizations investing in e-commerce was relatively limited. AI, by contrast, might have wider effects for large enterprises because so many have pinned their business prospects on its potential. “Your reliance on these large providers means you are indirectly exposed to the stability of their debt. If a correction occurs, the fallout can impact the services you rely on,” said Hasan.

Read More »

Intel sees supply shortage, will prioritize data center technology

“Capacity constraints, especially on Intel 10 and Intel 7 [Intel’s semiconductor manufacturing process], limited our ability to fully meet demand in Q3 for both data center and client products,” said Zinsner, adding that Intel isn’t about to add capacity to Intel 10 and 7 when it has moved beyond those nodes. “Given the current tight capacity environment, which we expect to persist into 2026, we are working closely with customers to maximize our available output, including adjusting pricing and mix to shift demand towards products where we have supply and they have demand,” said Zinsner. For that reason, Zinzner projects that the fourth quarter will be roughly flat versus the third quarter in terms of revenue. “We expect Intel products up modestly sequentially but below customer demand as we continue to navigate supply environment,” said Zinsner. “We expect CCG to be down modestly and PC AI to be up strongly sequentially as we prioritize wafer capacity for server shipments over entry-level client parts.”

Read More »

How to set up an AI data center in 90 days

“Personally, I think that a brownfield is very creative way to deal with what I think is the biggest problem that we’ve got right now, which is time and speed to market,” he said. “On a brownfield, I can go into a building that’s already got power coming into the building. Sometimes they’ve already got chiller plants, like what we’ve got with the building I’m in right now.” Patmos certainly made the most of the liquid facilities in the old printing press building. The facility is built to handle anywhere from 50 to over 140 kilowatts per cabinet, a leap far beyond the 1–2 kW densities typical of legacy data centers. The chips used in the servers are Nvidia’s Grace Blackwell processors, which run extraordinarily hot. To manage this heat load, Patmos employs a multi-loop liquid cooling system. The design separates water sources into distinct, closed loops, each serving a specific function and ensuring that municipal water never directly contacts sensitive IT equipment. “We have five different, completely separated water loops in this building,” said Morgan. “The cooling tower uses city water for evaporation, but that water never mixes with the closed loops serving the data hall. Everything is designed to maximize efficiency and protect the hardware.” The building taps into Kansas City’s district chilled water supply, which is sourced from a nearby utility plant. This provides the primary cooling resource for the facility. Inside the data center, a dedicated loop circulates a specialized glycol-based fluid, filtered to extremely low micron levels and formulated to be electronically safe. Heat exchangers transfer heat from the data hall fluid to the district chilled water, keeping the two fluids separate and preventing corrosion or contamination. Liquid-to-chip and rear-door heat exchangers are used for immediate heat removal.

Read More »

INNIO and VoltaGrid: Landmark 2.3 GW Modular Power Deal Signals New Phase for AI Data Centers

Why This Project Marks a Landmark Shift The deployment of 2.3 GW of modular generation represents utility-scale capacity, but what makes it distinct is the delivery model. Instead of a centralized plant, the project uses modular gas-reciprocating “power packs” that can be phased in step with data-hall readiness. This approach allows staged energization and limits the bottlenecks that often stall AI campuses as they outgrow grid timelines or wait in interconnection queues. AI training loads fluctuate sharply, placing exceptional stress on grid stability and voltage quality. The INNIO/VoltaGrid platform was engineered specifically for these GPU-driven dynamics, emphasizing high transient performance (rapid load acceptance) and grid-grade power quality, all without dependence on batteries. Each power pack is also designed for maximum permitting efficiency and sustainability. Compared with diesel generation, modern gas-reciprocating systems materially reduce both criteria pollutants and CO₂ emissions. VoltaGrid markets the configuration as near-zero criteria air emissions and hydrogen-ready, extending allowable runtimes under air permits and making “prime-as-a-service” viable even in constrained or non-attainment markets. 2025: Momentum for Modular Prime Power INNIO has spent 2025 positioning its Jenbacher platform as a next-generation power solution for data centers: combining fast start, high transient performance, and lower emissions compared with diesel. While the 3 MW J620 fast-start lineage dates back to 2019, this year the company sharpened its data center narrative and booked grid stability and peaking projects in markets where rapid data center growth is stressing local grids. This momentum was exemplified by an 80 MW deployment in Indonesia announced earlier in October. The same year saw surging AI-driven demand and INNIO’s growing push into North American data-center markets. Specifications for the 2.3 GW VoltaGrid package highlight the platform’s heat tolerance, efficiency, and transient response, all key attributes for powering modern AI campuses. VoltaGrid’s 2025 Milestones VoltaGrid’s announcements across 2025 reflect

Read More »

Inside Google’s multi-architecture revolution: Axion Arm joins x86 in production clusters

Matt Kimball, VP and principal analyst with Moor Insights and Strategy, pointed out that AWS and Microsoft have already moved many workloads from x86 to internally designed Arm-based servers. He noted that, when Arm first hit the hyperscale datacenter market, the architecture was used to support more lightweight, cloud-native workloads with an interpretive layer where architectural affinity was “non-existent.” But now there’s much more focus on architecture, and compatibility issues “largely go away” as Arm servers support more and more workloads. “In parallel, we’ve seen CSPs expand their designs to support both scale out (cloud-native) and traditional scale up workloads effectively,” said Kimball. Simply put, CSPs are looking to monetize chip investments, and this migration signals that Google has found its performance-per-dollar (and likely performance-per-watt) better on Axion than x86. Google will likely continue to expand its Arm footprint as it evolves its Axion chip; as a reference point, Kimball pointed to AWS Graviton, which didn’t really support “scale up” performance until its v3 or v4 chip. Arm is coming to enterprise data centers too When looking at architectures, enterprise CIOs should ask themselves questions such as what instance do they use for cloud workloads, and what servers do they deploy in their data center, Kimball noted. “I think there is a lot less concern about putting my workloads on an Arm-based instance on Google Cloud, a little more hesitance to deploy those Arm servers in my datacenter,” he said. But ultimately, he said, “Arm is coming to the enterprise datacenter as a compute platform, and Nvidia will help usher this in.” Info-Tech’s Jain agreed that Nvidia is the “biggest cheerleader” for Arm-based architecture, and Arm is increasingly moving from niche and mobile use to general-purpose and AI workload execution.

Read More »

Microsoft will invest $80B in AI data centers in fiscal 2025

And Microsoft isn’t the only one that is ramping up its investments into AI-enabled data centers. Rival cloud service providers are all investing in either upgrading or opening new data centers to capture a larger chunk of business from developers and users of large language models (LLMs).  In a report published in October 2024, Bloomberg Intelligence estimated that demand for generative AI would push Microsoft, AWS, Google, Oracle, Meta, and Apple would between them devote $200 billion to capex in 2025, up from $110 billion in 2023. Microsoft is one of the biggest spenders, followed closely by Google and AWS, Bloomberg Intelligence said. Its estimate of Microsoft’s capital spending on AI, at $62.4 billion for calendar 2025, is lower than Smith’s claim that the company will invest $80 billion in the fiscal year to June 30, 2025. Both figures, though, are way higher than Microsoft’s 2020 capital expenditure of “just” $17.6 billion. The majority of the increased spending is tied to cloud services and the expansion of AI infrastructure needed to provide compute capacity for OpenAI workloads. Separately, last October Amazon CEO Andy Jassy said his company planned total capex spend of $75 billion in 2024 and even more in 2025, with much of it going to AWS, its cloud computing division.

Read More »

John Deere unveils more autonomous farm machines to address skill labor shortage

Join our daily and weekly newsletters for the latest updates and exclusive content on industry-leading AI coverage. Learn More Self-driving tractors might be the path to self-driving cars. John Deere has revealed a new line of autonomous machines and tech across agriculture, construction and commercial landscaping. The Moline, Illinois-based John Deere has been in business for 187 years, yet it’s been a regular as a non-tech company showing off technology at the big tech trade show in Las Vegas and is back at CES 2025 with more autonomous tractors and other vehicles. This is not something we usually cover, but John Deere has a lot of data that is interesting in the big picture of tech. The message from the company is that there aren’t enough skilled farm laborers to do the work that its customers need. It’s been a challenge for most of the last two decades, said Jahmy Hindman, CTO at John Deere, in a briefing. Much of the tech will come this fall and after that. He noted that the average farmer in the U.S. is over 58 and works 12 to 18 hours a day to grow food for us. And he said the American Farm Bureau Federation estimates there are roughly 2.4 million farm jobs that need to be filled annually; and the agricultural work force continues to shrink. (This is my hint to the anti-immigration crowd). John Deere’s autonomous 9RX Tractor. Farmers can oversee it using an app. While each of these industries experiences their own set of challenges, a commonality across all is skilled labor availability. In construction, about 80% percent of contractors struggle to find skilled labor. And in commercial landscaping, 86% of landscaping business owners can’t find labor to fill open positions, he said. “They have to figure out how to do

Read More »

2025 playbook for enterprise AI success, from agents to evals

Join our daily and weekly newsletters for the latest updates and exclusive content on industry-leading AI coverage. Learn More 2025 is poised to be a pivotal year for enterprise AI. The past year has seen rapid innovation, and this year will see the same. This has made it more critical than ever to revisit your AI strategy to stay competitive and create value for your customers. From scaling AI agents to optimizing costs, here are the five critical areas enterprises should prioritize for their AI strategy this year. 1. Agents: the next generation of automation AI agents are no longer theoretical. In 2025, they’re indispensable tools for enterprises looking to streamline operations and enhance customer interactions. Unlike traditional software, agents powered by large language models (LLMs) can make nuanced decisions, navigate complex multi-step tasks, and integrate seamlessly with tools and APIs. At the start of 2024, agents were not ready for prime time, making frustrating mistakes like hallucinating URLs. They started getting better as frontier large language models themselves improved. “Let me put it this way,” said Sam Witteveen, cofounder of Red Dragon, a company that develops agents for companies, and that recently reviewed the 48 agents it built last year. “Interestingly, the ones that we built at the start of the year, a lot of those worked way better at the end of the year just because the models got better.” Witteveen shared this in the video podcast we filmed to discuss these five big trends in detail. Models are getting better and hallucinating less, and they’re also being trained to do agentic tasks. Another feature that the model providers are researching is a way to use the LLM as a judge, and as models get cheaper (something we’ll cover below), companies can use three or more models to

Read More »

OpenAI’s red teaming innovations define new essentials for security leaders in the AI era

Join our daily and weekly newsletters for the latest updates and exclusive content on industry-leading AI coverage. Learn More OpenAI has taken a more aggressive approach to red teaming than its AI competitors, demonstrating its security teams’ advanced capabilities in two areas: multi-step reinforcement and external red teaming. OpenAI recently released two papers that set a new competitive standard for improving the quality, reliability and safety of AI models in these two techniques and more. The first paper, “OpenAI’s Approach to External Red Teaming for AI Models and Systems,” reports that specialized teams outside the company have proven effective in uncovering vulnerabilities that might otherwise have made it into a released model because in-house testing techniques may have missed them. In the second paper, “Diverse and Effective Red Teaming with Auto-Generated Rewards and Multi-Step Reinforcement Learning,” OpenAI introduces an automated framework that relies on iterative reinforcement learning to generate a broad spectrum of novel, wide-ranging attacks. Going all-in on red teaming pays practical, competitive dividends It’s encouraging to see competitive intensity in red teaming growing among AI companies. When Anthropic released its AI red team guidelines in June of last year, it joined AI providers including Google, Microsoft, Nvidia, OpenAI, and even the U.S.’s National Institute of Standards and Technology (NIST), which all had released red teaming frameworks. Investing heavily in red teaming yields tangible benefits for security leaders in any organization. OpenAI’s paper on external red teaming provides a detailed analysis of how the company strives to create specialized external teams that include cybersecurity and subject matter experts. The goal is to see if knowledgeable external teams can defeat models’ security perimeters and find gaps in their security, biases and controls that prompt-based testing couldn’t find. What makes OpenAI’s recent papers noteworthy is how well they define using human-in-the-middle

Read More »