Stay Ahead, Stay ONMINE

Myths vs. Data: Does an Apple a Day Keep the Doctor Away?

Introduction “Money can’t buy happiness.” “You can’t judge a book by its cover.” “An apple a day keeps the doctor away.” You’ve probably heard these sayings several times, but do they actually hold up when we look at the data? In this article series, I want to take popular myths/sayings and put them to the […]

Introduction

“Money can’t buy happiness.” “You can’t judge a book by its cover.” “An apple a day keeps the doctor away.”

You’ve probably heard these sayings several times, but do they actually hold up when we look at the data? In this article series, I want to take popular myths/sayings and put them to the test using real-world data. 

We might confirm some unexpected truths, or debunk some popular beliefs. Hopefully, in either case we will gain new insights into the world around us.

The hypothesis

“An apple a day keeps the doctor away”: is there any real evidence to support this?

If the myth is true, we should expect a negative correlation between apple consumption per capita and doctor visits per capita . So, the more apples a country consumes, the fewer doctor visits people should need.

Let’s look into the data and see what the numbers really say.

Testing the relationship between apple consumption and doctor visits

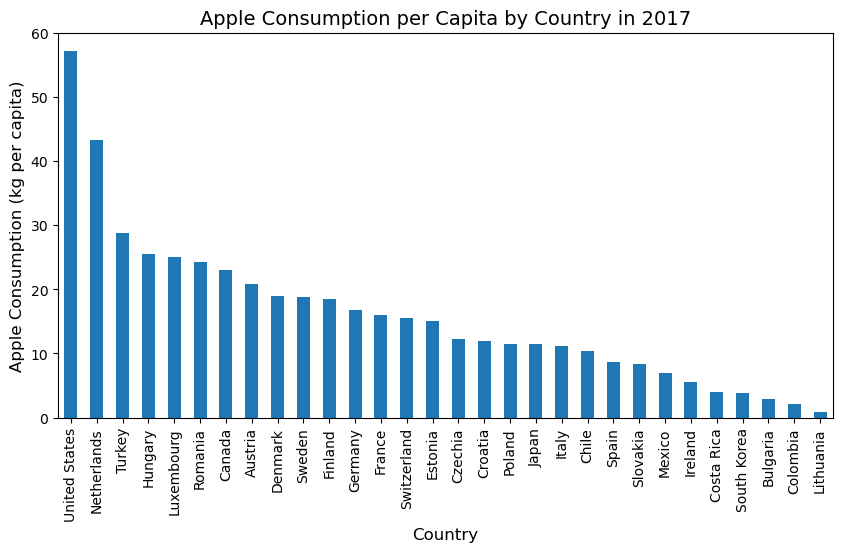
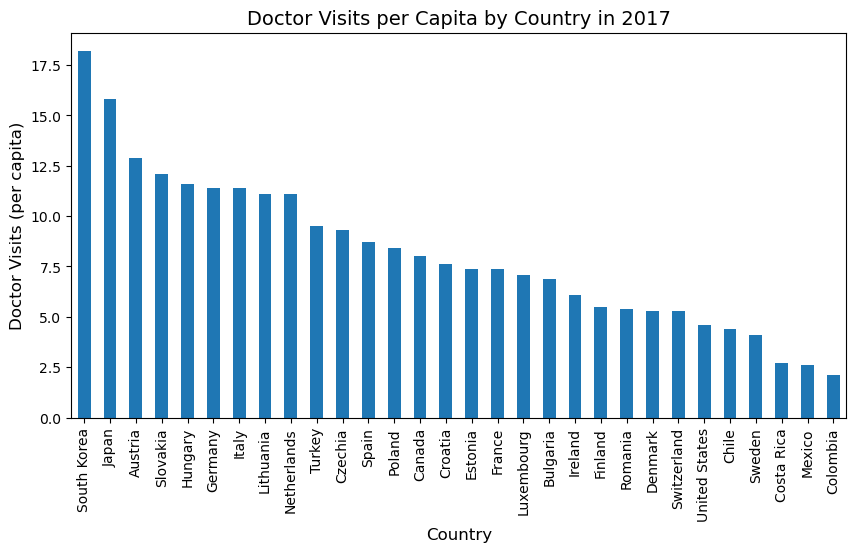
Let’s start with a simple correlation check between apple consumption per capita and doctor visits per capita.

Data sources

The data comes from:

Since data availability varies by year, 2017 was selected as it provided the most complete in terms of number of countries. However, the results are consistent across other years.

The United States had the highest apple consumption per capita, exceeding 55 kg per year, while Lithuania had the lowest, consuming just under 1 kg per year.
South Korea had the highest number of doctor visits per capita, at more than 18 visits per year, while Colombia had the lowest, with just above 2 visits per year.

Visualizing the relationship

To visualize whether higher apple consumption is associated with fewer doctor visits, we start by looking at a scatter plot with a regression line.

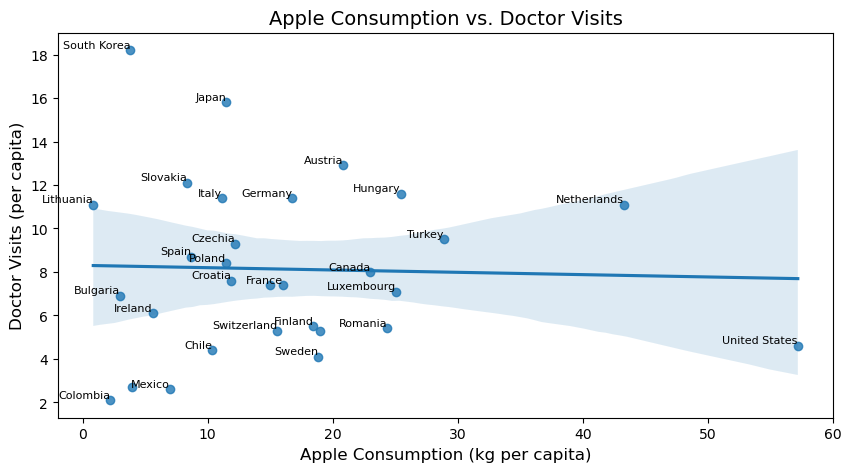
The regression plot shows a very slim negative correlation, meaning that in countries where people eat more apples, there is a barely noticeable tendency to have lower doctor visits. 
Unfortunately, the trend is so weak that it cannot be considered meaningful.

OLS regression

To test this relationship statistically, we run a linear regression (OLS), where doctor visits per capita is the dependent variable and apple consumption per capita is the independent variable.

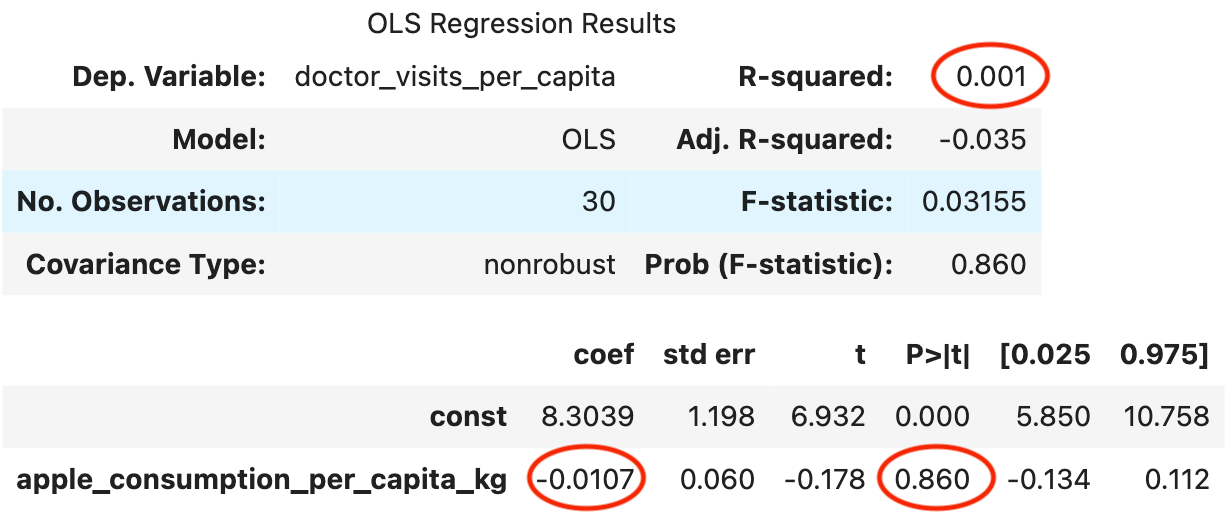
The results confirm what the scatterplot suggested:

  • The coefficient for apple consumption is -0.0107, meaning that even if there is an effect, it is very small.
  • The p-value is 0.860 (86%), far more than the standard significance threshold of 5%.
  • The R² value is almost zero, meaning apple consumption explains virtually none of the variation in doctor visits.

This doesn’t strictly mean that there is no relationship, but rather that we cannot prove one with the available data. It’s possible that any real effect is too small to detect, that other factors we didn’t include play a larger role, or that the data simply doesn’t reflect the relationship well.

Controlling for confounders

Are we done? Not quite. So far, we’ve only checked for a direct relationship between apple consumption and doctor visits. 

As already mentioned, many other factors could be influencing both variables, potentially hiding a true relationship or creating an artificial one.

If we consider this causal graph:

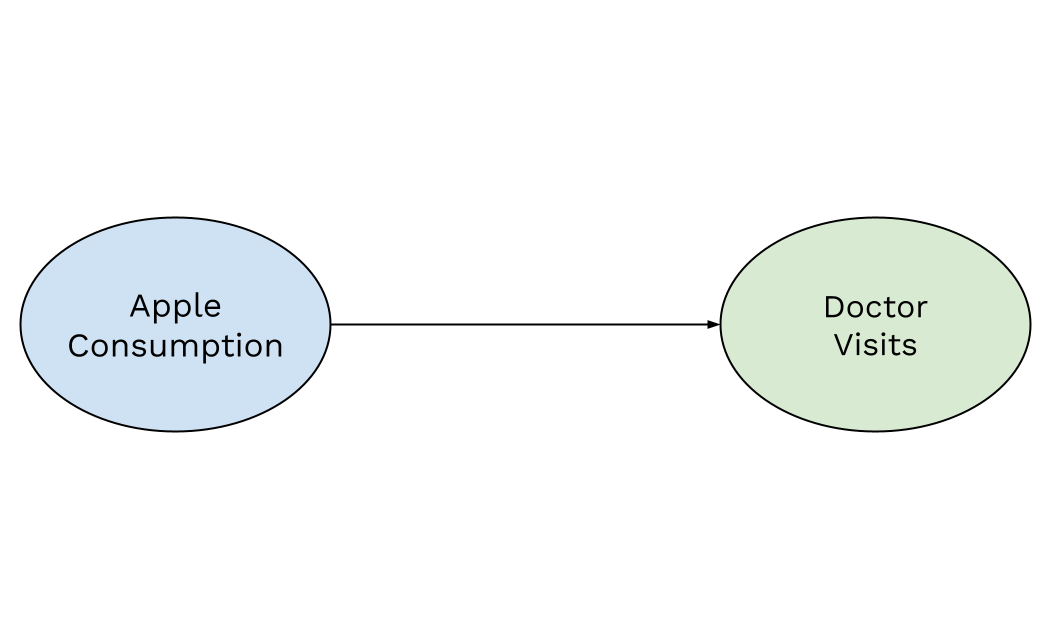
We are assuming that apple consumption directly affects doctor visits. However, other hidden factors might be at play. If we don’t account for them, we risk failing to detect a real relationship if one exists.

A well-known example where confounder variables are on display comes from a study by Messerli (2012), which found an interesting correlation between chocolate consumption per capita and the number of Nobel laureates. 

So, would starting to eat a lot of chocolate help us win a Nobel Prize? Probably not. The likely explanation was that GDP per capita was a confounder. That means that richer countries tend to have both higher chocolate consumption and more Nobel Prize winners. The observed relationship wasn’t causal but rather due to a hidden (confounding) factor.

The same thing could be happening in our case. There might be confounding variables that influence both apple consumption and doctor visits, making it difficult to see a real relationship if one exists. 

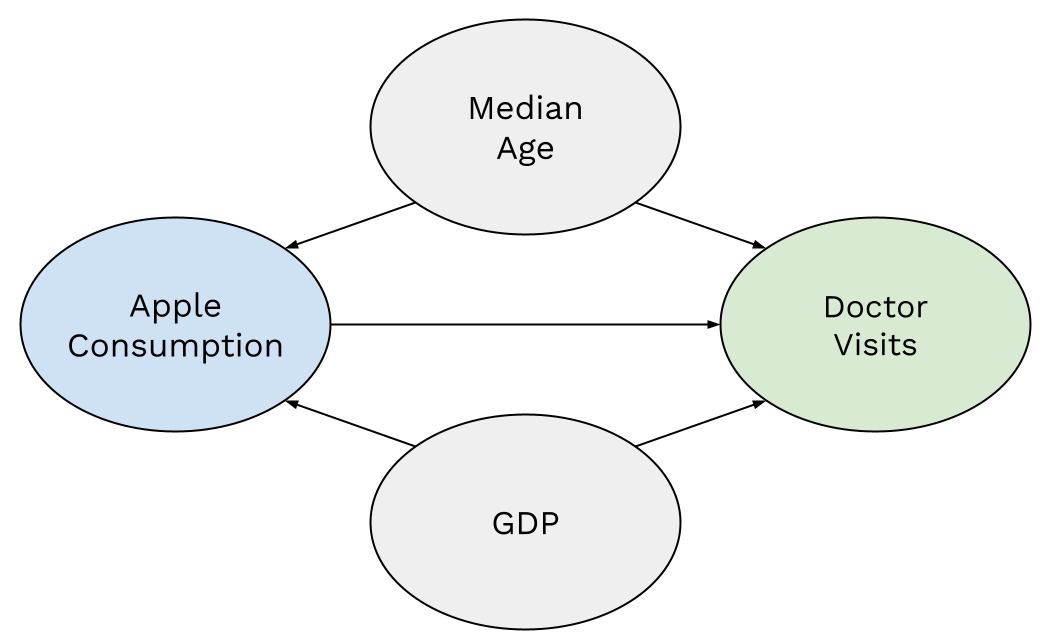
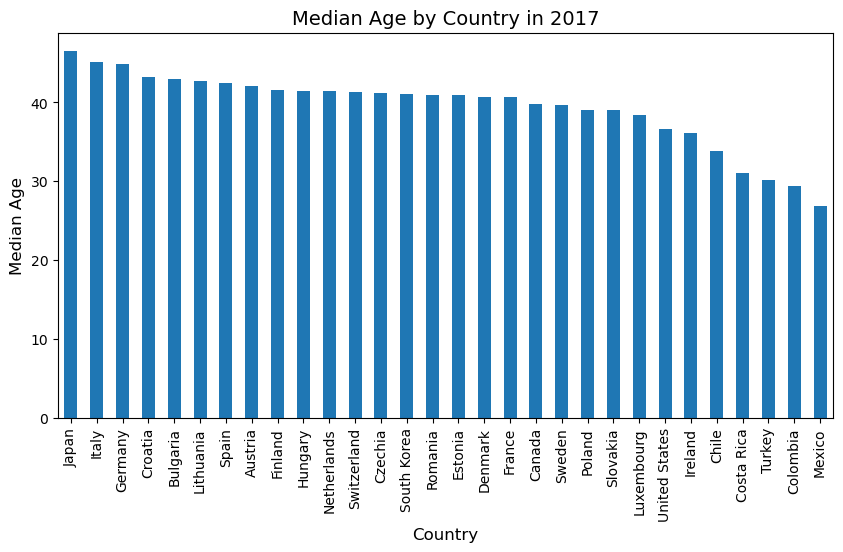
Two key confounders to consider are GDP per capita and median age. Wealthier countries have better healthcare systems and different dietary patterns, and older populations tend to visit doctors more often and may have different eating habits.

To control for this, we change our model by introducing these confounders:

Data sources

The data comes from:

Luxembourg had the highest GDP per capita, exceeding 115K USD, while Colombia had the lowest, at 14.3K USD.
Japan had the highest median age, at over 46 years, while Mexico had the lowest, at under 27 years.

OLS regression (with confounders)

After controlling for GDP per capita and median age, we run a multiple regression to test whether apple consumption has any meaningful effect on doctor visits.

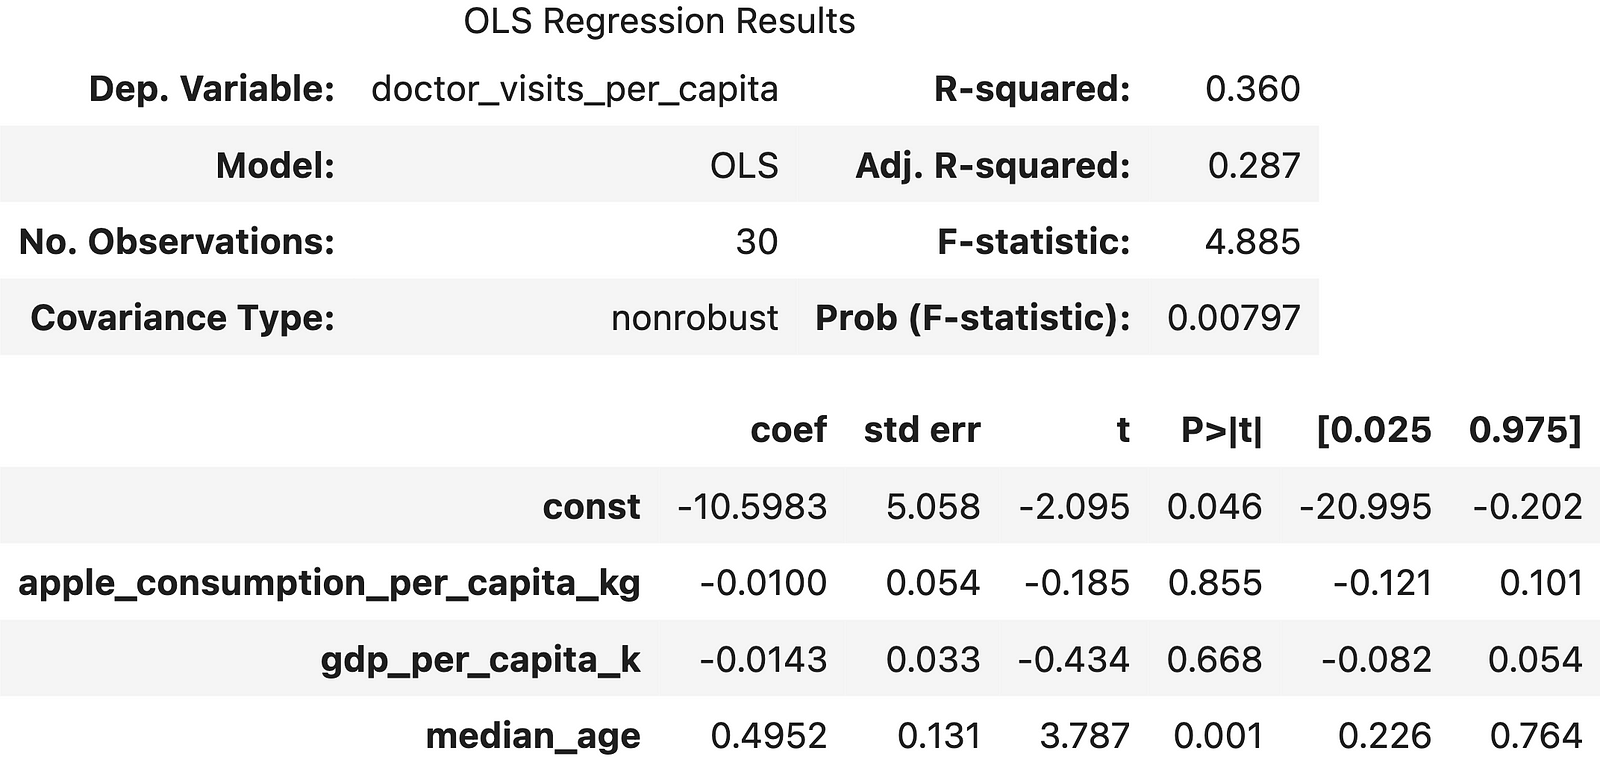
The results confirm what we observed earlier:

  • The coefficient for apple consumption remains very small(-0.0100), meaning any potential effect is negligible.
  • The p-value (85.5%) is still extremely high, far from statistical significance.
  • We still cannot reject the null hypothesis, meaning we have no strong evidence to support the idea that eating more apples leads to fewer doctor visits.

Same as before, this does not necessarily mean that no relationship exists, but rather that we cannot prove one using the available data. It could still be possible that the real effect is too small to detect or that there are yet other factors we didn’t include.

One interesting observation, however, is that GDP per capita also shows no significant relationship with doctor visits, as its p-value is 0.668 (66.8%), indicating that we couldn’t find in the data that wealth explains variations in healthcare usage.

On the other hand, median age appears to be strongly associated with doctor visits, with a p-value of 0.001 (0.1%) and a positive coefficient (0.4952). This suggests that older populations tend to visit doctors more frequently, which is actually not really surprising if we think about it!

So while we find no support for the apple myth, the data does reveal an interesting relationship between aging and healthcare usage.

Median age → Doctor visits

The results from the OLS regression showed a strong relationship between median age and doctor visits, and the visualization below confirms this trend.

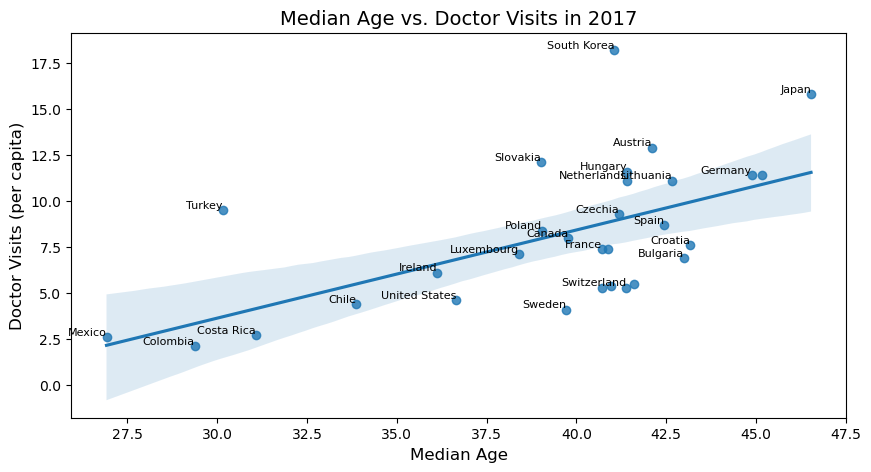
There is a clear upward trend, indicating that countries with older populations tend to have more doctor visits per capita

Since we are only looking at median age and doctor visits here, one could argue that GDP per capita might be a confounder, influencing both. However, the previous OLS regression demonstrated that even when GDP was included in the model, this relationship remained strong and statistically significant.

This suggests that median age is a key factor in explaining differences in doctor visits across countries, independent of GDP.

GDP Apple consumption

While not directly related to doctor visits, an interesting secondary finding emerges when looking at the relationship between GDP per capita and apple consumption

One possible explanation is that wealthier countries have better access to fresh products. Another possibility is that climate and geography play a role, so it could be that many high-GDP countries are located in regions with strong apple production, making apples more available and affordable. 

Of course, other factors could be influencing this relationship, but we won’t dig deeper here.

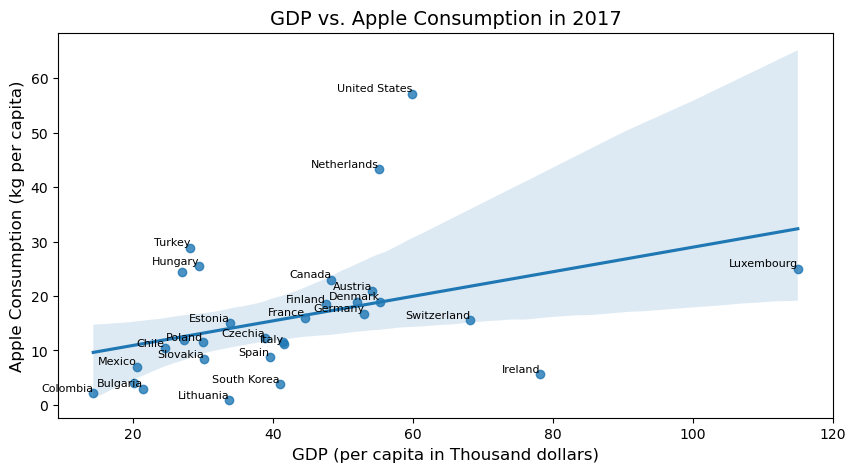
The scatterplot shows a positive correlation: as GDP per capita increases, apple consumption also tends to rise. However, compared to median age and doctor visits, this trend is weaker, with more variation in the data.

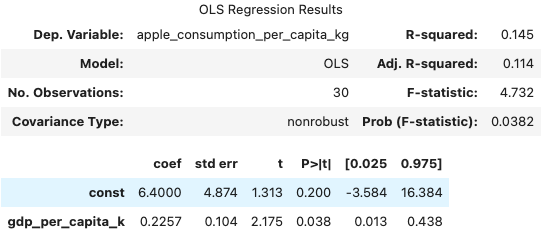
The OLS confirms the relationship: with a 0.2257 coefficient for GDP per capita, we can estimate an increase of around 0.23 kg in apple consumption per capita for each increase of $1,000 in GDP per capita.

The 3.8% p-value allows us to reject the null hypothesis. So the relationship is statistically significant. However, the R² value (0.145) is relatively low, so while GDP explains some variation in apple consumption, many other factors likely contribute. 

Conclusion

The saying goes:

“An apple a day keeps the doctor away,”

But after putting this myth to the test with real-world data, the results seem not in line with this saying. Across multiple years, the results were consistent: no meaningful relationship between apple consumption and doctor visits emerged, even after controlling for confounders. It seems that apples alone aren’t enough to keep the doctor away.

However, this doesn’t completely disprove the idea that eating more apples could reduce doctor visits. Observational data, no matter how well we control for confounders, can never fully prove or disprove causality. 

To get a more statistically accurate answer, and to rule out all possible confounders at a level of granularity that could be actionable for an individual, we would need to conduct an A/B test
In such an experiment, participants would be randomly assigned to two groups, for example one eating a fixed amount of apples daily and the other avoiding apples. By comparing doctor visits over time among these two groups, we could determine if any difference between them arise, providing stronger evidence of a causal effect.

For obvious reasons, I chose not to go that route. Hiring a bunch of participants would be expensive, and ethically forcing people to avoid apples for science is definitely questionable.

However, we did find some interesting patterns. The strongest predictor of doctor visits wasn’t apple consumption, but median age: the older a country’s population, the more often people see a doctor

Meanwhile, GDP showed a mild connection to apple consumption, possibly because wealthier countries have better access to fresh produce, or because apple-growing regions tend to be more developed.

So, while we can’t confirm the original myth, we can offer a less poetic, but data-backed version:

“A young age keeps the doctor away.”

If you enjoyed this analysis and want to connect, you can find me on LinkedIn

The full analysis is available in this notebook on GitHub.


Data Sources

Fruit Consumption: Food and Agriculture Organization of the United Nations (2023) — with major processing by Our World in Data. “Per capita consumption of apples — FAO” [dataset]. Food and Agriculture Organization of the United Nations, “Food Balances: Food Balances (-2013, old methodology and population)”; Food and Agriculture Organization of the United Nations, “Food Balances: Food Balances (2010-)” [original data]. Licensed under CC BY 4.0.

Doctor Visits: OECD (2024), Consultations, URL (accessed on January 22, 2025). Licensed under CC BY 4.0.

GDP per Capita: World Bank (2025) — with minor processing by Our World in Data. “GDP per capita — World Bank — In constant 2021 international $” [dataset]. World Bank, “World Bank World Development Indicators” [original data]. Retrieved January 31, 2025 from https://ourworldindata.org/grapher/gdp-per-capita-worldbank. Licensed under CC BY 4.0.

Median Age: UN, World Population Prospects (2024) — processed by Our World in Data. “Median age, medium projection — UN WPP” [dataset]. United Nations, “World Population Prospects” [original data]. Licensed under CC BY 4.0.


All images, unless otherwise noted, are by the author.

Shape
Shape
Stay Ahead

Explore More Insights

Stay ahead with more perspectives on cutting-edge power, infrastructure, energy,  bitcoin and AI solutions. Explore these articles to uncover strategies and insights shaping the future of industries.

Shape

Nvidia claims near 50% boost in AI storage speed

Storage is an overlooked element of AI that has been overshadowed by all the emphasis on processors, namely GPUs. Large language models (LLMs) measure in the terabytes of size and all that needs to be moved around to be processed. So the faster you can move data, the better, so

Read More »

Kyndryl expands Palo Alto deal to offer managed SASE service

Kyndryl has expanded its alliance with Palo Alto Networks to add secure access service edge (SASE) services to its managed services offerings. In 2023, when Kyndryl first said it would integrate Palo Alto’s security products and services into its own managed security services, the vendors said they would ultimately support

Read More »

AI-Powered Policing: The Future of Traffic Safety in Kazakhstan

Traffic management is a growing challenge for cities worldwide, requiring a balance between enforcement, efficiency, and public trust. In Kazakhstan, the Qorgau system is redefining road safety through an innovative fusion of artificial intelligence (AI), computer vision, and mobile technology. Designed to assist traffic police in real-time violation detection and

Read More »

Quantum networking advances on Earth and in space

“Currently, the U.S. government is not investing in such testbeds or demonstrations, ensuring it will be a follower and not a leader in the development of technical advances in the field,” said a report released last year by the Quantum Economic Development Consortium, a global association of more than 250

Read More »

ADNOC Gas Posts Record $5 Billion Annual Profit Driven by Domestic Demand

ADNOC Gas PLC achieved its highest-ever yearly net income in 2024 at $5 billion, driven by natural gas consumption in the United Arab Emirates. Net earnings for the fourth quarter of 2024 totaled $1.38 billion, ADNOC Gas’ highest quarterly result since its public listing in 2023, the company reported on its website. “The company’s strong performance was underpinned by robust demand for domestic gas which supported volume growth and improved pricing”, said ADNOC Gas, the integrated gas processing arm of Abu Dhabi National Oil Co. (ADNOC). Annual sales volumes grew two percent to 3,616 million MMBtu. ADNOC Gas supplies about 60 percent of the UAE’s sales gas needs, as well as supplies over twenty countries, according to the company. Adjusted revenue for 2024 rose seven percent year-on-year to $24.43 billion. “The company’s strong top-line performance for 2024 translated into a strong EBITDA growth of 14 percent to $8.65 billion with a high, stable margin of 35 percent”, ADNOC Gas said. For the fourth quarter, adjusted revenue was $6.06 billion and EBITDA $2.28 billion. “The robust improvement was driven by several factors including a richer mix of gas, producing more liquids, and improved commercial terms in the domestic market”, ADNOC Gas said. Year-end free cash flow was $4.58 billion, with the October-December period contributing $1.22 billion. ADNOC Gas declared a dividend of $3.41 billion for 2024, half of which was paid September 2024. It expects to distribute the remaining half this April. “The final dividend for FY 2024 is in line with the company’s robust policy to increase the annual dividend by 5 percent annually and reflects the company’s strong free cash flow, which exceeds the dividend commitment by over $1 billion”, it said. ADNOC Gas chief executive Fatema Al Nuaimi commented, “Our record-breaking fourth quarter results demonstrate our ability to

Read More »

Ørsted steered steady course through troubled waters in 2024

Ørsted (CPH: ORSTED) saw its revenues increase in 2024 compared to 2023, in line with expectations, though the company was still weighed down by impairments on its US projects. The company’s board of directors approved the annual report for 2024, which saw operating profit for 2024 hit 32 billion Danish kroner (£3.5b) compared to 18.7b kroner (£2b) in 2023. A total of 7.3b kroner (£814m) of this came from the company renegotiating and settling contracts related to the close-down of its US offshore wind development Ocean Wind with a better than assumed outcome. Furthermore, earnings from the company’s offshore sites amounted to 23.8b kroner (£2.6b), which was an increase of 3.6b kroner (£401m) compared to 2023. The increase was driven by the ramp-up of generation at the company’s offshore wind farms Greater Changhua 1 and 2a in Taiwan, South Fork in the US, and Gode Wind 3 in Germany, along with higher wind speeds and higher prices on its inflation-indexed CfDs and green certificates. However, impairments continued to dog the Danish wind developer in 2024, coming in at 15.6b kroner (£1.7b), with the majority (14.1b kroner, or £1.5b) relating to the company’s US projects. The US impairments were driven by an increase in the US long-dated interest rate, a lower market-informed valuation of its US seabeds, construction delays, and higher expected costs for Revolution Wind and Sunrise Wind projects in the US. Ørsted forecast that its 2025 EBITDA excluding new partnership agreements and cancellation fees will be in the 25-28b kroner (£2.7-3.1b) range, and gross investments are expected to be 50-54b kroner (£5.5-6b). Ørsted saw a change in CEO last week, with former head Mads Nipper leaving his position in favour of then deputy CEO and chief commercial officer Rasmus Errboe. Since the announcement of significant impairment on its US

Read More »

UK forecast to miss 2035 emissions-reduction targets

A report by DNV suggests gas consumption will fall to 12% by the end of the decade, more than double NESO’s recommendations. The UK is expected to miss its emissions-reduction targets under the recently committed Nationally Determined Contribution of an 81% reduction by 2035 compared to 1990 levels, according to a report by energy advisory DNV. Decarbonisation efforts are anticipated to lead to a reduction in greenhouse gas emissions of 68% by 2035, and 82% by 2050, against 1990 levels – but to fall short of net zero. Renewable energy capacity, including solar, onshore wind and offshore wind, is expected to double in the next six years to 90 GW by 2030. However, according to DNV estimates, this remains 45 GW short of government targets to double onshore wind, triple solar and quadruple offshore wind. The UK will have to reduce emissions by 62% from 405 million tonnes of carbon dioxide equivalent per year (MtCO2eq/yr) to 155 MtCO2eq/yr by 2035 in order to achieve national clean power targets. However, DNV’s medium-term forecast suggests that the UK will be able to reduce emissions by only 35% by 2035. Hari Vamadevan, the firm’s executive vice president and regional director in the UK and Ireland for energy systems, said: “Despite economic and geopolitical challenges, the UK’s trajectory remains positive. “A substantial green prize for our economy – cleaner and more affordable energy, is there for the taking if we can grasp it. We must act swiftly to ensure we make decisive moves along the correct path.” The proportion of fossil fuels in the energy supply mix is expected to fall from 75% today to 34% by 2050, with low-carbon sources predicted to “surpass fossil fuels in the supply mix”. But according to the advisory, oil and gas are expected to remain “dominant” sources

Read More »

Moldova Inks Agreement for EU Help toward Independence from Russian Energy

The European Commission has signed a deal with Moldova to help the country decouple from Russian energy supply and fully integrate into the European Union energy market. The agreement includes a EUR 250 million ($240.78 million) support package from the EU for 2025. Part of the funding has already been disbursed. Part of the funding meant for the Transnistrian region, or the Left Bank, is subject to the fulfilment of EU demands for fundamental freedoms and human rights, according to an online statement by the Commission. In the Right Bank, the agreement, called the Comprehensive Strategy for Energy Independence and Resilience of Moldova, will compensate excess electricity costs for households for up to 110 kilowatt hours every month until December 2025. The two-year strategy will also include a hardship fund to lighten the energy bills of the “most exposed households” and compensate for the entire increase in power costs for social institutions, including schools and hospitals. The plan has also allotted EUR 15 million for agro-food and manufacturing businesses. “Furthermore, through the mobilization of international financial institutions, additional funding of EUR 50 million will be available for sustainable investments in energy efficiency projects by local public authorities, households and SMEs [small and medium enterprises]”, the Commission said. In the Left Bank, EUR 60 million is conditionally available for over 350,000 people affected by the discontinuation of supply by Russia’s Gazprom PJSC, the Commission said. “This support is subject to steps being taken on fundamental freedoms and human rights in the Transnistrian region and excludes energy-intensive activities”, it said. Currently Moldova’s energy system is delivering power and heat without blackouts, according to the Commission. “In the longer term, the EU support will allow Moldova to improve its energy security through investments and reforms for the energy transition and ensure the full phase-out of Russian

Read More »

UK government urged to ‘make a decision’ quickly on zonal pricing

Delays to a decision on zonal electricity pricing are an “albatross around the neck” of UK renewable energy developers, a parliamentary committee has heard. Energy UK director of policy and advocacy Adam Berman said the review of electricity market arrangements (REMA) process has “gone on endlessly now”. Berman said industry developers want to see a quick decision on locational pricing reforms as well as more information on “crucial elements” of how the scheme may be grandfathered in for existing projects. He told the Energy Security and Net Zero committee hearing that “no one knows which way the government’s going to go” and called for clarity as soon as possible. Launched in 2022 under the previous Conservative government, the REMA process is exploring reform options which could split the UK into regional electricity markets. In December, the Department for Energy Security and Net Zero (DESNZ) said no decision has been taken between zonal pricing or “reformed national pricing”. However, DESNZ confirmed the current status quo is “not an option”. The issue of zonal pricing has divided the sector amid concerns over the potential impact on renewable energy investment, particularly in Scotland. AR7 and zonal pricing concerns Berman told Westminster MPs that unless a decision is made on zonal pricing soon, it could impact bids in the seventh renewable auction round (AR7) later this year. The UK government is aiming to achieve the “biggest and most successful” renewables auction round ever in 2025, but Berman warned developers could simply walk away without clarity on zonal pricing. “The government is not considering implementing any of this until after 2030, but nonetheless we have a lot of investment we need [up] until 2030,” he said. © Supplied by Ocean WindsInstallation of the first turbine at the Moray West offshore wind farm in Scotland. “I

Read More »

From waste to worth: the CO2 opportunity

Carbon dioxide has long been the villain of the world’s energy outlook. But what if it is more complex? What if industry’s most notorious waste product could be something more – could actually have value? From sustainable aviation fuel (SAF) to construction materials, to foodstuffs and more – companies are rethinking CO2 as a feedstock for the circular economy. Carbon capture and utilisation (CCU) is not new, but could play a crucial role in delivering net zero and challenges the idea that emissions must simply be buried. Size of the prize To have any chance at achieving net zero by 2050, the world will need to tackle its CO2 problem. The largest share of this is likely to be via carbon capture and storage (CCS), rather than CCU. The International Energy Agency puts current capacity at around 50 million tonnes per year (tpy). It projects this will reach 435mn tpy by 2030. Sasol carbon manager Kevin Dale raises some questions around how much CO2 an economy could use. “It has an appeal in these early stages because you can potentially produce a product with value,” he says. “For instance, we could make calcium carbonate grains, powders that can be used as fillers in products, paints or whatever. But the scale is going to be a problem.” He also cites other opportunities such as e-fuels or battery electrolytes. “But we need to be talking about putting away multiple gigatonnes via CCS. To put away very, very large quantities, what the geological storage offers is scale.” But that is not to say there is no case for utilisation. For one thing, it puts a value on a waste product. But it also helps start to tackle the world’s CO2 problem, rather than just waiting for a perfect solution. Thinking of carbon from

Read More »

Linux containers in 2025 and beyond

The upcoming years will also bring about an increase in the use of standard container practices, such as the Open Container Initiative (OCI) standard, container registries, signing, testing, and GitOps workflows used for application development to build Linux systems. We’re also likely see a significant rise in the use of bootable containers, which are self-contained images that can boot directly into an operating system or application environment. Cloud platforms are often the primary platform for AI experimentation and container development because of their scalability and flexibility along the integration of both AI and ML services. They’re giving birth to many significant changes in the way we process data. With data centers worldwide, cloud platforms also ensure low-latency access and regional compliance for AI applications. As we move ahead, development teams will be able to collaborate more easily through shared development environments and efficient data storage.

Read More »

Let’s Go Build Some Data Centers: PowerHouse Drives Hyperscale and AI Infrastructure Across North America

PowerHouse Data Centers, a leading developer and builder of next-generation hyperscale data centers and a division of American Real Estate Partners (AREP), is making significant strides in expanding its footprint across North America, initiating several key projects and partnerships as 2025 begins.  The new developments underscore the company’s commitment to advancing digital infrastructure to meet the growing demands of hyperscale and AI-driven applications. Let’s take a closer look at some of PowerHouse Data Centers’ most recent announcements. Quantum Connect: Bridging the AI Infrastructure Gap in Ashburn On January 17, PowerHouse Data Centers announced a collaboration with Quantum Connect to develop Ashburn’s first fiber hub specifically designed for AI and high-density workloads. This facility is set to provide 20 MW of critical power, with initial availability slated for late 2026.  Strategically located in Northern Virginia’s Data Center Alley, Quantum Connect aims to offer scalable, high-density colocation solutions, featuring rack densities of up to 30kW to support modern workloads such as AI inference, edge caching, and regional compute integration. Quantum Connect said it currently has 1-3 MW private suites available for businesses seeking high-performance infrastructure that bridges the gap between retail colocation and hyperscale facilities. “Quantum Connect redefines what Ashburn’s data center market can deliver for businesses caught in the middle—those too large for retail colocation yet underserved by hyperscale environments,” said Matt Monaco, Senior Vice President at PowerHouse Data Centers. “We’re providing high-performance solutions for tenants with demanding needs but without hyperscale budgets.” Anchored by 130 miles of private conduit and 2,500 fiber pathways, Quantum Connect’s infrastructure offers tenants direct, short-hop connections to adjacent facilities and carrier networks.  With 14 campus entrances and secure, concrete-encased duct banks, the partners said the new facility minimizes downtime risks and reduces operational costs by eliminating the need for new optics or extended fiber runs.

Read More »

Blue Owl Swoops In As Major Backer of New, High-Profile, Sustainable U.S. Data Center Construction

With the global demand for data centers continuing to surge ahead, fueled by the proliferation of artificial intelligence (AI), cloud computing, and digital services, it is unsurprising that we are seeing aggressive investment strategies, beyond those of the existing hyperscalers. One of the dynamic players in this market is Blue Owl Capital, a leading asset management firm that has made significant strides in the data center sector. Back in October 2024 we reported on its acquisition of IPI Partners, a digital infrastructure fund manager, for approximately $1 billion. This acquisition added over $11 billion to the assets Blue Owl manages and focused specifically on digital infrastructure initiatives. This acquisition was completed as of January 5, 2025 and IPI’s Managing Partner, Matt A’Hearn has been appointed Head of Blue Owl’s digital infrastructure strategy. A Key Player In Digital Infrastructure and Data Centers With multi-billion-dollar joint ventures and financing initiatives, Blue Owl is positioning itself as a key player in the digital infrastructure space. The company investments in data centers, the implications of its strategic moves, and the broader impact on the AI and digital economy highlights the importance of investment in the data center to the economy overall. With the rapid growth of the data center industry, it is unsurprising that aggressive investment fund management is seeing it as an opportunity. Analysts continue to emphasize that the global data center market is expected to grow at a compound annual growth rate (CAGR) of 10.2% from 2023 to 2030, reaching $517.17 billion by the end of the decade. In this rapidly evolving landscape, Blue Owl Capital has emerged as a significant contributor. The firm’s investments in data centers are not just about capitalizing on current trends but also about shaping the future of digital infrastructure. Spreading the Wealth In August 2024, Blue Owl

Read More »

Global Data Center Operator Telehouse Launches Liquid Cooling Lab in the UK to Meet Ongoing AI and HPC Demand

@import url(‘/fonts/fira_sans.css’); a { color: #0074c7; } .ebm-page__main h1, .ebm-page__main h2, .ebm-page__main h3, .ebm-page__main h4, .ebm-page__main h5, .ebm-page__main h6 { font-family: “Fira Sans”, Arial, sans-serif; } body { letter-spacing: 0.025em; font-family: “Fira Sans”, Arial, sans-serif; } button, .ebm-button-wrapper { font-family: “Fira Sans”, Arial, sans-serif; } .label-style { text-transform: uppercase; color: var(–color-grey); font-weight: 600; font-size: 0.75rem; } .caption-style { font-size: 0.75rem; opacity: .6; } #onetrust-pc-sdk [id*=btn-handler], #onetrust-pc-sdk [class*=btn-handler] { background-color: #005ea0 !important; border-color: #005ea0 !important; } #onetrust-policy a, #onetrust-pc-sdk a, #ot-pc-content a { color: #005ea0 !important; } #onetrust-consent-sdk #onetrust-pc-sdk .ot-active-menu { border-color: #005ea0 !important; } #onetrust-consent-sdk #onetrust-accept-btn-handler, #onetrust-banner-sdk #onetrust-reject-all-handler, #onetrust-consent-sdk #onetrust-pc-btn-handler.cookie-setting-link { background-color: #005ea0 !important; border-color: #005ea0 !important; } #onetrust-consent-sdk .onetrust-pc-btn-handler { color: #005ea0 !important; border-color: #005ea0 !important; background-color: undefined !important; } Starting in early 2025, Telehouse International Corporation of Europe will offer an advanced liquid cooling lab at their newest data center, Telehouse South at the London Docklands campus in Blackwall Yard. Telehouse has partnered with four leading liquid-cooling technology vendors — Accelsius, JetCool, Legrand, and EkkoSense — to allow customers to explore different cooling technologies and management tools while evaluating suitability for their use in the customer applications. Dr. Stu Redshaw, Chief Technology and Innovation Officer at EkkoSense, said about the project: Given that it’s not possible to run completely liquid-cooled data centers, the reality for most data center operators is that liquid cooling and air cooling will have an important role to play in the cooling mix – most likely as part of an evolving hybrid cooling approach. However, key engineering questions need answering before simply deploying liquid cooling – including establishing the exact blend of air and liquid cooling technologies you’ll need. And also recognizing the complexity of managing the operation of a hybrid air cooling and liquid cooling approach within the same room. This increases the

Read More »

Flexential Partners with Lonestar to Support First Lunar Data Center

Flexential, a leading provider of secure and flexible data center solutions, this month announced that it has joined forces with Lonestar Data Holdings Inc. to support the upcoming launch of Freedom, Lonestar’s second lunar data center. Scheduled to launch aboard a SpaceX Falcon 9 rocket via Intuitive Machines, this mission is a critical step toward establishing a permanent data center on the Moon. Ground-Based Support for Lunar Data Storage Flexential’s Tampa data center will serve as the mission control platform for Lonestar’s lunar operations, providing colocation, interconnection, and professional services. The facility was chosen for its proximity to Florida’s Space Coast launch operations and its ability to deliver low-latency connectivity for critical functions. Flexential operates two data centers in Tampa and four in Florida as part of its FlexAnywhere® Platform, comprising more than 40 facilities across the U.S. “Flexential’s partnership with Lonestar represents our commitment to advancing data center capabilities beyond conventional boundaries,” said Jason Carolan, Chief Innovation Officer at Flexential. “By supporting Lonestar’s space-based data center initiative, we are helping to create new possibilities for data storage and disaster recovery. This project demonstrates how innovative data center expertise can help organizations prepare for a resilient future with off-world storage solutions.” A New Era of Space-Based Resiliency The growing demand for data center capacity, with U.S. power consumption expected to double from 17 GW in 2022 to 35 GW by 2030 (according to McKinsey & Company), is driving interest in space-based solutions. Storing data off-planet reduces reliance on terrestrial resources while enhancing security against natural disasters, warfare, and cyber threats. The Freedom data center will provide resiliency, disaster recovery, and edge processing services for government and enterprise customers requiring the highest levels of data protection. The solar-powered data center leverages Solid-State Drives (SSDs) and a Field Programmable Gate Array (FPGA) edge

Read More »

Why DeepSeek Is Great for AI and HPC and Maybe No Big Deal for Data Centers

In the rapid and ever-evolving landscape of artificial intelligence (AI) and high-performance computing (HPC), the emergence of DeepSeek’s R1 model has sent ripples across industries. DeepSeek has been the data center industry’s topic of the week, for sure. The Chinese AI app surged to the top of US app store leaderboards last weekend, sparking a global selloff in technology shares Monday morning.  But while some analysts predict a transformative impact within the industry, a closer examination suggests that, for data centers at large, the furor over DeepSeek might ultimately be much ado about nothing. DeepSeek’s Breakthrough in AI and HPC DeepSeek, a Chinese AI startup, this month unveiled its R1 model, claiming performance on par with, or even surpassing, leading models like OpenAI’s ChatGPT-4 and Anthropic’s Claude-3.5-Sonnet. Remarkably, DeepSeek developed this model at a fraction of the cost typically associated with such advancements, utilizing a cluster of 256 server nodes equipped with 2,048 GPUs. This efficiency has been attributed to innovative techniques and optimized resource utilization. AI researchers have been abuzz about the performance of the DeepSeek chatbot that produces results similar to ChatGPT, but is based on open-source models and reportedly trained on older GPU chips. Some researchers are skeptical of claims about DeepSeek’s development costs and means, but its performance appears to challenge common assumptions about the computing cost of developing AI applications. This efficiency has been attributed to innovative techniques and optimized resource utilization.  Market Reactions and Data Center Implications The announcement of DeepSeek’s R1 model led to significant market reactions, with notable declines in tech stocks, including a substantial drop in Nvidia’s valuation. This downturn was driven by concerns that more efficient AI models could reduce the demand for high-end hardware and, by extension, the expansive data centers that house them. For now, investors are re-assessing the

Read More »

Microsoft will invest $80B in AI data centers in fiscal 2025

And Microsoft isn’t the only one that is ramping up its investments into AI-enabled data centers. Rival cloud service providers are all investing in either upgrading or opening new data centers to capture a larger chunk of business from developers and users of large language models (LLMs).  In a report published in October 2024, Bloomberg Intelligence estimated that demand for generative AI would push Microsoft, AWS, Google, Oracle, Meta, and Apple would between them devote $200 billion to capex in 2025, up from $110 billion in 2023. Microsoft is one of the biggest spenders, followed closely by Google and AWS, Bloomberg Intelligence said. Its estimate of Microsoft’s capital spending on AI, at $62.4 billion for calendar 2025, is lower than Smith’s claim that the company will invest $80 billion in the fiscal year to June 30, 2025. Both figures, though, are way higher than Microsoft’s 2020 capital expenditure of “just” $17.6 billion. The majority of the increased spending is tied to cloud services and the expansion of AI infrastructure needed to provide compute capacity for OpenAI workloads. Separately, last October Amazon CEO Andy Jassy said his company planned total capex spend of $75 billion in 2024 and even more in 2025, with much of it going to AWS, its cloud computing division.

Read More »

John Deere unveils more autonomous farm machines to address skill labor shortage

Join our daily and weekly newsletters for the latest updates and exclusive content on industry-leading AI coverage. Learn More Self-driving tractors might be the path to self-driving cars. John Deere has revealed a new line of autonomous machines and tech across agriculture, construction and commercial landscaping. The Moline, Illinois-based John Deere has been in business for 187 years, yet it’s been a regular as a non-tech company showing off technology at the big tech trade show in Las Vegas and is back at CES 2025 with more autonomous tractors and other vehicles. This is not something we usually cover, but John Deere has a lot of data that is interesting in the big picture of tech. The message from the company is that there aren’t enough skilled farm laborers to do the work that its customers need. It’s been a challenge for most of the last two decades, said Jahmy Hindman, CTO at John Deere, in a briefing. Much of the tech will come this fall and after that. He noted that the average farmer in the U.S. is over 58 and works 12 to 18 hours a day to grow food for us. And he said the American Farm Bureau Federation estimates there are roughly 2.4 million farm jobs that need to be filled annually; and the agricultural work force continues to shrink. (This is my hint to the anti-immigration crowd). John Deere’s autonomous 9RX Tractor. Farmers can oversee it using an app. While each of these industries experiences their own set of challenges, a commonality across all is skilled labor availability. In construction, about 80% percent of contractors struggle to find skilled labor. And in commercial landscaping, 86% of landscaping business owners can’t find labor to fill open positions, he said. “They have to figure out how to do

Read More »

2025 playbook for enterprise AI success, from agents to evals

Join our daily and weekly newsletters for the latest updates and exclusive content on industry-leading AI coverage. Learn More 2025 is poised to be a pivotal year for enterprise AI. The past year has seen rapid innovation, and this year will see the same. This has made it more critical than ever to revisit your AI strategy to stay competitive and create value for your customers. From scaling AI agents to optimizing costs, here are the five critical areas enterprises should prioritize for their AI strategy this year. 1. Agents: the next generation of automation AI agents are no longer theoretical. In 2025, they’re indispensable tools for enterprises looking to streamline operations and enhance customer interactions. Unlike traditional software, agents powered by large language models (LLMs) can make nuanced decisions, navigate complex multi-step tasks, and integrate seamlessly with tools and APIs. At the start of 2024, agents were not ready for prime time, making frustrating mistakes like hallucinating URLs. They started getting better as frontier large language models themselves improved. “Let me put it this way,” said Sam Witteveen, cofounder of Red Dragon, a company that develops agents for companies, and that recently reviewed the 48 agents it built last year. “Interestingly, the ones that we built at the start of the year, a lot of those worked way better at the end of the year just because the models got better.” Witteveen shared this in the video podcast we filmed to discuss these five big trends in detail. Models are getting better and hallucinating less, and they’re also being trained to do agentic tasks. Another feature that the model providers are researching is a way to use the LLM as a judge, and as models get cheaper (something we’ll cover below), companies can use three or more models to

Read More »

OpenAI’s red teaming innovations define new essentials for security leaders in the AI era

Join our daily and weekly newsletters for the latest updates and exclusive content on industry-leading AI coverage. Learn More OpenAI has taken a more aggressive approach to red teaming than its AI competitors, demonstrating its security teams’ advanced capabilities in two areas: multi-step reinforcement and external red teaming. OpenAI recently released two papers that set a new competitive standard for improving the quality, reliability and safety of AI models in these two techniques and more. The first paper, “OpenAI’s Approach to External Red Teaming for AI Models and Systems,” reports that specialized teams outside the company have proven effective in uncovering vulnerabilities that might otherwise have made it into a released model because in-house testing techniques may have missed them. In the second paper, “Diverse and Effective Red Teaming with Auto-Generated Rewards and Multi-Step Reinforcement Learning,” OpenAI introduces an automated framework that relies on iterative reinforcement learning to generate a broad spectrum of novel, wide-ranging attacks. Going all-in on red teaming pays practical, competitive dividends It’s encouraging to see competitive intensity in red teaming growing among AI companies. When Anthropic released its AI red team guidelines in June of last year, it joined AI providers including Google, Microsoft, Nvidia, OpenAI, and even the U.S.’s National Institute of Standards and Technology (NIST), which all had released red teaming frameworks. Investing heavily in red teaming yields tangible benefits for security leaders in any organization. OpenAI’s paper on external red teaming provides a detailed analysis of how the company strives to create specialized external teams that include cybersecurity and subject matter experts. The goal is to see if knowledgeable external teams can defeat models’ security perimeters and find gaps in their security, biases and controls that prompt-based testing couldn’t find. What makes OpenAI’s recent papers noteworthy is how well they define using human-in-the-middle

Read More »