Stay Ahead, Stay ONMINE

A Visual Guide to How Diffusion Models Work

This article is aimed at those who want to understand exactly how Diffusion Models work, with no prior knowledge expected. I’ve tried to use illustrations wherever possible to provide visual intuitions on each part of these models. I’ve kept mathematical notation and equations to a minimum, and where they are necessary I’ve tried to define […]

This article is aimed at those who want to understand exactly how Diffusion Models work, with no prior knowledge expected. I’ve tried to use illustrations wherever possible to provide visual intuitions on each part of these models. I’ve kept mathematical notation and equations to a minimum, and where they are necessary I’ve tried to define and explain them as they occur.

Intro

I’ve framed this article around three main questions:

  • What exactly is it that diffusion models learn?
  • How and why do diffusion models work?
  • Once you’ve trained a model, how do you get useful stuff out of it?

The examples will be based on the glyffuser, a minimal text-to-image diffusion model that I previously implemented and wrote about. The architecture of this model is a standard text-to-image denoising diffusion model without any bells or whistles. It was trained to generate pictures of new “Chinese” glyphs from English definitions. Have a look at the picture below — even if you’re not familiar with Chinese writing, I hope you’ll agree that the generated glyphs look pretty similar to the real ones!
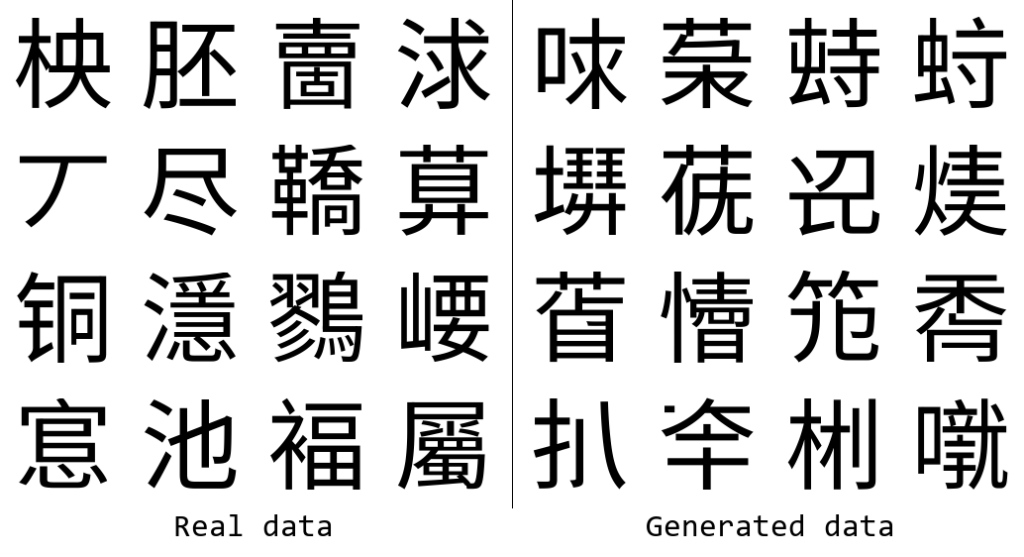
Random examples of glyffuser training data (left) and generated data (right).

What exactly is it that diffusion models learn?

Generative Ai models are often said to take a big pile of data and “learn” it. For text-to-image diffusion models, the data takes the form of pairs of images and descriptive text. But what exactly is it that we want the model to learn? First, let’s forget about the text for a moment and concentrate on what we are trying to generate: the images.

Probability distributions

Broadly, we can say that we want a generative AI model to learn the underlying probability distribution of the data. What does this mean? Consider the one-dimensional normal (Gaussian) distribution below, commonly written 𝒩(μ,σ²) and parameterized with mean μ = 0 and variance σ² = 1. The black curve below shows the probability density function. We can sample from it: drawing values such that over a large number of samples, the set of values reflects the underlying distribution. These days, we can simply write something like x = random.gauss(0, 1) in Python to sample from the standard normal distribution, although the computational sampling process itself is non-trivial!
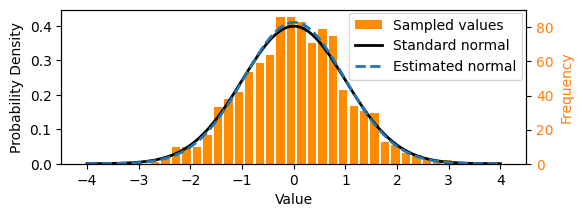
Values sampled from an underlying distribution (here, the standard normal 𝒩(0,1)) can then be used to estimate the parameters of that distribution.

We could think of a set of numbers sampled from the above normal distribution as a simple dataset, like that shown as the orange histogram above. In this particular case, we can calculate the parameters of the underlying distribution using maximum likelihood estimation, i.e. by working out the mean and variance. The normal distribution estimated from the samples is shown by the dotted line above. To take some liberties with terminology, you might consider this as a simple example of “learning” an underlying probability distribution. We can also say that here we explicitly learnt the distribution, in contrast with the implicit methods that diffusion models use.

Conceptually, this is all that generative AI is doing — learning a distribution, then sampling from that distribution!

Data representations

What, then, does the underlying probability distribution of a more complex dataset look like, such as that of the image dataset we want to use to train our diffusion model?

First, we need to know what the representation of the data is. Generally, a machine learning (ML) model requires data inputs with a consistent representation, i.e. format. For the example above, it was simply numbers (scalars). For images, this representation is commonly a fixed-length vector.

The image dataset used for the glyffuser model is ~21,000 pictures of Chinese glyphs. The images are all the same size, 128 × 128 = 16384 pixels, and greyscale (single-channel color). Thus an obvious choice for the representation is a vector x of length 16384, where each element corresponds to the color of one pixel: x = (x,x₂,…,x₁₆₃₈₄). We can call the domain of all possible images for our dataset “pixel space”.

An example glyph with pixel values labelled (downsampled to 32 × 32 pixels for readability).

Dataset visualization

We make the assumption that our individual data samples, x, are actually sampled from an underlying probability distribution, q(x), in pixel space, much as the samples from our first example were sampled from an underlying normal distribution in 1-dimensional space. Note: the notation x q(x) is commonly used to mean: “the random variable x sampled from the probability distribution q(x).”

This distribution is clearly much more complex than a Gaussian and cannot be easily parameterized — we need to learn it with a ML model, which we’ll discuss later. First, let’s try to visualize the distribution to gain a better intution.

As humans find it difficult to see in more than 3 dimensions, we need to reduce the dimensionality of our data. A small digression on why this works: the manifold hypothesis posits that natural datasets lie on lower dimensional manifolds embedded in a higher dimensional space — think of a line embedded in a 2-D plane, or a plane embedded in 3-D space. We can use a dimensionality reduction technique such as UMAP to project our dataset from 16384 to 2 dimensions. The 2-D projection retains a lot of structure, consistent with the idea that our data lie on a lower dimensional manifold embedded in pixel space. In our UMAP, we see two large clusters corresponding to characters in which the components are arranged either horizontally (e.g. 明) or vertically (e.g. 草). An interactive version of the plot below with popups on each datapoint is linked here.
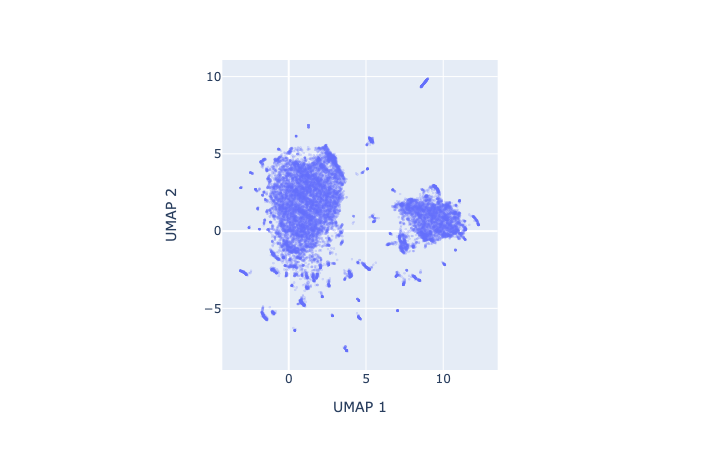
 Click here for an interactive version of this plot.

Let’s now use this low-dimensional UMAP dataset as a visual shorthand for our high-dimensional dataset. Remember, we assume that these individual points have been sampled from a continuous underlying probability distribution q(x). To get a sense of what this distribution might look like, we can apply a KDE (kernel density estimation) over the UMAP dataset. (Note: this is just an approximation for visualization purposes.)
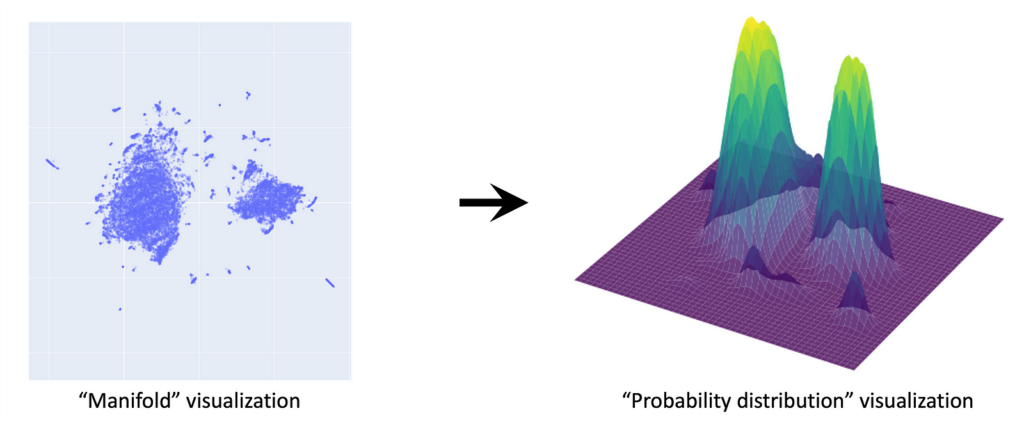
This gives a sense of what q(x) should look like: clusters of glyphs correspond to high-probability regions of the distribution. The true q(x) lies in 16384 dimensions — this is the distribution we want to learn with our diffusion model.

We showed that for a simple distribution such as the 1-D Gaussian, we could calculate the parameters (mean and variance) from our data. However, for complex distributions such as images, we need to call on ML methods. Moreover, what we will find is that for diffusion models in practice, rather than parameterizing the distribution directly, they learn it implicitly through the process of learning how to transform noise into data over many steps.

Takeaway

The aim of generative AI such as diffusion models is to learn the complex probability distributions underlying their training data and then sample from these distributions.

How and why do diffusion models work?

Diffusion models have recently come into the spotlight as a particularly effective method for learning these probability distributions. They generate convincing images by starting from pure noise and gradually refining it. To whet your interest, have a look at the animation below that shows the denoising process generating 16 samples.
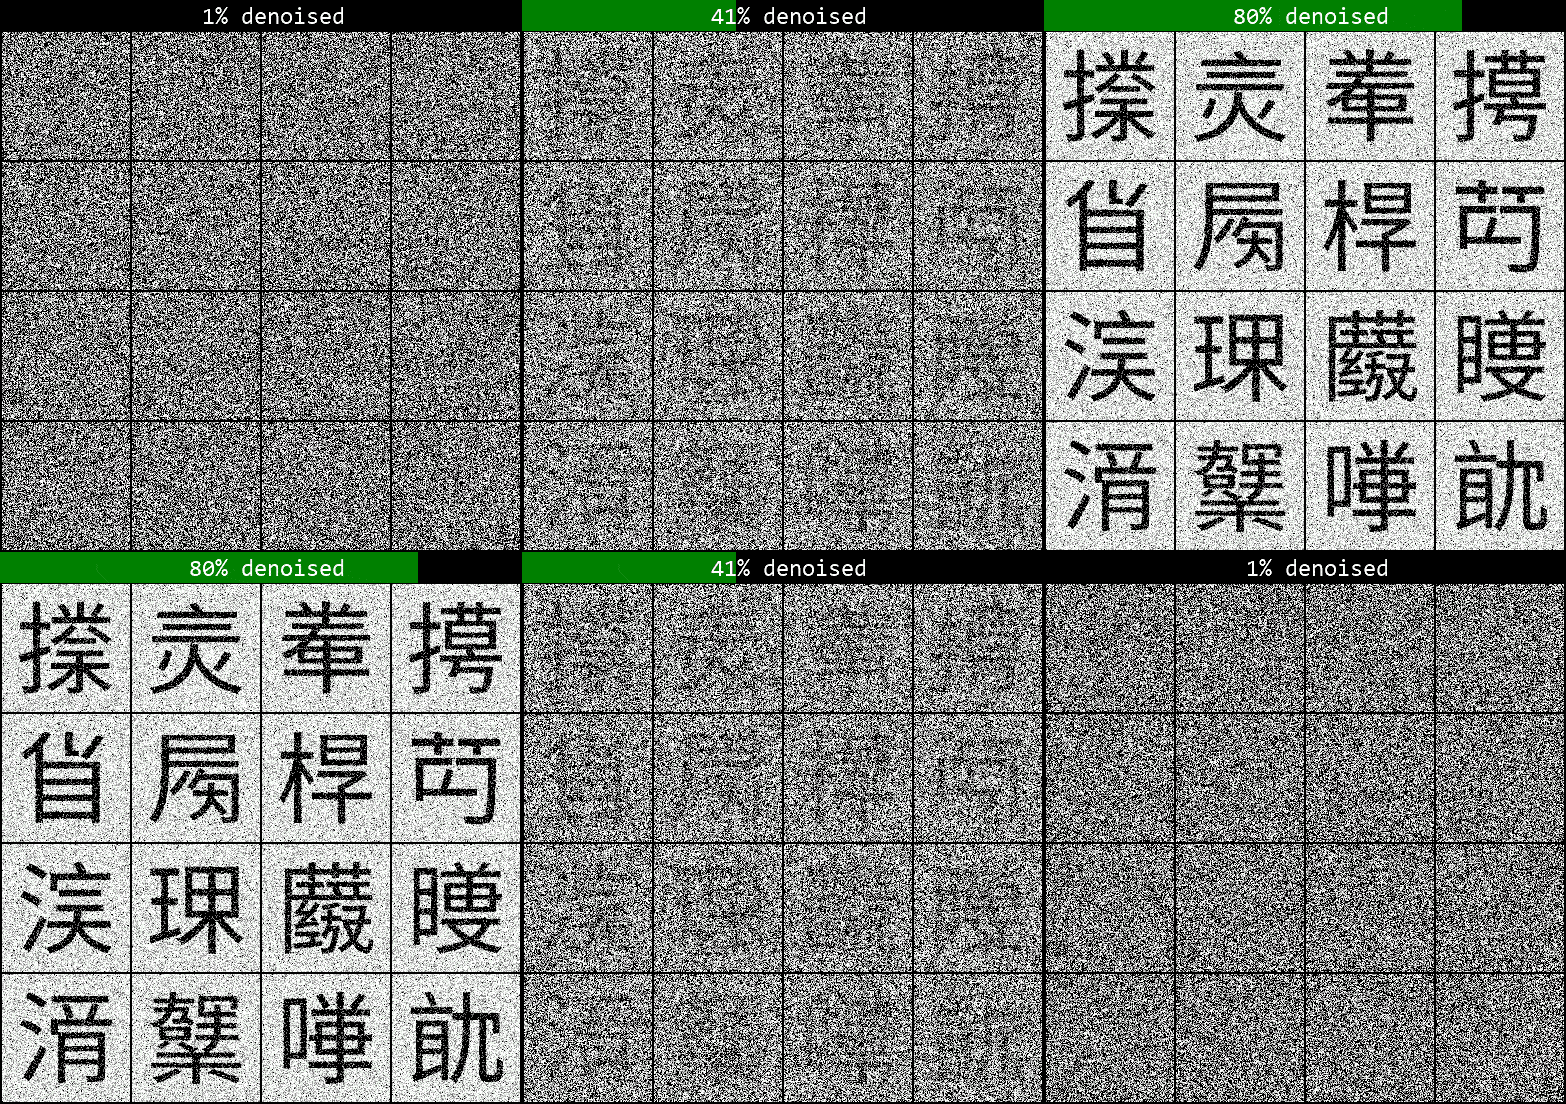
In this section we’ll only talk about the mechanics of how these models work but if you’re interested in how they arose from the broader context of generative models, have a look at the further reading section below.

What is “noise”?

Let’s first precisely define noise, since the term is thrown around a lot in the context of diffusion. In particular, we are talking about Gaussian noise: consider the samples we talked about in the section about probability distributions. You could think of each sample as an image of a single pixel of noise. An image that is “pure Gaussian noise”, then, is one in which each pixel value is sampled from an independent standard Gaussian distribution, 𝒩(0,1). For a pure noise image in the domain of our glyph dataset, this would be noise drawn from 16384 separate Gaussian distributions. You can see this in the previous animation. One thing to keep in mind is that we can choose the means of these noise distributions, i.e. center them, on specific values — the pixel values of an image, for instance.

For convenience, you’ll often find the noise distributions for image datasets written as a single multivariate distribution 𝒩(0,I) where I is the identity matrix, a covariance matrix with all diagonal entries equal to 1 and zeroes elsewhere. This is simply a compact notation for a set of multiple independent Gaussians — i.e. there are no correlations between the noise on different pixels. In the basic implementations of diffusion models, only uncorrelated (a.k.a. “isotropic”) noise is used. This article contains an excellent interactive introduction on multivariate Gaussians.

Diffusion process overview

Below is an adaptation of the somewhat-famous diagram from Ho et al.’s seminal paper “Denoising Diffusion Probabilistic Models” which gives an overview of the whole diffusion process:
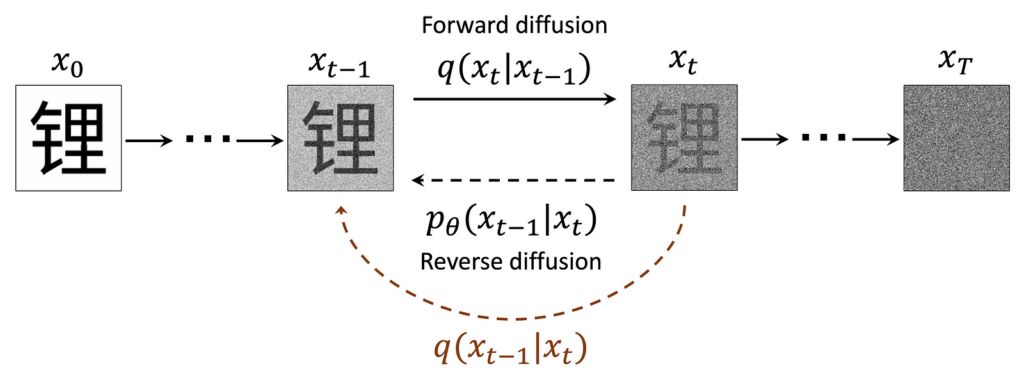
Diagram of the diffusion process adapted from Ho et al. 2020. The glyph 锂, meaning “lithium”, is used as a representative sample from the dataset.

I found that there was a lot to unpack in this diagram and simply understanding what each component meant was very helpful, so let’s go through it and define everything step by step.

We previously used x q(x) to refer to our data. Here, we’ve added a subscript, xₜ, to denote timestep t indicating how many steps of “noising” have taken place. We refer to the samples noised a given timestep as x q(xₜ). x₀​ is clean data and xₜ (t = T) ∼ 𝒩(0,1) is pure noise.

We define a forward diffusion process whereby we corrupt samples with noise. This process is described by the distribution q(xₜ|xₜ₋₁). If we could access the hypothetical reverse process q(xₜ₋₁|xₜ), we could generate samples from noise. As we cannot access it directly because we would need to know x₀​, we use ML to learn the parameters, θ, of a model of this process, 𝑝θ(𝑥ₜ₋₁∣𝑥ₜ). (That should be p subscript θ but medium cannot render it.)

In the following sections we go into detail on how the forward and reverse diffusion processes work.

Forward diffusion, or “noising”

Used as a verb, “noising” an image refers to applying a transformation that moves it towards pure noise by scaling down its pixel values toward 0 while adding proportional Gaussian noise. Mathematically, this transformation is a multivariate Gaussian distribution centered on the pixel values of the preceding image.

In the forward diffusion process, this noising distribution is written as q(xₜ|xₜ₋₁) where the vertical bar symbol “|” is read as “given” or “conditional on”, to indicate the pixel means are passed forward from q(xₜ₋₁) At t = T where T is a large number (commonly 1000) we aim to end up with images of pure noise (which, somewhat confusingly, is also a Gaussian distribution, as discussed previously).

The marginal distributions q(xₜ) represent the distributions that have accumulated the effects of all the previous noising steps (marginalization refers to integration over all possible conditions, which recovers the unconditioned distribution).

Since the conditional distributions are Gaussian, what about their variances? They are determined by a variance schedule that maps timesteps to variance values. Initially, an empirically determined schedule of linearly increasing values from 0.0001 to 0.02 over 1000 steps was presented in Ho et al. Later research by Nichol & Dhariwal suggested an improved cosine schedule. They state that a schedule is most effective when the rate of information destruction through noising is relatively even per step throughout the whole noising process.

Forward diffusion intuition

As we encounter Gaussian distributions both as pure noise q(xₜ, t = T) and as the noising distribution q(xₜ|xₜ₋₁), I’ll try to draw the distinction by giving a visual intuition of the distribution for a single noising step, q(x₁∣x₀), for some arbitrary, structured 2-dimensional data:
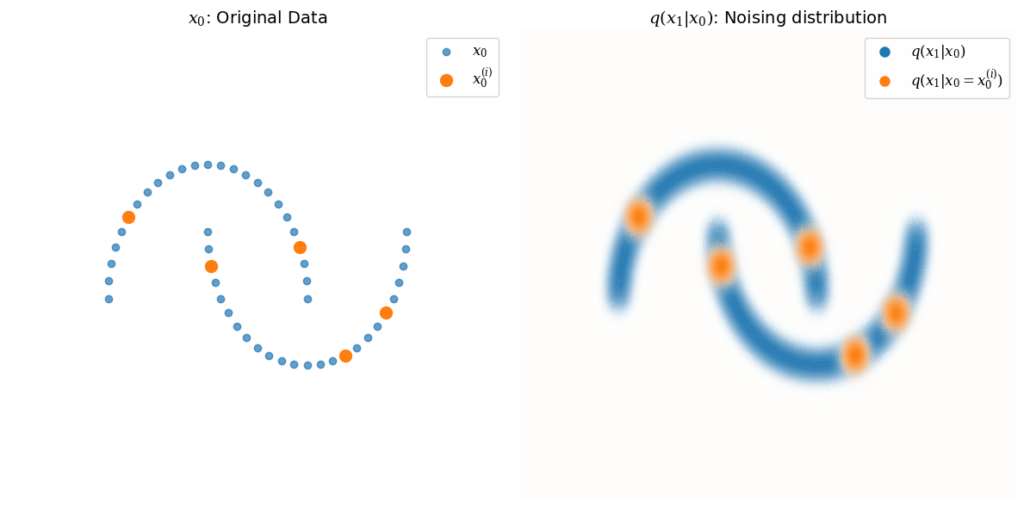
Each noising step q(xₜ|xₜ₋₁) is a Gaussian distribution conditioned on the previous step.

The distribution q(x₁∣x₀) is Gaussian, centered around each point in x₀, shown in blue. Several example points x₀⁽ⁱ⁾ are picked to illustrate this, with q(x₁∣x₀ = x₀⁽ⁱ⁾) shown in orange.

In practice, the main usage of these distributions is to generate specific instances of noised samples for training (discussed further below). We can calculate the parameters of the noising distributions at any timestep t directly from the variance schedule, as the chain of Gaussians is itself also Gaussian. This is very convenient, as we don’t need to perform noising sequentially—for any given starting data x₀⁽ⁱ⁾, we can calculate the noised sample xₜ⁽ⁱ⁾ by sampling from q(xₜ∣x₀ = x₀⁽ⁱ⁾) directly.

Forward diffusion visualization

Let’s now return to our glyph dataset (once again using the UMAP visualization as a visual shorthand). The top row of the figure below shows our dataset sampled from distributions noised to various timesteps: xₜ ∼ q(xₜ). As we increase the number of noising steps, you can see that the dataset begins to resemble pure Gaussian noise. The bottom row visualizes the underlying probability distribution q(xₜ).
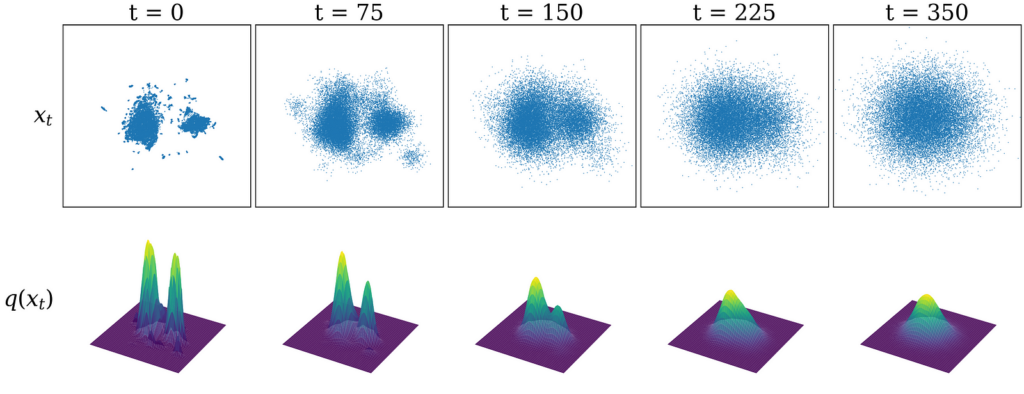
The dataset xₜ (above) sampled from its probability distribution q(xₜ) (below) at different noising timesteps.

Reverse diffusion overview

It follows that if we knew the reverse distributions q(xₜ₋₁∣xₜ), we could repeatedly subtract a small amount of noise, starting from a pure noise sample xₜ at t = T to arrive at a data sample x₀ ∼ q(x₀). In practice, however, we cannot access these distributions without knowing x₀ beforehand. Intuitively, it’s easy to make a known image much noisier, but given a very noisy image, it’s much harder to guess what the original image was.

So what are we to do? Since we have a large amount of data, we can train an ML model to accurately guess the original image that any given noisy image came from. Specifically, we learn the parameters θ of an ML model that approximates the reverse noising distributions, (xₜ₋₁ ∣ xₜ) for t = 0, …, T. In practice, this is embodied in a single noise prediction model trained over many different samples and timesteps. This allows it to denoise any given input, as shown in the figure below.

The ML model predicts added noise at any given timestep t.

Next, let’s go over how this noise prediction model is implemented and trained in practice.

How the model is implemented

First, we define the ML model — generally a deep neural network of some sort — that will act as our noise prediction model. This is what does the heavy lifting! In practice, any ML model that inputs and outputs data of the correct size can be used; the U-net, an architecture particularly suited to learning images, is what we use here and frequently chosen in practice. More recent models also use vision transformers.

We use the U-net architecture (Ronneberger et al. 2015) for our ML noise prediction model. We train the model by minimizing the difference between predicted and actual noise.

Then we run the training loop depicted in the figure above:

  • We take a random image from our dataset and noise it to a random timestep tt. (In practice, we speed things up by doing many examples in parallel!)
  • We feed the noised image into the ML model and train it to predict the (known to us) noise in the image. We also perform timestep conditioning by feeding the model a timestep embedding, a high-dimensional unique representation of the timestep, so that the model can distinguish between timesteps. This can be a vector the same size as our image directly added to the input (see here for a discussion of how this is implemented).
  • The model “learns” by minimizing the value of a loss function, some measure of the difference between the predicted and actual noise. The mean square error (the mean of the squares of the pixel-wise difference between the predicted and actual noise) is used in our case.
  • Repeat until the model is well trained.

Note: A neural network is essentially a function with a huge number of parameters (on the order of 10for the glyffuser). Neural network ML models are trained by iteratively updating their parameters using backpropagation to minimize a given loss function over many training data examples. This is an excellent introduction. These parameters effectively store the network’s “knowledge”.

A noise prediction model trained in this way eventually sees many different combinations of timesteps and data examples. The glyffuser, for example, was trained over 100 epochs (runs through the whole data set), so it saw around 2 million data samples. Through this process, the model implicity learns the reverse diffusion distributions over the entire dataset at all different timesteps. This allows the model to sample the underlying distribution q(x₀) by stepwise denoising starting from pure noise. Put another way, given an image noised to any given level, the model can predict how to reduce the noise based on its guess of what the original image. By doing this repeatedly, updating its guess of the original image each time, the model can transform any noise to a sample that lies in a high-probability region of the underlying data distribution.

Reverse diffusion in practice
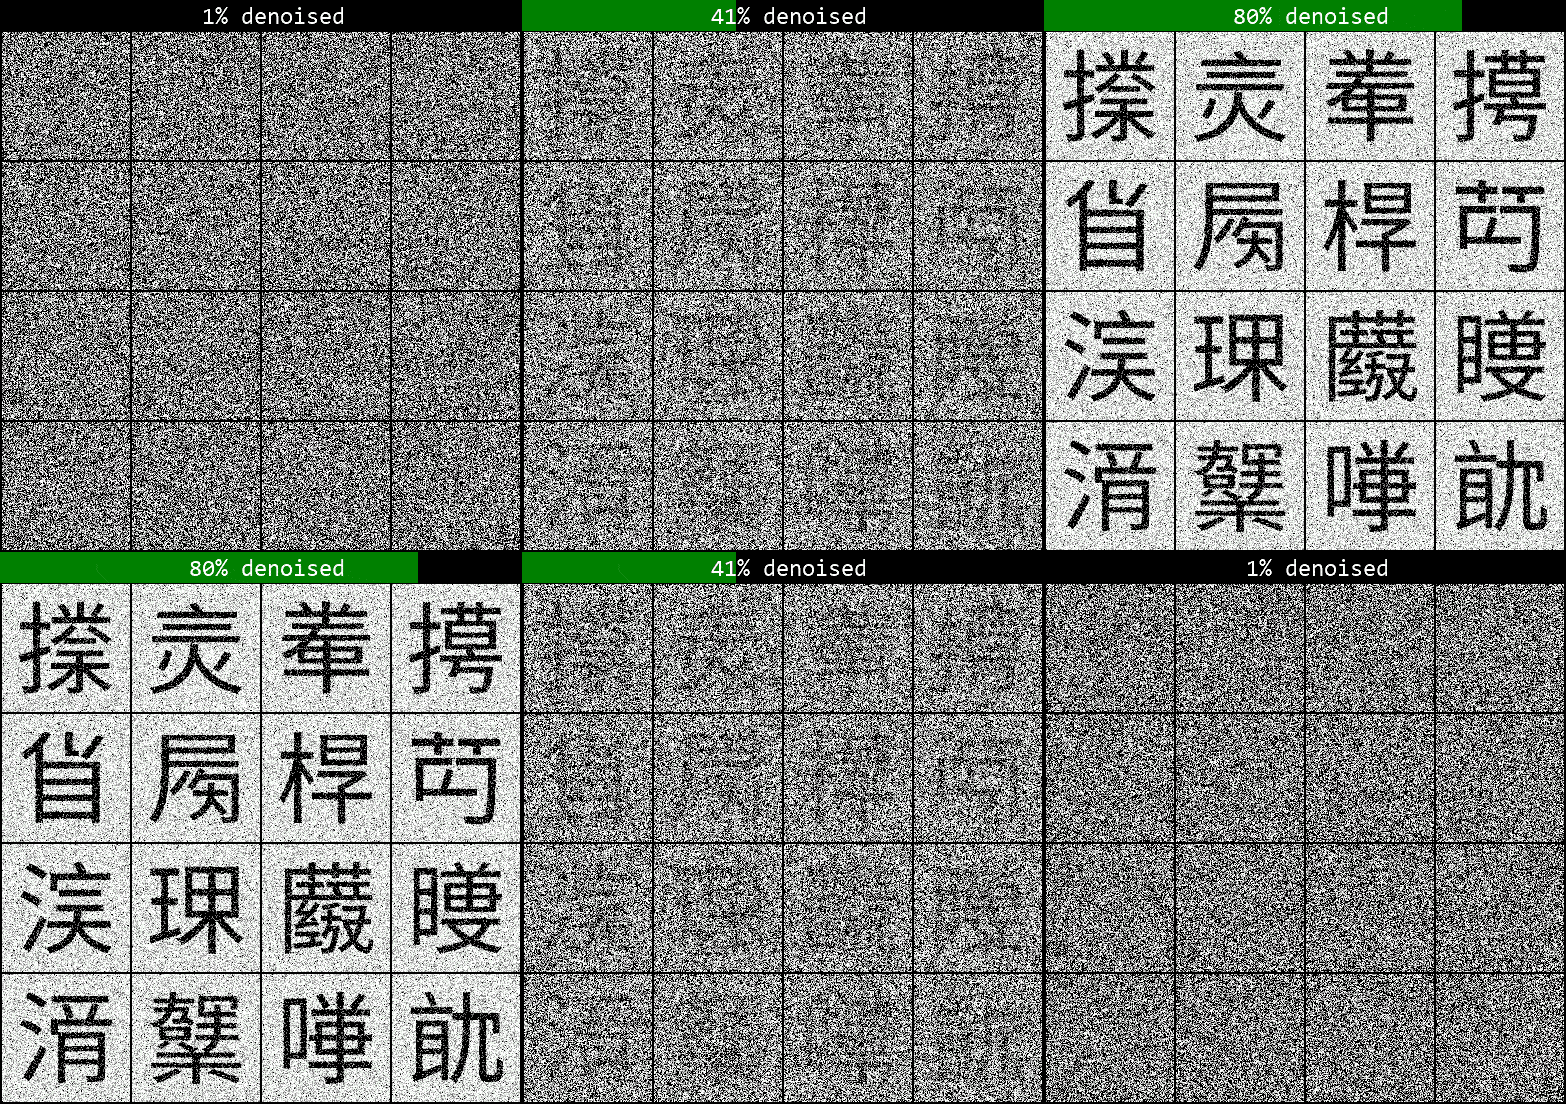
We can now revisit this video of the glyffuser denoising process. Recall a large number of steps from sample to noise e.g. T = 1000 is used during training to make the noise-to-sample trajectory very easy for the model to learn, as changes between steps will be small. Does that mean we need to run 1000 denoising steps every time we want to generate a sample?

Luckily, this is not the case. Essentially, we can run the single-step noise prediction but then rescale it to any given step, although it might not be very good if the gap is too large! This allows us to approximate the full sampling trajectory with fewer steps. The video above uses 120 steps, for instance (most implementations will allow the user to set the number of sampling steps).

Recall that predicting the noise at a given step is equivalent to predicting the original image x₀, and that we can access the equation for any noised image deterministically using only the variance schedule and x₀. Thus, we can calculate xₜ₋ₖ based on any denoising step. The closer the steps are, the better the approximation will be.

Too few steps, however, and the results become worse as the steps become too large for the model to effectively approximate the denoising trajectory. If we only use 5 sampling steps, for example, the sampled characters don’t look very convincing at all:
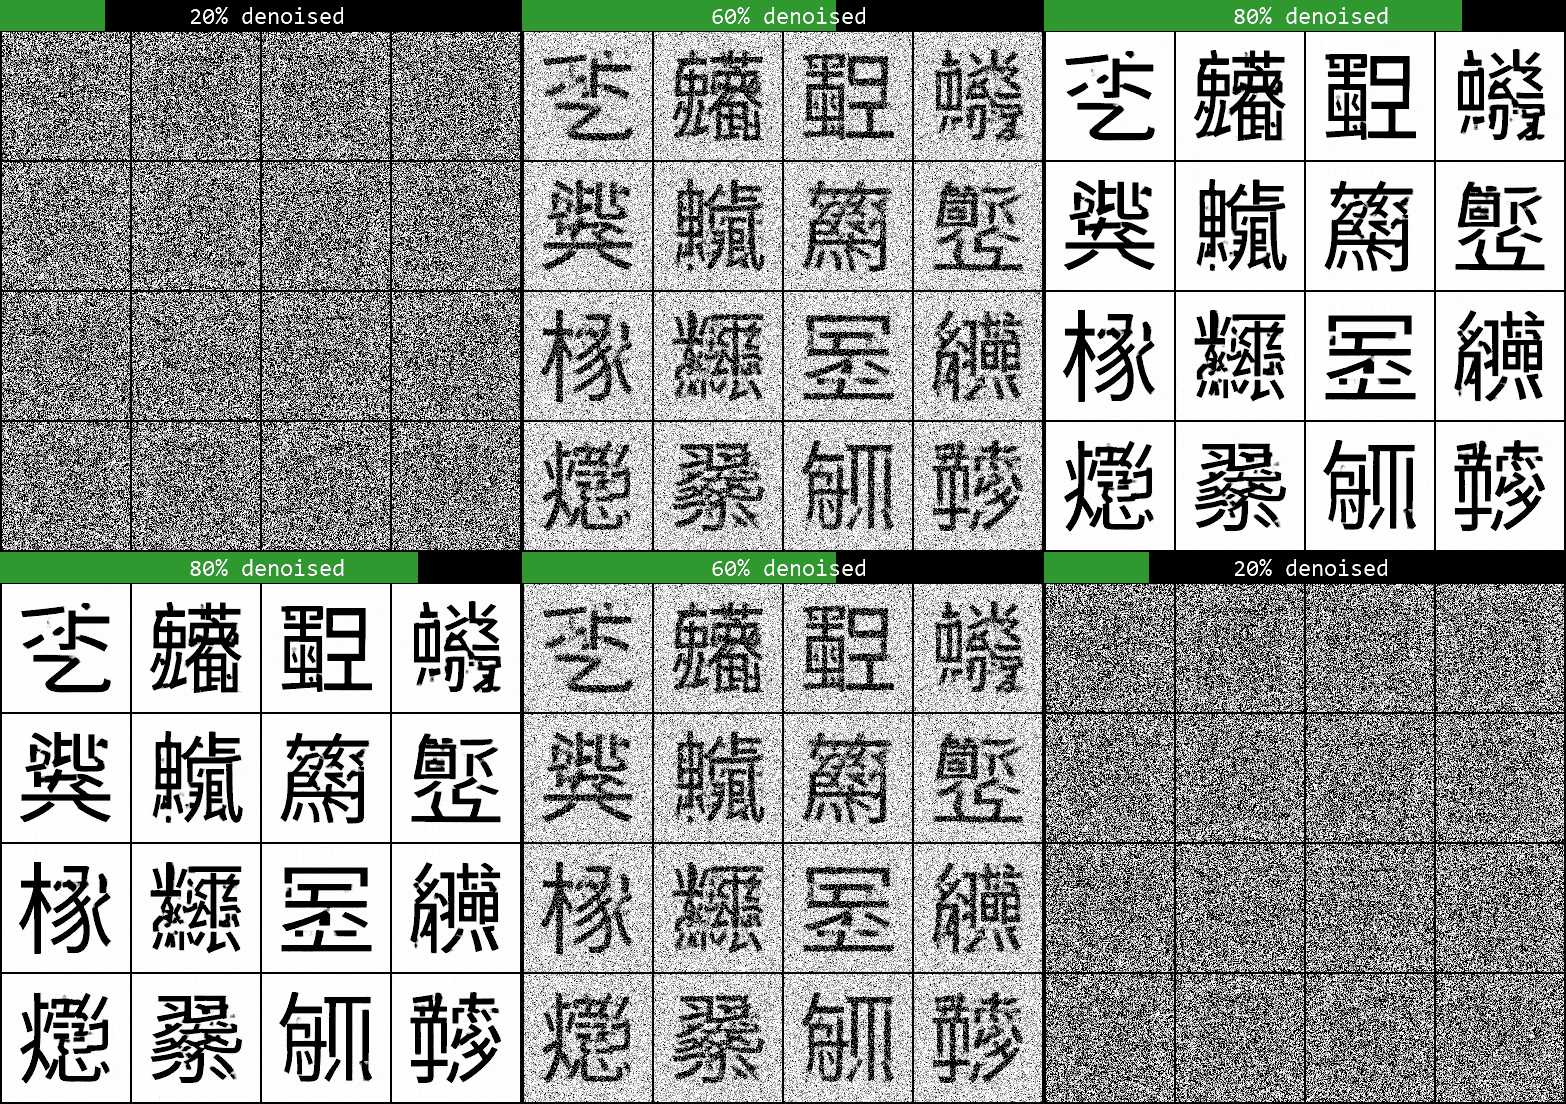
There is then a whole literature on more advanced sampling methods beyond what we’ve discussed so far, allowing effective sampling with much fewer steps. These often reframe the sampling as a differential equation to be solved deterministically, giving an eerie quality to the sampling videos — I’ve included one at the end if you’re interested. In production-level models, these are usually preferred over the simple method discussed here, but the basic principle of deducing the noise-to-sample trajectory is the same. A full discussion is beyond the scope of this article but see e.g. this paper and its corresponding implementation in the Hugging Face diffusers library for more information.

Alternative intuition from score function

To me, it was still not 100% clear why training the model on noise prediction generalises so well. I found that an alternative interpretation of diffusion models known as “score-based modeling” filled some of the gaps in intuition (for more information, refer to Yang Song’s definitive article on the topic.)
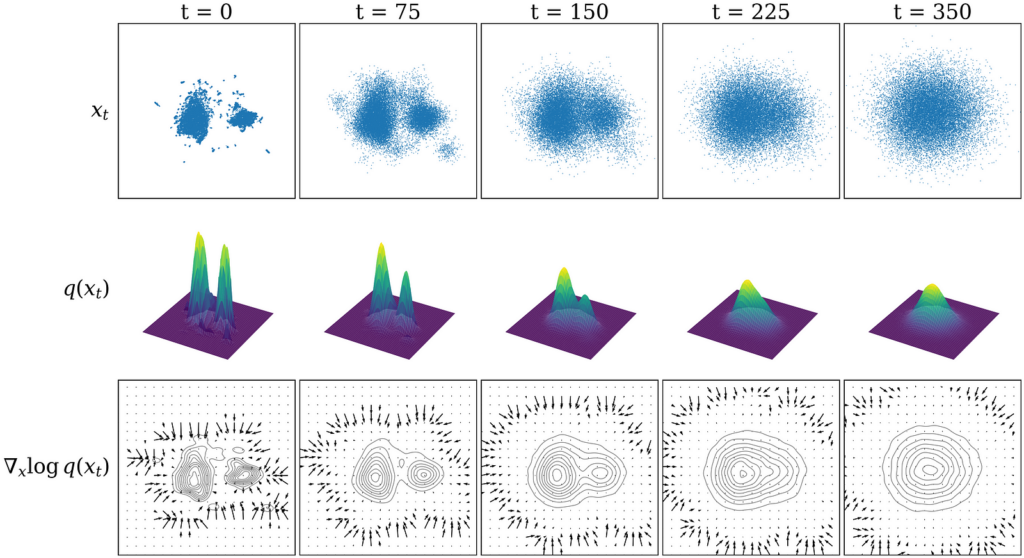
The dataset xₜ sampled from its probability distribution q(xₜ) at different noising timesteps; below, we add the score function ∇ₓ log q(xₜ).

I try to give a visual intuition in the bottom row of the figure above: essentially, learning the noise in our diffusion model is equivalent (to a constant factor) to learning the score function, which is the gradient of the log of the probability distribution: ∇ₓ log q(x). As a gradient, the score function represents a vector field with vectors pointing towards the regions of highest probability density. Subtracting the noise at each step is then equivalent to moving following the directions in this vector field towards regions of high probability density.

As long as there is some signal, the score function effectively guides sampling, but in regions of low probability it tends towards zero as there is little to no gradient to follow. Using many steps to cover different noise levels allows us to avoid this, as we smear out the gradient field at high noise levels, allowing sampling to converge even if we start from low probability density regions of the distribution. The figure shows that as the noise level is increased, more of the domain is covered by the score function vector field.

Summary

  • The aim of diffusion models is learn the underlying probability distribution of a dataset and then be able to sample from it. This requires forward and reverse diffusion (noising) processes.
  • The forward noising process takes samples from our dataset and gradually adds Gaussian noise (pushes them off the data manifold). This forward process is computationally efficient because any level of noise can be added in closed form a single step.
  • The reverse noising process is challenging because we need to predict how to remove the noise at each step without knowing the original data point in advance. We train a ML model to do this by giving it many examples of data noised at different timesteps.
  • Using very small steps in the forward noising process makes it easier for the model to learn to reverse these steps, as the changes are small.
  • By applying the reverse noising process iteratively, the model refines noisy samples step by step, eventually producing a realistic data point (one that lies on the data manifold).

Takeaway

Diffusion models are a powerful framework for learning complex data distributions. The distributions are learnt implicitly by modelling a sequential denoising process. This process can then be used to generate samples similar to those in the training distribution.

Once you’ve trained a model, how do you get useful stuff out of it?

Earlier uses of generative AI such as “This Person Does Not Exist” (ca. 2019) made waves simply because it was the first time most people had seen AI-generated photorealistic human faces. A generative adversarial network or “GAN” was used in that case, but the principle remains the same: the model implicitly learnt a underlying data distribution — in that case, human faces — then sampled from it. So far, our glyffuser model does a similar thing: it samples randomly from the distribution of Chinese glyphs.

The question then arises: can we do something more useful than just sample randomly? You’ve likely already encountered text-to-image models such as Dall-E. They are able to incorporate extra meaning from text prompts into the diffusion process — this in known as conditioning. Likewise, diffusion models for scientific scientific applications like protein (e.g. Chroma, RFdiffusion, AlphaFold3) or inorganic crystal structure generation (e.g. MatterGen) become much more useful if can be conditioned to generate samples with desirable properties such as a specific symmetry, bulk modulus, or band gap.

Conditional distributions

We can consider conditioning as a way to guide the diffusion sampling process towards particular regions of our probability distribution. We mentioned conditional distributions in the context of forward diffusion. Below we show how conditioning can be thought of as reshaping a base distribution.
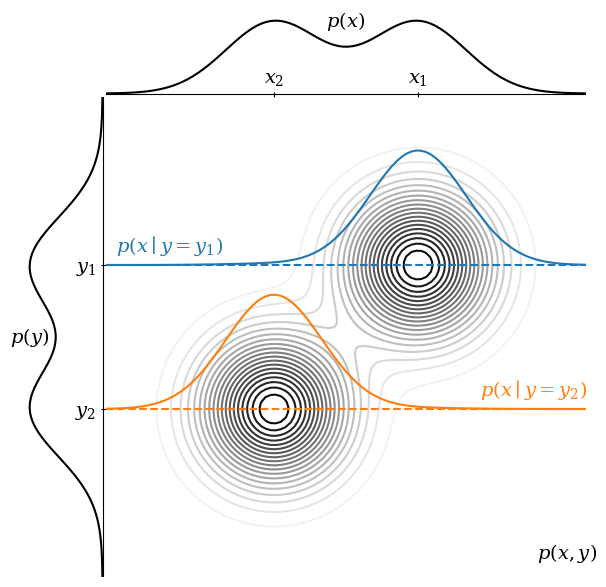
A simple example of a joint probability distribution p(x, y), shown as a contour map, along with its two marginal 1-D probability distributions, p(x) and p(y). The highest points of p(x, y) are at (x₁, y₁) and (x₂, y₂). The conditional distributions p(xy = y₁) and p(xy = y₂) are shown overlaid on the main plot.

Consider the figure above. Think of p(x) as a distribution we want to sample from (i.e., the images) and p(y) as conditioning information (i.e., the text dataset). These are the marginal distributions of a joint distribution p(x, y). Integrating p(x, y) over y recovers p(x), and vice versa.

Sampling from p(x), we are equally likely to get x₁ or x₂. However, we can condition on p(y = y₁) to obtain p(xy = y₁). You can think of this as taking a slice through p(x, y) at a given value of y. In this conditioned distribution, we are much more likely to sample at x₁ than x₂.

In practice, in order to condition on a text dataset, we need to convert the text into a numerical form. We can do this using large language model (LLM) embeddings that can be injected into the noise prediction model during training.

Embedding text with an LLM

In the glyffuser, our conditioning information is in the form of English text definitions. We have two requirements: 1) ML models prefer fixed-length vectors as input. 2) The numerical representation of our text must understand context — if we have the words “lithium” and “element” nearby, the meaning of “element” should be understood as “chemical element” rather than “heating element”. Both of these requirements can be met by using a pre-trained LLM.

The diagram below shows how an LLM converts text into fixed-length vectors. The text is first tokenized (LLMs break text into tokens, small chunks of characters, as their basic unit of interaction). Each token is converted into a base embedding, which is a fixed-length vector of the size of the LLM input. These vectors are then passed through the pre-trained LLM (here we use the encoder portion of Google’s T5 model), where they are imbued with additional contextual meaning. We end up with a array of n vectors of the same length d, i.e. a (n, d) sized tensor.
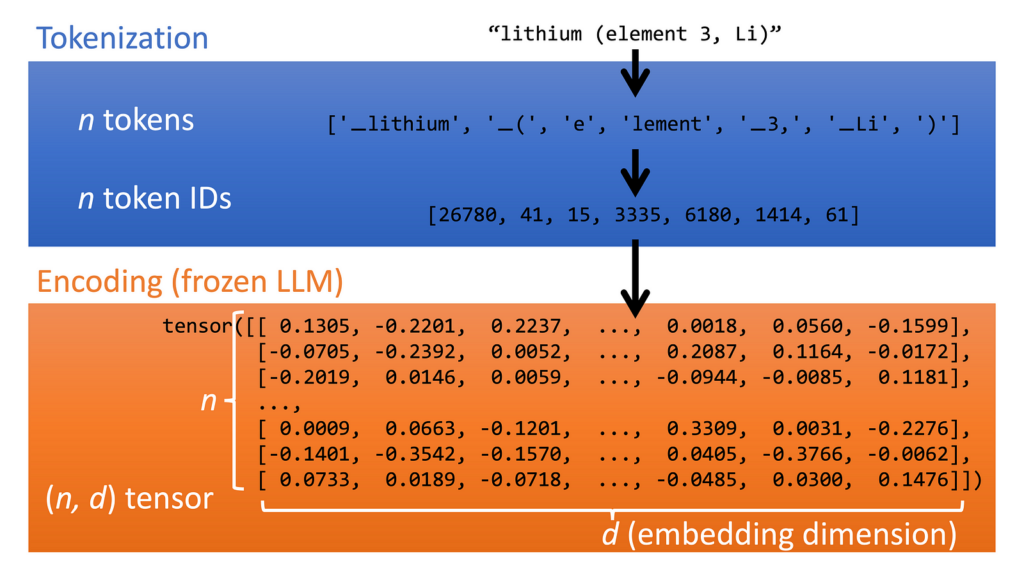
We can convert text to a numerical embedding imbued with contextual meaning using a pre-trained LLM.

Note: in some models, notably Dall-E, additional image-text alignment is performed using contrastive pretraining. Imagen seems to show that we can get away without doing this.

Training the diffusion model with text conditioning

The exact method that this embedding vector is injected into the model can vary. In Google’s Imagen model, for example, the embedding tensor is pooled (combined into a single vector in the embedding dimension) and added into the data as it passes through the noise prediction model; it is also included in a different way using cross-attention (a method of learning contextual information between sequences of tokens, most famously used in the transformer models that form the basis of LLMs like ChatGPT).
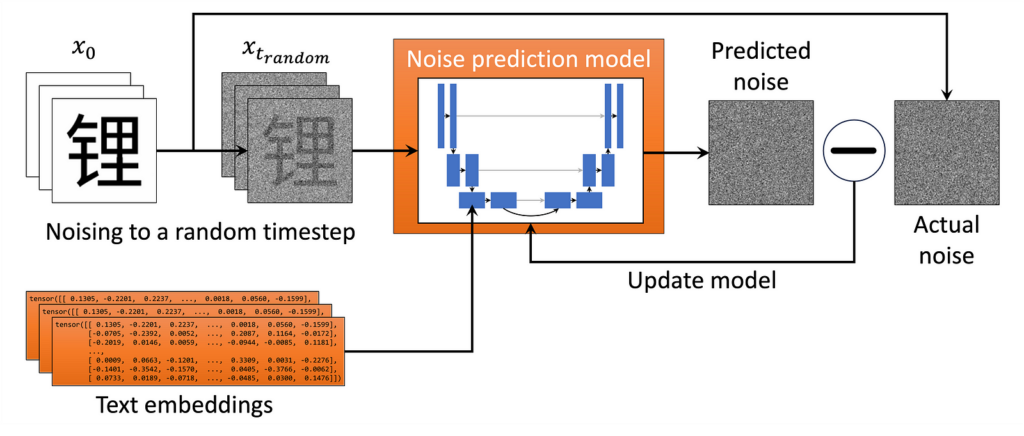
Conditioning information can be added via multiple different methods but the training loss remains the same.

In the glyffuser, we only use cross-attention to introduce this conditioning information. While a significant architectural change is required to introduce this additional information into the model, the loss function for our noise prediction model remains exactly the same.

Testing the conditioned diffusion model

Let’s do a simple test of the fully trained conditioned diffusion model. In the figure below, we try to denoise in a single step with the text prompt “Gold”. As touched upon in our interactive UMAP, Chinese characters often contain components known as radicals which can convey sound (phonetic radicals) or meaning (semantic radicals). A common semantic radical is derived from the character meaning “gold”, “金”, and is used in characters that are in some broad sense associated with gold or metals.

Even with a single sampling step, conditioning guides denoising towards the relevant regions of the probability distribution.

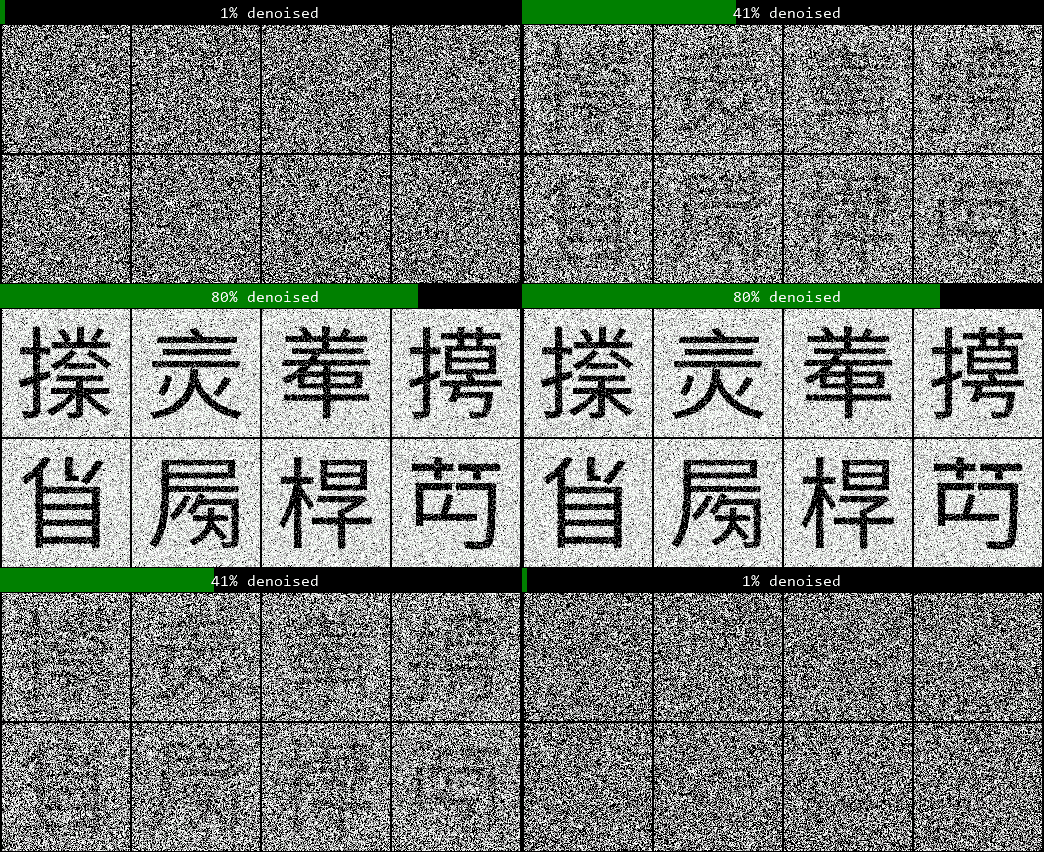
The figure shows that even though a single step is insufficient to approximate the denoising trajectory very well, we have moved into a region of our probability distribution with the “金” radical. This indicates that the text prompt is effectively guiding our sampling towards a region of the glyph probability distribution related to the meaning of the prompt. The animation below shows a 120 step denoising sequence for the same prompt, “Gold”. You can see that every generated glyph has either the 釒 or 钅 radical (the same radical in traditional and simplified Chinese, respectively).
Takeaway

Conditioning enables us to sample meaningful outputs from diffusion models.

Further remarks

I found that with the help of tutorials and existing libraries, it was possible to implement a working diffusion model despite not having a full understanding of what was going on under the hood. I think this is a good way to start learning and highly recommend Hugging Face’s tutorial on training a simple diffusion model using their diffusers Python library (which now includes my small bugfix!).

I’ve omitted some topics that are crucial to how production-grade diffusion models function, but are unnecessary for core understanding. One is the question of how to generate high resolution images. In our example, we did everything in pixel space, but this becomes very computationally expensive for large images. The general approach is to perform diffusion in a smaller space, then upscale it in a separate step. Methods include latent diffusion (used in Stable Diffusion) and cascaded super-resolution models (used in Imagen). Another topic is classifier-free guidance, a very elegant method for boosting the conditioning effect to give much better prompt adherence. I show the implementation in my previous post on the glyffuser and highly recommend this article if you want to learn more.

Further reading

A non-exhaustive list of materials I found very helpful:

Fun extras

Diffusion sampling using the DPMSolverSDEScheduler developed by Katherine Crowson and implemented in Hugging Face diffusers—note the smooth transition from noise to data.


Shape
Shape
Stay Ahead

Explore More Insights

Stay ahead with more perspectives on cutting-edge power, infrastructure, energy,  bitcoin and AI solutions. Explore these articles to uncover strategies and insights shaping the future of industries.

Shape

Fortinet targets branch offices with upgraded firewalls

Fortinet has refreshed its branch office firewalls, adding power and features to its next-generation FortiGate G-series devices. Three new boxes in the FortiGate G Series portfolio – the 70G, 50G, and 30G – include integrated firewall, intrusion prevention, malware and ransomware protection, SD-WAN, and switching capabilities, all of which can

Read More »

Digging into voice AI platform Deepgram

Deepgram is the leading voice AI platform used by over 200,000 developers to build speech-to-text, text-to-speech, and full speech-to-speech (which enables individuals with speech disabilities to be clearly understood) tools. It’s aimed at businesses and developers who need accurate and scalable transcriptions for applications like call centers, video captioning, voice

Read More »

BKV Names New CFO

BKV Corp. has named a new chief financial officer (CFO) as John T. Jimenez is set to retire on May 15. David Tameron will succeed Jimenez, BKV said in a media release. “John’s vision and stewardship have helped transform BKV into the strong public company that we are today, building

Read More »

Spy vs spy: Security agencies help secure the network edge

“By following the minimum levels of observability and digital forensics baselines outlined in this guidance, device manufacturers and their customers will be better equipped to detect and identify malicious activity against their solutions,” it said. “Device manufacturers should also use it to establish a baseline of standard features to include

Read More »

BP to Sell German Refining, Chemicals Assets on High Costs

BP Plc plans to sell oil refining and chemical assets in Germany, as the company scales back operations in the country due to high costs. The process, which involves the potential sale of a refinery in Gelsenkirchen and the DHC Solvent Chemie GmbH chemical plant in Mülheim an der Ruhr, will begin immediately with an aim of concluding the sales agreement this year, according to a company statement. The timing of the handover to a new owner will depend on regulatory approvals and operations will continue as usual during the sales process.  European refiners face increasing competition from fuel imports originating in the Middle East and Asia, where capacity is being increased. The continent’s fuel and chemical producing sites have been particularly hobbled by higher natural gas prices and carbon levies relative to other parts of the world, sparking a wave of closures and sales. Slumping fuel margins in the fourth quarter led to disappointing earnings results last week for the world’s oil supermajors as a flood of new output competes with stagnating demand. The Gelsenkirchen site has the capacity to process 240,000 barrels a day of crude, and is Germany’s third largest refinery.  BP isn’t the only oil major trying to sell out of refining assets in Germany. Shell Plc has been trying to sell its stake in the Schwedt plant, while Exxon Mobil Corp was in advanced talks with shareholders last year to pave the way for its sale of a stake in Germany’s second-largest refinery.  BP previously said it planned to scale back operations at Gelsenkirchen due to high costs at the site and those plans will continue, BP Spokesman David Nicholas said on Thursday. The sale comes as BP recently announced widespread job cuts with CEO Murray Auchincloss shedding projects that don’t make money or fit into his plans to turn the company

Read More »

Oil Dips as Trump’s Iran Plans, Vow to Lift Output Swing Market

Oil edged down as US President Donald Trump’s renewed pledge to drive down the price of crude overshadowed his push for tighter Iranian sanctions. West Texas Intermediate dipped 0.6% to settle below $71 a barrel, extending a three-day slump that brought futures near oversold territory on the relative strength index. Prices swung wildly during the session, first giving up gains after Trump reiterated a campaign promise to boost oil production, then rebounding as much as 1.2% after the US Treasury sanctioned an international network for facilitating the shipment of Iranian crude oil to China.  Prices then faded again on the prospect that tighter Iranian sanctions may have a more immediate and material effect on supplies as relaxed US enforcement allowed Iran to boost oil exports by about 1 million barrels a day in recent years. By contrast, skepticism abounds that Trump’s proposed overhaul of energy policy will spur US fossil fuel producers to boost output and abandon their focus on capital discipline and shareholder returns. “We remain strongly of the view that President Trump could ultimately prove to be a bearish influence on the oil market,” Citigroup analysts including Francesco Martoccia wrote in a note. “Specifically, Trump has consistently highlighted lower energy prices as the central solution to US inflation, interest rate, debt, and cost-of-living issues, and that this is a core issue for which he was elected.” Since Trump returned to office last month, crude futures have been subjected to several sharp intraday swings, buffeted by his tariff threats and other trade moves. Thursday’s fluctuations mirrored a volatile day in the equity and municipal bonds markets, with participants parsing mixed signals ahead of Friday’s jobs report.  Trump frequently moved crude prices by several dollars in his first term with social media posts and other pronouncements, a pattern that has begun to re-emerge over the last

Read More »

ADNOC’s TA’ZIZ lets EPC contract for methanol plant

Abu Dhabi Chemicals Derivatives Co. RSC Ltd. (TA’ZIZ)—a joint venture of Abu Dhabi National Oil Co. (ADNOC) and Abu Dhabi Developmental Holding Co. PJSC (ADQ)—has let a contract to Samsung E&A Co. Ltd. to build the UAE’s first methanol plant at the TA’ZIZ chemicals and transition fuels ecosystem (TCTFE) under development in the Ruwais industrial complex of Al Ruwais Industrial City, in Abu Dhabi’s Al Dhafra region (OGJ Online, Jan. 5, 2023). As part of a Jan. 31 contract, Samsung E&A will deliver engineering, procurement, and construction (EPC) services for the grassroots natural gas-to-methanol plant that will be equipped with a nameplate production capacity of 1.8 million tonnes/year (tpy), according to a series of separate early February releases from the service provider, TA’ZIZ, and ADNOC. Samsung E&A said its scope of work under the $1.7-billion, 44-month contract award will include integration of the service provider’s proprietary technologies involving modularization and automation. Chemicals production  To be powered by clean energy from the regional grid, the planned methanol project—slated to become one of the most energy efficient and low-emissions plant of its kind—is scheduled to begin production in 2028 to help meet growing domestic and international demand for methanol as a cleaner fuel and chemical building block in industrial applications such as adhesives, solvents, pharmaceuticals, and construction materials, ADNOC and its TA’ZIZ methanol project strategic partner Proman AG said in various releases dating back to 2022. Upon announcing the EPC contract, Mashal Saoud Al-Kindi—TA’ZIZ’s chief executive officer—said advancing the methanol project at the TCTFE marks a major step in realizing TA’ZIZ’s vision of driving the UAE’s industrial growth by creating a world-scale integrated chemicals ecosystem in Al Dhafra region. “The [methanol] plant will enhance the UAE’s position as a leader in sustainable chemicals production and strengthen TA’ZIZ’s role in enabling ADNOC’s global

Read More »

WoodMac: US oil tariffs on Canada, Mexico would impact North American crude flows

US oil tariffs enacted by the Trump administration on Canada and Mexico would lead to a ‘significant shift in crude flows in North America,’ as higher prices push a portion of US imports into overseas markets, Wood Mackenzie said in a recent report. The proposed US tariffs of 10% and 25% on Canadian and Mexican oil products, respectively, would alter crude flows for all three countries. Higher ensuing prices would ultimately affect demand in the US, although the impact is expected to be softer than a more disruptive 25% tariff on Canadian oil, according to the report. “A wide range of scenarios are still at play, as the implementation of tariffs has been delayed by a month,” said Dylan White, principal analyst, North American Crude Markets, Wood Mackenzie. “The uncertainty surrounding US policy is likely to continue; ongoing talks could lead to a lifting of tariffs or could spiral into steeper penalties on oil imports. As the tariffs currently stand, the North American market will see several impacts.” Tarriff impacts on Mexico In a scenario where a 25% tariff is imposed on Mexican oil, Wood Mackenzie forecasts that Mexican exports are likely to redirect from the US to alternative markets in Europe and Asia. This shift could affect about 600,000 b/d of oil imports from Mexico into the US. However, the potential impact might be alleviated by the closure of the Lyondell Houston refinery and the commissioning of Pemex’s Dos Bocas refinery, the report noted. “Backfill options for heavy barrels in the US crude slate, especially in the US West Coast and US Gulf Coast, would need to come from waterborne imports via Latin American and Middle East countries,” said White. “Iraq, in particular, flexes the largest alternate pool of heavy crude exports. However, these imports are generally cost disadvantaged compared

Read More »

FERC delay on ISO-NE interconnection plan could lock out 3 GW from capacity auction: Flatiron

The Federal Energy Regulatory Commission’s failure to act soon on ISO New England’s interconnection reform proposal may prevent up to 3 GW of resources from participating in the grid operator’s next capacity auction, according to Flatiron Energy Development. “Failure to act by the commission could result in sharply higher capacity rates and therefore less affordable electricity for the region, while increasing the risk of a resource shortfall,” Flatiron said in a Wednesday filing at FERC. Further delay by FERC “may exacerbate concerns about acute winter resource adequacy challenges,” the utility-scale storage developer said. In mid-May, ISO-NE filed proposals to reform its grid interconnection rules in response to FERC’s landmark Order 2023, which set new interconnection requirements — including shifting to a first-ready, first-served cluster study process instead of first-come, first-served reviews of interconnection requests. ISO-NE asked FERC to approve the proposals by Aug. 12, 2024. The proposals were widely supported by ISO-NE stakeholders and the region’s states. FERC, however, hasn’t acted on the proposals. The New England States Committee on Electricity, which represents the region’s governors, has urged FERC to make a decision on ISO-NE’s interconnection reform proposal. “Near-term action on the widely supported filing is necessary to help alleviate the interconnection queue backlogs and uncertainty that continues to exist in New England,” NESCOE said in a Nov. 25 letter to FERC. In response, former FERC Chairman Willie Phillips said Jan. 21 that the agency would act on the proposals “as expeditiously as possible.” FERC needs to make a decision by the end of March to allow new resources to participate in ISO-NE’s upcoming auction, which has been delayed to 2028, according to Flatiron. A decision is needed so project developers can meet deadlines that would be set under ISO-NE’s proposed transition to a new interconnection review process, the Boulder,

Read More »

Puerto Rico utility LUMA plans to add 1 GW renewables, 700 MW storage

Puerto Rico utility LUMA Energy on Thursday announced plans to add almost 1 GW of renewable energy and more than 700 MW of energy storage in its bid to transition away from fossil fuels and strengthen the island’s fragile electric grid. The new capacity represents more than $4 billion in private investment, creating over 4,200 construction jobs and 139 permanent jobs, according to the Renewable Energy Producers Association, or APER, the group’s Spanish acronym. LUMA’s agreement with Linxon US and its partner AtkinsRéalis Caribe calls for the development of nine “energy interconnection points” as part of Puerto Rico’s Tranche 1 energy transition efforts, the utility said. Puerto Rico is aiming to eliminate coal-fired generation by 2028 and develop a 100% renewable energy grid by 2050. The island’s electric system was destroyed by Hurricane Maria in 2017, resulting in a full rebuild and the development of a plan to modernize and decarbonize the power grid. The new renewable generation is “expected to potentially save customers millions of dollars by reducing reliance on fossil fuels and mitigating price volatility. It will also help decrease outages related to energy generation,” LUMA said. Puerto Rico’s electric grid experienced over 100 load shed events last year due to insufficient or sudden generation failures, the utility noted, citing data submitted to the Puerto Rico Energy Bureau. The new renewables and storage will make the island’s electric grid cleaner, more resilient and more affordable, LUMA President and CEO Juan Saca said in a statement. “We are stabilizing the electrical grid and ensuring a more resilient and sustainable system for generations to come,” he added. APER Executive Director Julián Herencia said the group expects the new resources will pass Puerto Rico’s interconnection process “without delays, finally ending the service interruptions caused by a lack of generation we have all endured

Read More »

Circling Back: What Now for Quantum Loophole and the Quantum Frederick Data Center Campus?

Quantum Loophole and TPG Real Estate Partners (TREP) have recently resolved a legal dispute concerning the management of the Quantum Frederick Project, a 2,100-acre data center campus in Frederick County, Maryland. As part of the settlement, Quantum Loophole has stepped back from active involvement in the project, with Catellus Development Corporation, a TPG affiliate, assuming full managerial responsibilities. The dispute began in September 2024 when TPG filed a lawsuit seeking to remove Quantum Loophole from its role as manager of the project, citing concerns over the company’s experience with large-scale infrastructure development and alleged misrepresentations. Quantum Loophole responded with its own lawsuit against TPG, alleging breach of contract and fiduciary duty.  In December 2024, both parties agreed to dismiss all litigation, reaching an amicable resolution. Quantum Loophole will no longer be actively involved in the Quantum Frederick Project but plans to pursue other data center developments across the United States. Background Quantum Loophole, founded in 2019 and based in Austin, Texas, had positioned itself as a pioneering force in the data center industry, with its Ecoscale model combining land, water, power, and fiber to build data center campuses. Specializing in the development of gigawatt-scale data center campuses, the company development model addresses the scalability, connectivity, and cost-efficiency challenges faced by today’s large-scale deployments. By offering master-planned data center communities, Quantum Loophole wants to enable hyperscalers, enterprises, and colocation providers to expedite their go-to-market capabilities. Off to a Promising Start In 2021, Quantum Loophole announced the acquisition of over 2,100 acres in Frederick County, Maryland, marking the inception of the Quantum Frederick project. Strategically located approximately 20 miles north of Northern Virginia’s internet ecosystem, this development aimed to revolutionize data center site selection by providing a holistic approach that considers community, environmental, and governmental factors. Central to this vision was the construction

Read More »

Vantage Data Centers Leaders Reflect On Ohio Campus Plans, North American Industry Surge

Recorded last December, for this episode of the Data Center Frontier Show Podcast, DCF Editor in Chief Matt Vincent spoke with Vantage Data Centers‘ North American President Dana Adams, and Kaitlin Monaghan, Vantage Data Centers’ North American Public Policy Director. As president of Vantage Data Centers’ North America business, Dana Adams oversees market development, sales, construction and operations across the United States and Canada. With nearly 18 years of experience in the data center sector, Adams has a track record of successfully leading high-growth companies and diverse teams at scale. Prior to joining Vantage, Adams was the Chief Operating Officer for AirTrunk, the hyperscale data center giant serving the Asia-Pacific region. She was responsible for scaling operations, service delivery and customer success from one to five countries and established other critical business capabilities, including award-winning people, culture and sustainability programs, as the company grew from $3 to $10 billion. Earlier in her career, Adams served as vice president and general manager at Iron Mountain where she helped drive nearly $2 billion in growth through global acquisitions and development projects. In addition, she held several leadership positions at Digital Realty, including vice president of portfolio management, where she oversaw $3 billion in data center assets. Considered to be one of the most influential female executives in the industry, Adams was recognized by Data Economy on its power women list in 2019. She was a finalist in the 2020 and 2022 PTC awards as an outstanding female executive, an Infrastructure Masons (IM) 2022 award recipient and was recently featured by InterGlobix Magazine as an Inspiring Woman in Leadership. Adams earned a bachelor’s degree from Boston College and a Master of Business Administration from Simmons University. Kaitlin Monaghan serves as the Director of Public Policy, North America, for Vantage Data Centers. In this role,

Read More »

How AI’s Transformative Impact on Data Centers Is Driving Unprecedented Industry Growth, Innovation, and Global Expansion

Newly released research and market analysis illuminates how, as artificial intelligence (AI) continues its rapid expansion across industries, the data center sector is engaged in a step-change evolution to meet its growing demands. JLL’s 2025 Global Data Center Outlook in many ways sets the stage for understanding how AI is reshaping the market, highlighting unprecedented demand, rising infrastructure challenges, and the need for innovative sustainability solutions. The latest findings from Dell’Oro Group reinforce the viability of these trends. Meanwhile, London-based global property consultancy Knight Frank’s recent forecast provides a comparative view of growth and obstacles in EMEA markets. The AI-Driven Surge in Data Center Demand JLL’s research predicts that an estimated 10 gigawatts (GW) of new data center capacity will break ground globally in 2025, with 7 GW expected to reach completion. This growth reflects a baseline compound annual growth rate (CAGR) of 15% through 2027, with a potential to reach 20%.  However, JLL notes that rapid expansion presents challenges, including supply-demand imbalances and electricity transmission constraints in key global markets. “The pace of AI innovation is not slowing down, and the data center industry must continue to adapt,” said Jonathan Kinsey, JLL’s EMEA Lead and Global Chair, Data Centre Solutions. “AI’s transformative power demands have already reshaped our world, yet its most significant and enduring effect may lie in how we rise to meet the substantial energy demands required to fuel this technological revolution.” JLL’s findings underscore the impact of AI on data center infrastructure, with next-generation workloads requiring higher power densities and advanced cooling solutions. The analysis notes that current rack densities range from 40 kW to 130 kW per rack, and future chips could push this figure to an astounding 250 kW per rack. The increasing heat generated by high-performance GPUs makes liquid cooling essential, with immersion

Read More »

Data Center Jobs: Electrician and Engineering Jobs Available in Major Markets

Each month Data Center Frontier, in partnership with Pkaza, posts some of the hottest data center career opportunities in the market. Here’s a look at some of the latest data center jobs posted on the Data Center Frontier jobs board, powered by Pkaza Critical Facilities Recruiting. VP of Engineering – Critical Facilities Ashburn, VA This position is preferred to be on the East Coast near Ashburn, VA, however, will consider any and all candidates that are managing at this level for hyperscale clients and preferably near a major city anywhere in the U.S.  Our client is a global MEP engineering design / build company that specializes in turnkey critical facilities implementation. They provide design, commissioning, consulting, integration and management expertise in the critical facilities space. They have a mindset to provide reliability, energy efficiency, sustainable design and LEED expertise when providing these consulting services for enterprise, colocation and hyperscale companies. This career-growth minded opportunity offers exciting projects with leading-edge technology and innovation as well as competitive salaries and benefits. Data Center Construction Project Manager – Colo Ashburn, VA This position is also available on the client side in Totowa, NJ, as a PM, APM and as a Project Engineer. This position is also available for a GC or as an owner’s rep in: New Albany, OH; Dallas, TX; Abilene, TX; Charlotte, NC; Chicago, Il; Montreal, QC; Ashburn, VA; Phoenix, AZ and Kansas City, MO.  This opportunity is working directly with a leading mission-critical data center developer / wholesaler / colo provider. This company provides turnkey data center solutions custom-fit to the requirements of their client’s ever-changing mission-critical facility’s operational needs. They accomplish this by providing reliability of mission-critical facilities for many of the world’s largest organizations (hyperscale and enterprise customers). This opportunity provides a career-growth minded role with exciting projects with leading-edge technology and innovation

Read More »

Linux containers in 2025 and beyond

The upcoming years will also bring about an increase in the use of standard container practices, such as the Open Container Initiative (OCI) standard, container registries, signing, testing, and GitOps workflows used for application development to build Linux systems. We’re also likely see a significant rise in the use of bootable containers, which are self-contained images that can boot directly into an operating system or application environment. Cloud platforms are often the primary platform for AI experimentation and container development because of their scalability and flexibility along the integration of both AI and ML services. They’re giving birth to many significant changes in the way we process data. With data centers worldwide, cloud platforms also ensure low-latency access and regional compliance for AI applications. As we move ahead, development teams will be able to collaborate more easily through shared development environments and efficient data storage.

Read More »

Let’s Go Build Some Data Centers: PowerHouse Drives Hyperscale and AI Infrastructure Across North America

PowerHouse Data Centers, a leading developer and builder of next-generation hyperscale data centers and a division of American Real Estate Partners (AREP), is making significant strides in expanding its footprint across North America, initiating several key projects and partnerships as 2025 begins.  The new developments underscore the company’s commitment to advancing digital infrastructure to meet the growing demands of hyperscale and AI-driven applications. Let’s take a closer look at some of PowerHouse Data Centers’ most recent announcements. Quantum Connect: Bridging the AI Infrastructure Gap in Ashburn On January 17, PowerHouse Data Centers announced a collaboration with Quantum Connect to develop Ashburn’s first fiber hub specifically designed for AI and high-density workloads. This facility is set to provide 20 MW of critical power, with initial availability slated for late 2026.  Strategically located in Northern Virginia’s Data Center Alley, Quantum Connect aims to offer scalable, high-density colocation solutions, featuring rack densities of up to 30kW to support modern workloads such as AI inference, edge caching, and regional compute integration. Quantum Connect said it currently has 1-3 MW private suites available for businesses seeking high-performance infrastructure that bridges the gap between retail colocation and hyperscale facilities. “Quantum Connect redefines what Ashburn’s data center market can deliver for businesses caught in the middle—those too large for retail colocation yet underserved by hyperscale environments,” said Matt Monaco, Senior Vice President at PowerHouse Data Centers. “We’re providing high-performance solutions for tenants with demanding needs but without hyperscale budgets.” Anchored by 130 miles of private conduit and 2,500 fiber pathways, Quantum Connect’s infrastructure offers tenants direct, short-hop connections to adjacent facilities and carrier networks.  With 14 campus entrances and secure, concrete-encased duct banks, the partners said the new facility minimizes downtime risks and reduces operational costs by eliminating the need for new optics or extended fiber runs.

Read More »

Microsoft will invest $80B in AI data centers in fiscal 2025

And Microsoft isn’t the only one that is ramping up its investments into AI-enabled data centers. Rival cloud service providers are all investing in either upgrading or opening new data centers to capture a larger chunk of business from developers and users of large language models (LLMs).  In a report published in October 2024, Bloomberg Intelligence estimated that demand for generative AI would push Microsoft, AWS, Google, Oracle, Meta, and Apple would between them devote $200 billion to capex in 2025, up from $110 billion in 2023. Microsoft is one of the biggest spenders, followed closely by Google and AWS, Bloomberg Intelligence said. Its estimate of Microsoft’s capital spending on AI, at $62.4 billion for calendar 2025, is lower than Smith’s claim that the company will invest $80 billion in the fiscal year to June 30, 2025. Both figures, though, are way higher than Microsoft’s 2020 capital expenditure of “just” $17.6 billion. The majority of the increased spending is tied to cloud services and the expansion of AI infrastructure needed to provide compute capacity for OpenAI workloads. Separately, last October Amazon CEO Andy Jassy said his company planned total capex spend of $75 billion in 2024 and even more in 2025, with much of it going to AWS, its cloud computing division.

Read More »

John Deere unveils more autonomous farm machines to address skill labor shortage

Join our daily and weekly newsletters for the latest updates and exclusive content on industry-leading AI coverage. Learn More Self-driving tractors might be the path to self-driving cars. John Deere has revealed a new line of autonomous machines and tech across agriculture, construction and commercial landscaping. The Moline, Illinois-based John Deere has been in business for 187 years, yet it’s been a regular as a non-tech company showing off technology at the big tech trade show in Las Vegas and is back at CES 2025 with more autonomous tractors and other vehicles. This is not something we usually cover, but John Deere has a lot of data that is interesting in the big picture of tech. The message from the company is that there aren’t enough skilled farm laborers to do the work that its customers need. It’s been a challenge for most of the last two decades, said Jahmy Hindman, CTO at John Deere, in a briefing. Much of the tech will come this fall and after that. He noted that the average farmer in the U.S. is over 58 and works 12 to 18 hours a day to grow food for us. And he said the American Farm Bureau Federation estimates there are roughly 2.4 million farm jobs that need to be filled annually; and the agricultural work force continues to shrink. (This is my hint to the anti-immigration crowd). John Deere’s autonomous 9RX Tractor. Farmers can oversee it using an app. While each of these industries experiences their own set of challenges, a commonality across all is skilled labor availability. In construction, about 80% percent of contractors struggle to find skilled labor. And in commercial landscaping, 86% of landscaping business owners can’t find labor to fill open positions, he said. “They have to figure out how to do

Read More »

2025 playbook for enterprise AI success, from agents to evals

Join our daily and weekly newsletters for the latest updates and exclusive content on industry-leading AI coverage. Learn More 2025 is poised to be a pivotal year for enterprise AI. The past year has seen rapid innovation, and this year will see the same. This has made it more critical than ever to revisit your AI strategy to stay competitive and create value for your customers. From scaling AI agents to optimizing costs, here are the five critical areas enterprises should prioritize for their AI strategy this year. 1. Agents: the next generation of automation AI agents are no longer theoretical. In 2025, they’re indispensable tools for enterprises looking to streamline operations and enhance customer interactions. Unlike traditional software, agents powered by large language models (LLMs) can make nuanced decisions, navigate complex multi-step tasks, and integrate seamlessly with tools and APIs. At the start of 2024, agents were not ready for prime time, making frustrating mistakes like hallucinating URLs. They started getting better as frontier large language models themselves improved. “Let me put it this way,” said Sam Witteveen, cofounder of Red Dragon, a company that develops agents for companies, and that recently reviewed the 48 agents it built last year. “Interestingly, the ones that we built at the start of the year, a lot of those worked way better at the end of the year just because the models got better.” Witteveen shared this in the video podcast we filmed to discuss these five big trends in detail. Models are getting better and hallucinating less, and they’re also being trained to do agentic tasks. Another feature that the model providers are researching is a way to use the LLM as a judge, and as models get cheaper (something we’ll cover below), companies can use three or more models to

Read More »

OpenAI’s red teaming innovations define new essentials for security leaders in the AI era

Join our daily and weekly newsletters for the latest updates and exclusive content on industry-leading AI coverage. Learn More OpenAI has taken a more aggressive approach to red teaming than its AI competitors, demonstrating its security teams’ advanced capabilities in two areas: multi-step reinforcement and external red teaming. OpenAI recently released two papers that set a new competitive standard for improving the quality, reliability and safety of AI models in these two techniques and more. The first paper, “OpenAI’s Approach to External Red Teaming for AI Models and Systems,” reports that specialized teams outside the company have proven effective in uncovering vulnerabilities that might otherwise have made it into a released model because in-house testing techniques may have missed them. In the second paper, “Diverse and Effective Red Teaming with Auto-Generated Rewards and Multi-Step Reinforcement Learning,” OpenAI introduces an automated framework that relies on iterative reinforcement learning to generate a broad spectrum of novel, wide-ranging attacks. Going all-in on red teaming pays practical, competitive dividends It’s encouraging to see competitive intensity in red teaming growing among AI companies. When Anthropic released its AI red team guidelines in June of last year, it joined AI providers including Google, Microsoft, Nvidia, OpenAI, and even the U.S.’s National Institute of Standards and Technology (NIST), which all had released red teaming frameworks. Investing heavily in red teaming yields tangible benefits for security leaders in any organization. OpenAI’s paper on external red teaming provides a detailed analysis of how the company strives to create specialized external teams that include cybersecurity and subject matter experts. The goal is to see if knowledgeable external teams can defeat models’ security perimeters and find gaps in their security, biases and controls that prompt-based testing couldn’t find. What makes OpenAI’s recent papers noteworthy is how well they define using human-in-the-middle

Read More »