Stay Ahead, Stay ONMINE

Learnings from a Machine Learning Engineer — Part 3: The Evaluation

In this third part of my series, I will explore the evaluation process which is a critical piece that will lead to a cleaner data set and elevate your model performance. We will see the difference between evaluation of a trained model (one not yet in production), and evaluation of a deployed model (one making real-world predictions). In Part 1, […]

In this third part of my series, I will explore the evaluation process which is a critical piece that will lead to a cleaner data set and elevate your model performance. We will see the difference between evaluation of a trained model (one not yet in production), and evaluation of a deployed model (one making real-world predictions).

In Part 1, I discussed the process of labelling your image data that you use in your Image Classification project. I showed how to define “good” images and create sub-classes. In Part 2, I went over various data sets, beyond the usual train-validation-test sets, such as benchmark sets, plus how to handle synthetic data and duplicate images.

Evaluation of the trained model

As machine learning engineers we look at accuracy, F1, log loss, and other metrics to decide if a model is ready to move to production. These are all important measures, but from my experience, these scores can be deceiving especially as the number of classes grows.

Although it can be time consuming, I find it very important to manually review the images that the model gets wrong, as well as the images that the model gives a low softmax “confidence” score to. This means adding a step immediately after your training run completes to calculate scores for all images — training, validation, test, and the benchmark sets. You only need to bring up for manual review the ones that the model had problems with. This should only be a small percentage of the total number of images. See the Double-check process below

What you do during the manual evaluation is to put yourself in a “training mindset” to ensure that the labelling standards are being followed that you setup in Part 1. Ask yourself:

  • “Is this a good image?” Is the subject front and center, and can you clearly see all the features?
  • “Is this the correct label?” Don’t be surprised if you find wrong labels.

You can either remove the bad images or fix the labels if they are wrong. Otherwise you can keep them in the data set and force the model to do better next time. Other questions I ask are:

  • “Why did the model get this wrong?”
  • “Why did this image get a low score?”
  • “What is it about the image that caused confusion?”

Sometimes the answer has nothing to do with that specific image. Frequently, it has to do with the other images, either in the ground truth class or in the predicted class. It is worth the effort to Double-check all images in both sets if you see a consistently bad guess. Again, don’t be surprised if you find poor images or wrong labels.

Weighted evaluation

When doing the evaluation of the trained model (above), we apply a lot of subjective analysis — “Why did the model get this wrong?” and “Is this a good image?” From these, you may only get a gut feeling.

Frequently, I will decide to hold off moving a model forward to production based on that gut feel. But how can you justify to your manager that you want to hit the brakes? This is where putting a more objective analysis comes in by creating a weighted average of the softmax “confidence” scores.

In order to apply a weighted evaluation, we need to identify sets of classes that deserve adjustments to the score. Here is where I create a list of “commonly confused” classes.

Commonly confused classes

Certain animals at our zoo can easily be mistaken. For example, African elephants and Asian elephants have different ear shapes. If your model gets these two mixed up, that is not as bad as guessing a giraffe! So perhaps you give partial credit here. You and your subject matter experts (SMEs) can come up with a list of these pairs and a weighted adjustment for each.

Photo by Matt Bango on Unsplash
Photo by Mathew Krizmanich on Unsplash

This weight can be factored into a modified cross-entropy loss function in the equation below. The back half of this equation will reduce the impact of being wrong for specific pairs of ground truth and prediction by using the “weight” function as a lookup. By default, the weighted adjustment would be 1 for all pairings, and the commonly confused classes would get something like 0.5.

In other words, it’s better to be unsure (have a lower confidence score) when you are wrong, compared to being super confident and wrong.

Modified cross-entropy loss function, image by author

Once this weighted log loss is calculated, I can compare to previous training runs to see if the new model is ready for production.

Confidence threshold report

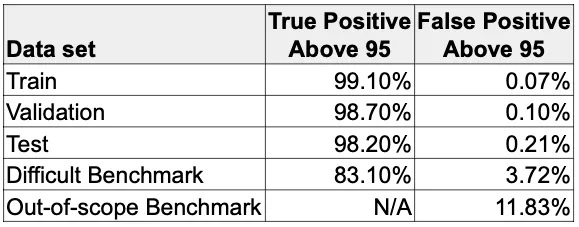
Another valuable measure that incorporates the confidence threshold (in my example, 95) is to report on accuracy and false positive rates. Recall that when we apply the confidence threshold before presenting results, we help reduce false positives from being shown to the end user.

In this table, we look at the breakdown of “true positive above 95” for each data set. We get a sense that when a “good” picture comes through (like the ones from our train-validation-test set) it is very likely to surpass the threshold, thus the user is “happy” with the outcome. Conversely, the “false positive above 95” is extremely low for good pictures, thus only a small number of our users will be “sad” about the results.
Example Confidence Threshold Report, image by author

We expect the train-validation-test set results to be exceptional since our data is curated. So, as long as people take “good” pictures, the model should do very well. But to get a sense of how it does on extreme situations, let’s take a look at our benchmarks.

The “difficult” benchmark has more modest true positive and false positive rates, which reflects the fact that the images are more challenging. These values are much easier to compare across training runs, so that lets me set a min/max target. So for example, if I target a minimum of 80% for true positive, and maximum of 5% for false positive on this benchmark, then I can feel confident moving this to production.

The “out-of-scope” benchmark has no true positive rate because none of the images belong to any class the model can identify. Remember, we picked things like a bag of popcorn, etc., that are not zoo animals, so there cannot be any true positives. But we do get a false positive rate, which means the model gave a confident score to that bag of popcorn as some animal. And if we set a target maximum of 10% for this benchmark, then we may not want to move it to production.

Photo by Linus Mimietz on Unsplash

Right now, you may be thinking, “Well, what animal did it pick for the bag of popcorn?” Excellent question! Now you understand the importance of doing a manual review of the images that get bad results.

Evaluation of the deployed model

The evaluation that I described above applies to a model immediately after training. Now, you want to evaluate how your model is doing in the real world. The process is similar, but requires you to shift to a “production mindset” and asking yourself, “Did the model get this correct?” and “Should it have gotten this correct?” and “Did we tell the user the right thing?”

So, imagine that you are logging in for the morning — after sipping on your cold brew coffee, of course — and are presented with 500 images that your zoo guests took yesterday of different animals. Your job is to determine how satisfied the guests were using your model to identify the zoo animals.

Using the softmax “confidence” score for each image, we have a threshold before presenting results. Above the threshold, we tell the guest what the model predicted. I’ll call this the “happy path”. And below the threshold is the “sad path” where we ask them to try again.

Your review interface will first show you all the “happy path” images one at a time. This is where you ask yourself, “Did we get this right?” Hopefully, yes!

But if not, this is where things get tricky. So now you have to ask, “Why not?” Here are some things that it could be:

  • “Bad” picture — Poor lighting, bad angle, zoomed out, etc — refer to your labelling standards.
  • Out-of-scope — It’s a zoo animal, but unfortunately one that isn’t found in this zoo. Maybe it belongs to another zoo (your guest likes to travel and try out your app). Consider adding these to your data set.
  • Out-of-scope — It’s not a zoo animal. It could be an animal in your zoo, but not one typically contained there, like a neighborhood sparrow or mallard duck. This might be a candidate to add.
  • Out-of-scope — It’s something found in the zoo. A zoo usually has interesting trees and shrubs, so people might try to identify those. Another candidate to add.
  • Prankster — Completely out-of-scope. Because people like to play with technology, there’s the possibility you have a prankster that took a picture of a bag of popcorn, or a soft drink cup, or even a selfie. These are hard to prevent, but hopefully get a low enough score (below the threshold) so the model did not identify it as a zoo animal. If you see enough pattern in these, consider creating a class with special handling on the front-end.

After reviewing the “happy path” images, you move on to the “sad path” images — the ones that got a low confidence score and the app gave a “sorry, try again” message. This time you ask yourself, “Should the model have given this image a higher score?” which would have put it in the “happy path”. If so, then you want to ensure these images are added to the training set so next time it will do better. But most of time, the low score reflects many of the “bad” or out-of-scope situations mentioned above.

Perhaps your model performance is suffering and it has nothing to do with your model. Maybe it is the ways you users interacting with the app. Keep an eye out of non-technical problems and share your observations with the rest of your team. For example:

  • Are your users using the application in the ways you expected?
  • Are they not following the instructions?
  • Do the instructions need to be stated more clearly?
  • Is there anything you can do to improve the experience?

Collect statistics and new images

Both of the manual evaluations above open a gold mine of data. So, be sure to collect these statistics and feed them into a dashboard — your manager and your future self will thank you!

Photo by Justin Morgan on Unsplash

Keep track of these stats and generate reports that you and your can reference:

  • How often the model is being called?
  • What times of the day, what days of the week is it used?
  • Are your system resources able to handle the peak load?
  • What classes are the most common?
  • After evaluation, what is the accuracy for each class?
  • What is the breakdown for confidence scores?
  • How many scores are above and below the confidence threshold?

The single best thing you get from a deployed model is the additional real-world images! You can add these now images to improve coverage of your existing zoo animals. But more importantly, they provide you insight on other classes to add. For example, let’s say people enjoy taking a picture of the large walrus statue at the gate. Some of these may make sense to incorporate into your data set to provide a better user experience.

Creating a new class, like the walrus statue, is not a huge effort, and it avoids the false positive responses. It would be more embarrassing to identify a walrus statue as an elephant! As for the prankster and the bag of popcorn, you can configure your front-end to quietly handle these. You might even get creative and have fun with it like, “Thank you for visiting the food court.”

Double-check process

It is a good idea to double-check your image set when you suspect there may be problems with your data. I’m not suggesting a top-to-bottom check, because that would a monumental effort! Rather specific classes that you suspect could contain bad data that is degrading your model performance.

Immediately after my training run completes, I have a script that will use this new model to generate predictions for my entire data set. When this is complete, it will take the list of incorrect identifications, as well as the low scoring predictions, and automatically feed that list into the Double-check interface.

This interface will show, one at a time, the image in question, alongside an example image of the ground truth and an example image of what the model predicted. I can visually compare the three, side-by-side. The first thing I do is ensure the original image is a “good” picture, following my labelling standards. Then I check if the ground-truth label is indeed correct, or if there is something that made the model think it was the predicted label.

At this point I can:

  • Remove the original image if the image quality is poor.
  • Relabel the image if it belongs in a different class.

During this manual evaluation, you might notice dozens of the same wrong prediction. Ask yourself why the model made this mistake when the images seem perfectly fine. The answer may be some incorrect labels on images in the ground truth, or even in the predicted class!

Don’t hesitate to add those classes and sub-classes back into the Double-check interface and step through them all. You may have 100–200 pictures to review, but there is a good chance that one or two of the images will stand out as being the culprit.

Up next…

With a different mindset for a trained model versus a deployed model, we can now evaluate performances to decide which models are ready for production, and how well a production model is going to serve the public. This relies on a solid Double-check process and a critical eye on your data. And beyond the “gut feel” of your model, we can rely on the benchmark scores to support us.

In Part 4, we kick off the training run, but there are some subtle techniques to get the most out of the process and even ways to leverage throw-away models to expand your library image data.

Shape
Shape
Stay Ahead

Explore More Insights

Stay ahead with more perspectives on cutting-edge power, infrastructure, energy,  bitcoin and AI solutions. Explore these articles to uncover strategies and insights shaping the future of industries.

Shape

MOL’s Tiszaújváros steam cracker processes first circular feedstock

MOL Group has completed its first certified production trial using circular feedstock at subsidiary MOL Petrochemicals Co. Ltd. complex in Tiszaújváros, Hungary, advancing the company’s strategic push toward circular economy integration in petrochemical production. Confirmed completed as of Sept. 15, the pilot marked MOL Group’s first use of post-consumer plastic

Read More »

Network jobs watch: Hiring, skills and certification trends

Desire for higher compensation Improve career prospects Want more interesting work “A robust and engaged tech workforce is essential to keeping enterprises operating at the highest level,” said Julia Kanouse, Chief Membership Officer at ISACA, in a statement. “In better understanding IT professionals’ motivations and pain points, including how these

Read More »

Slovakia and Hungary Resist Trump Bid to Halt Russian Energy

Slovakia and Hungary signaled they would resist pressure from US President Donald Trump to cut Russian oil and gas imports until the European Union member states find sufficient alternative supplies.  “Before we can fully commit, we need to have the right conditions in place — otherwise we risk seriously damaging our industry and economy,” Slovak Economy Minister Denisa Sakova told reporters in Bratislava on Wednesday.  The minister said sufficient infrastructure must first be in place to support alternative routes. The comments amount to a pushback against fresh pressure from Trump for all EU states to end Russian energy imports, a move that would hit Slovakia and Hungary.  Hungarian Cabinet Minister Gergely Gulyas reiterated that his country would rebuff EU initiatives that threatened the security of its energy supplies. Sakova said she made clear Slovakia’s position during talks with US Energy Secretary Chris Wright in Vienna this week. She said the Trump official expressed understanding, while acknowledging that the US must boost energy projects in Europe.  Trump said over the weekend that he’s prepared to move ahead with “major” sanctions on Russian oil if European nations do the same. The government in Bratislava is prepared to shut its Russian energy links if it has sufficient infrastructure to transport volumes, Sakova said.  “As long as we have an alternative route, and the transmission capacity is sufficient, Slovakia has no problem diversifying,” the minister said. A complete cutoff of Russian supplies would pose a risk, she said, because Slovakia is located at the very end of alternative supply routes coming from the West.  Slovakia and Hungary, landlocked nations bordering Ukraine, have historically depended on Russian oil and gas. After Russia’s full-scale invasion of Ukraine in 2022, both launched several diversification initiatives. Slovakia imports around third of its oil from non-Russian sources via the Adria pipeline

Read More »

Slovakia Resists Pressure to Quickly Halt Russian Energy

Slovakia and Hungary signaled they would resist pressure from US President Donald Trump to cut Russian oil and gas imports until the European Union member states find sufficient alternative supplies.  “Before we can fully commit, we need to have the right conditions in place — otherwise we risk seriously damaging our industry and economy,” Slovak Economy Minister Denisa Sakova told reporters in Bratislava on Wednesday.  The minister said sufficient infrastructure must first be in place to support alternative routes. The comments amount to a pushback against fresh pressure from Trump for all EU states to end Russian energy imports, a move that would hit Slovakia and Hungary.  Hungarian Cabinet Minister Gergely Gulyas reiterated that his country would rebuff EU initiatives that threatened the security of its energy supplies. Sakova said she made clear Slovakia’s position during talks with US Energy Secretary Chris Wright in Vienna this week. She said the Trump official expressed understanding, while acknowledging that the US must boost energy projects in Europe.  Trump said over the weekend that he’s prepared to move ahead with “major” sanctions on Russian oil if European nations do the same. The government in Bratislava is prepared to shut its Russian energy links if it has sufficient infrastructure to transport volumes, Sakova said.  “As long as we have an alternative route, and the transmission capacity is sufficient, Slovakia has no problem diversifying,” the minister said. A complete cutoff of Russian supplies would pose a risk, she said, because Slovakia is located at the very end of alternative supply routes coming from the West.  Slovakia and Hungary, landlocked nations bordering Ukraine, have historically depended on Russian oil and gas. After Russia’s full-scale invasion of Ukraine in 2022, both launched several diversification initiatives. Slovakia imports around third of its oil from non-Russian sources via the Adria pipeline

Read More »

Energy-related US CO2 emissions down 20% since 2005: EIA

Listen to the article 2 min This audio is auto-generated. Please let us know if you have feedback. Per capita carbon dioxide emissions from energy consumption fell in every state from 2005 to 2023, primarily due to less coal being burned, the U.S. Energy Information Administration said in a Monday report.  In total, CO2 emissions fell by 20% in those years. The U.S. population increased by 14% during that period, so per capita, emissions fell by 30%, according to EIA. “Increased electricity generation from natural gas, which releases about half as many CO2 emissions per unit of energy when combusted as coal, and from non-CO2-emitting wind and solar generation offset the decrease in coal generation,” EIA said. Emissions decreased in every state, falling the most in Maryland and the District of Columbia, which saw per capita drops of 49% and 48%, respectively. Emissions fell the least in Idaho, where they dropped by 3%, and Mississippi, where they dropped by 1%. Optional Caption Courtesy of Energy Information Administration “In 2023, Maryland had the lowest per capita CO2 emissions of any state, at 7.8 metric tons of CO2 (mtCO2), which is the second lowest in recorded data beginning in 1960,” EIA said. “The District of Columbia has lower per capita CO2 emissions than any state and tied its record low of 3.6 mtCO2 in 2023.” EIA forecasts a 1% increase in total U.S. emissions from energy consumption this year, “in part because of more recent increased fossil fuel consumption for crude oil production and electricity generation growth.” In 2023, the transportation sector was responsible for the largest share of emissions from energy consumption across 28 states, EIA said. In 2005, the electric power sector had “accounted for the largest share of emissions in 31 states, while the transportation sector made up the

Read More »

Chord Announces ‘Strategic Acquisition of Williston Basin Assets’

Chord Energy Corporation announced a “strategic acquisition of Williston Basin assets” in a statement posted on its website recently. In the statement, Chord said a wholly owned subsidiary of the company has entered into a definitive agreement to acquire assets in the Williston Basin from XTO Energy Inc. and affiliates for a total cash consideration of $550 million, subject to customary purchase price adjustments. The consideration is expected to be funded through a combination of cash on hand and borrowings, Chord noted in the statement, which highlighted that the effective date for the transaction is September 1, 2025, and that the deal is expected to close by year-end. Chord outlined in the statement that the deal includes 48,000 net acres in the Williston core, noting that “90 net 10,000 foot equivalent locations (72 net operated) extend Chord’s inventory life”. Pointing out “inventory quality” in the statement, Chord highlighted that “low average NYMEX WTI breakeven economics ($40s) compete at the front-end of Chord’s program and lower the weighted-average breakeven of Chord’s portfolio”. The company outlined that the deal is “expected to be accretive to all key metrics including cash flow, free cash flow and NAV in both near and long-term”. “We are excited to announce the acquisition of these high-quality assets,” Danny Brown, Chord Energy’s President and Chief Executive Officer, said in the statement. “The acquired assets are in one of the best areas of the Williston Basin and have significant overlap with Chord’s existing footprint, setting the stage for long-lateral development. The assets have a low average NYMEX WTI breakeven and are immediately competitive for capital,” he added. “We expect that the transaction will create significant accretion for shareholders across all key metrics, while maintaining pro forma leverage below the peer group and supporting sustainable FCF generation and return of capital,” he continued.

Read More »

AI can aid building energy retrofit decisions, but faces limitations: study

Listen to the article 4 min This audio is auto-generated. Please let us know if you have feedback. Generative AI models are able to produce effective retrofit decisions but do less well identifying which ones can produce the best result most quickly and at the least cost, according to analysis by researchers at Michigan State University. The study, “Can AI Make Energy Retrofit Decisions? An Evaluation of Large Language Models,” is one of the first to examine how large language models, or LLMs, perform in determining efficient and effective building energy retrofits.  Identifying the optimal retrofit solution can be critical from a cost standpoint. Light to medium retrofits can unlock between 10% and 40% in energy savings, or $0.49 to $1.94 per square foot of savings on average, according to JLL research published last September. Despite these savings, these actions aren’t being implemented at the scale required to meet decarbonization targets because of their capital-intensive nature, the report says. Decision-making complexity and the inadequacy of data and tools are also problem, according to the report. To determine the potential of generative AI in addressing these limitations, MSU researchers tasked seven LLMs with generating energy retrofit decisions under two contexts: a technical context focused on maximum CO2 reduction and a sociotechnical context focused on minimum packback period.  The AI-generated retrofit decisions were evaluated based on whether they matched the top-ranked retrofit measure or fell within the top three or the top five measures. The researchers then used a sample of 400 homes from ResStock 2024.2 data, spanning 49 states, to evaluate LLM performance based on accuracy, consistency, sensitivity and reasoning.   Researchers evaluated each LLM by issuing prompts, which included an overview of 16 potential retrofit packages and building-specific information. The overview described each retrofit measure’s features like heat pump efficiency, whether

Read More »

CPS Energy to Acquire Nearly 2 GW Gas Plants from ProEnergy

CPS Energy has signed an agreement to acquire four natural gas power plants operated by ProEnergy in the ERCOT area for $1.387 billion. The facilities have an aggregate capacity of 1.632 gigawatts, according to a joint statement. “Located in the Electric Reliability Council of Texas (ERCOT) market, the acquired assets include state-of-the-art, recently constructed peaking natural gas plants in Harris, Brazoria and Galveston Counties”, the companies said. “The acquired assets are dual-fuel capable, providing CPS Energy future optionality to transition to a hydrogen fuel blend that would enable reduced carbon emissions”. San Antonio, Texas-based CPS Energy has a prior agreement with Modern Hydrogen, announced July 22, to use the latter’s technology to convert natural gas into hydrogen. CPS Energy president and chief executive Rudy D. Garza said of the agreement with ProEnergy, “By acquiring recently constructed, currently operating modern power plants that utilize proven technology already in use by CPS Energy, we avoid higher construction costs, inflationary risk, and long timelines associated with building new facilities – while also enhancing the reliability and affordability of the CPS Energy generation portfolio”. “As we add resources to meet the needs of our fast-growing communities, we will continue to look to a diverse balance of energy sources that complement our portfolio, including natural gas, solar, wind and storage, keeping our community powered and growing”, Garza added. CPS Energy earlier issued a request for proposals (RFP) to secure up to 400 MW of wind generation capacity through one or more PPAs (power purchase agreements). “The RFP marks the first time in over a decade that CPS Energy has specifically sought proposals for wind projects. CPS Energy’s target to contract up to 400 MW of wind capacity would bring the utility’s total wind generation to 1,467 MW”, it said in a press release July 31. “The

Read More »

Power shortages are the only thing slowing the data center market

Another major shortage – which should not be news to anyone – is power. Lynch said that it is the primary reason many data centers are moving out of the heavily congested areas, like Northern Virginia and Santa Clara, and into secondary markets. Power is more available in smaller markets than larger ones. “If our client needs multi-megawatt capacity in Silicon Valley, we’re being told by the utility providers that that capacity will not be available for up to 10 years from now,” so out of necessity, many have moved to secondary markets, such as Hillsborough, Oregon, Reno, Nevada, and Columbus, Ohio. The growth of hyperscalers as well as AI is driving up the power requirements of facilities further into the multi-megawatt range. The power industry moves at a very different pace than the IT world, much slower and more deliberate. Lynch said the lead time for equipment makes it difficult to predict when some large scale, ambitious data centers can be completed. A multi-megawatt facility may even require new transmission lines to be built out as well. This translates into longer build times for new data centers. CBRE found that the average data center now takes about three years to complete, up from 2 years just a short time ago. Intel, AMD, and Nvidia haven’t even laid out a road map for three years, but with new architectures coming every year, a data center risks being obsolete by the time it’s completed. However, what’s the alternative? To wait? Customers will never catch up at that rate, Lynch said.   That is simply not a viable option, so development and construction must go on even with short supplies of everything from concrete and steel to servers and power transformers.

Read More »

Arista continues to defy expectations, build enterprise momentum

During her keynote, Ullal noted Arista is not only selling high-speed switches for AI data centers but also leveraging its own technology to create a new category of “AI centers” that simplify network management and operations, with a goal of 60% to 80% growth in the AI market. Arista has its sights set on enterprise expansion Arista hired Todd Nightingale as its new president a couple of month ago, and the reason should be obvious to industry watchers: to grow the enterprise business. Nightingale recently served as CEO of Fastly, but he is best known for his tenure as Cisco. He joined when Cisco acquired Meraki, where he was the CEO. Ullal indicated the campus and WAN business would grow from the current $750 million to $800 million run rate to $1.25 billion, which is a whopping 60% growth. Some of this will come from VeloCloud being added to Arista’s numbers, but not all of it. Arista’s opportunity in campus and WAN is in bringing its high performance, resilient networking to this audience. In a survey I conducted last year, 93% of respondents stated the network is more important to business operations than it was two years ago. During his presentation, Nightingale talked about this shift when he said: “There is no longer such a thing as a network that is not mission critical. We think of mission critical networks for military sites and tier one hospitals, but every hotel and retailer who has their Wi-Fi go down and can’t transact business will say the network is critical.” Also, with AI, inferencing traffic is expected to put a steady load on the network, and any kind of performance hiccup will have negative business ramifications. Historically, Arista’s value proposition for companies outside the Fortune 2000 was a bit of a solution

Read More »

Arista touts liquid cooling, optical tech to reduce power consumption for AI networking

Both technologies will likely find a role in future AI and optical networks, experts say, as both promise to reduce power consumption and support improved bandwidth density. Both have advantages and disadvantages as well – CPOs are more complex to deploy given the amount of technology included in a CPO package, whereas LPOs promise more simplicity.  Bechtolsheim said that LPO can provide an additional 20% power savings over other optical forms. Early tests show good receiver performance even under degraded conditions, though transmit paths remain sensitive to reflections and crosstalk at the connector level, Bechtolsheim added. At the recent Hot Interconnects conference, he said: “The path to energy-efficient optics is constrained by high-volume manufacturing,” stressing that advanced optics packaging remains difficult and risky without proven production scale.  “We are nonreligious about CPO, LPO, whatever it is. But we are religious about one thing, which is the ability to ship very high volumes in a very predictable fashion,” Bechtolsheim said at the investor event. “So, to put this in quantity numbers here, the industry expects to ship something like 50 million OSFP modules next calendar year. The current shipment rate of CPO is zero, okay? So going from zero to 50 million is just not possible. The supply chain doesn’t exist. So, even if the technology works and can be demonstrated in a lab, to get to the volume required to meet the needs of the industry is just an incredible effort.” “We’re all in on liquid cooling to reduce power, eliminating fan power, supporting the linear pluggable optics to reduce power and cost, increasing rack density, which reduces data center footprint and related costs, and most importantly, optimizing these fabrics for the AI data center use case,” Bechtolsheim added. “So what we call the ‘purpose-built AI data center fabric’ around Ethernet

Read More »

Network and cloud implications of agentic AI

The chain analogy is critical here. Realistic uses of AI agents will require core database access; what can possibly make an AI business case that isn’t tied to a company’s critical data? The four critical elements of these applications—the agent, the MCP server, the tools, and the data— are all dragged along with each other, and traffic on the network is the linkage in the chain. How much traffic is generated? Here, enterprises had another surprise. Enterprises told me that their initial view of their AI hosting was an “AI cluster” with a casual data link to their main data center network. With AI agents, they now see smaller AI servers actually installed within their primary data centers, and all the traffic AI creates, within the model and to and from it, now flows on the data center network. Vendors who told enterprises that AI networking would have a profound impact are proving correct. You can run a query or perform a task with an agent and have that task parse an entire database of thousands or millions of records. Someone not aware of what an agent application implies in terms of data usage can easily create as much traffic as a whole week’s normal access-and-update would create. Enough, they say, to impact network capacity and the QoE of other applications. And, enterprises remind us, if that traffic crosses in/out of the cloud, the cloud costs could skyrocket. About a third of the enterprises said that issues with AI agents generated enough traffic to create local congestion on the network or a blip in cloud costs large enough to trigger a financial review. MCP tool use by agents is also a major security and governance headache. Enterprises point out that MCP standards haven’t always required strong authentication, and they also

Read More »

There are 121 AI processor companies. How many will succeed?

The US currently leads in AI hardware and software, but China’s DeepSeek and Huawei continue to push advanced chips, India has announced an indigenous GPU program targeting production by 2029, and policy shifts in Washington are reshaping the playing field. In Q2, the rollback of export restrictions allowed US companies like Nvidia and AMD to strike multibillion-dollar deals in Saudi Arabia.  JPR categorizes vendors into five segments: IoT (ultra-low-power inference in microcontrollers or small SoCs); Edge (on-device or near-device inference in 1–100W range, used outside data centers); Automotive (distinct enough to break out from Edge); data center training; and data center inference. There is some overlap between segments as many vendors play in multiple segments. Of the five categories, inference has the most startups with 90. Peddie says the inference application list is “humongous,” with everything from wearable health monitors to smart vehicle sensor arrays, to personal items in the home, and every imaginable machine in every imaginable manufacturing and production line, plus robotic box movers and surgeons.  Inference also offers the most versatility. “Smart devices” in the past, like washing machines or coffee makers, could do basically one thing and couldn’t adapt to any changes. “Inference-based systems will be able to duck and weave, adjust in real time, and find alternative solutions, quickly,” said Peddie. Peddie said despite his apparent cynicism, this is an exciting time. “There are really novel ideas being tried like analog neuron processors, and in-memory processors,” he said.

Read More »

Data Center Jobs: Engineering, Construction, Commissioning, Sales, Field Service and Facility Tech Jobs Available in Major Data Center Hotspots

Each month Data Center Frontier, in partnership with Pkaza, posts some of the hottest data center career opportunities in the market. Here’s a look at some of the latest data center jobs posted on the Data Center Frontier jobs board, powered by Pkaza Critical Facilities Recruiting. Looking for Data Center Candidates? Check out Pkaza’s Active Candidate / Featured Candidate Hotlist (and coming soon free Data Center Intern listing). Data Center Critical Facility Manager Impact, TX There position is also available in: Cheyenne, WY; Ashburn, VA or Manassas, VA. This opportunity is working directly with a leading mission-critical data center developer / wholesaler / colo provider. This firm provides data center solutions custom-fit to the requirements of their client’s mission-critical operational facilities. They provide reliability of mission-critical facilities for many of the world’s largest organizations (enterprise and hyperscale customers). This career-growth minded opportunity offers exciting projects with leading-edge technology and innovation as well as competitive salaries and benefits. Electrical Commissioning Engineer New Albany, OH This traveling position is also available in: Richmond, VA; Ashburn, VA; Charlotte, NC; Atlanta, GA; Hampton, GA; Fayetteville, GA; Cedar Rapids, IA; Phoenix, AZ; Dallas, TX or Chicago, IL. *** ALSO looking for a LEAD EE and ME CxA Agents and CxA PMs. *** Our client is an engineering design and commissioning company that has a national footprint and specializes in MEP critical facilities design. They provide design, commissioning, consulting and management expertise in the critical facilities space. They have a mindset to provide reliability, energy efficiency, sustainable design and LEED expertise when providing these consulting services for enterprise, colocation and hyperscale companies. This career-growth minded opportunity offers exciting projects with leading-edge technology and innovation as well as competitive salaries and benefits.  Data Center Engineering Design ManagerAshburn, VA This opportunity is working directly with a leading mission-critical data center developer /

Read More »

Microsoft will invest $80B in AI data centers in fiscal 2025

And Microsoft isn’t the only one that is ramping up its investments into AI-enabled data centers. Rival cloud service providers are all investing in either upgrading or opening new data centers to capture a larger chunk of business from developers and users of large language models (LLMs).  In a report published in October 2024, Bloomberg Intelligence estimated that demand for generative AI would push Microsoft, AWS, Google, Oracle, Meta, and Apple would between them devote $200 billion to capex in 2025, up from $110 billion in 2023. Microsoft is one of the biggest spenders, followed closely by Google and AWS, Bloomberg Intelligence said. Its estimate of Microsoft’s capital spending on AI, at $62.4 billion for calendar 2025, is lower than Smith’s claim that the company will invest $80 billion in the fiscal year to June 30, 2025. Both figures, though, are way higher than Microsoft’s 2020 capital expenditure of “just” $17.6 billion. The majority of the increased spending is tied to cloud services and the expansion of AI infrastructure needed to provide compute capacity for OpenAI workloads. Separately, last October Amazon CEO Andy Jassy said his company planned total capex spend of $75 billion in 2024 and even more in 2025, with much of it going to AWS, its cloud computing division.

Read More »

John Deere unveils more autonomous farm machines to address skill labor shortage

Join our daily and weekly newsletters for the latest updates and exclusive content on industry-leading AI coverage. Learn More Self-driving tractors might be the path to self-driving cars. John Deere has revealed a new line of autonomous machines and tech across agriculture, construction and commercial landscaping. The Moline, Illinois-based John Deere has been in business for 187 years, yet it’s been a regular as a non-tech company showing off technology at the big tech trade show in Las Vegas and is back at CES 2025 with more autonomous tractors and other vehicles. This is not something we usually cover, but John Deere has a lot of data that is interesting in the big picture of tech. The message from the company is that there aren’t enough skilled farm laborers to do the work that its customers need. It’s been a challenge for most of the last two decades, said Jahmy Hindman, CTO at John Deere, in a briefing. Much of the tech will come this fall and after that. He noted that the average farmer in the U.S. is over 58 and works 12 to 18 hours a day to grow food for us. And he said the American Farm Bureau Federation estimates there are roughly 2.4 million farm jobs that need to be filled annually; and the agricultural work force continues to shrink. (This is my hint to the anti-immigration crowd). John Deere’s autonomous 9RX Tractor. Farmers can oversee it using an app. While each of these industries experiences their own set of challenges, a commonality across all is skilled labor availability. In construction, about 80% percent of contractors struggle to find skilled labor. And in commercial landscaping, 86% of landscaping business owners can’t find labor to fill open positions, he said. “They have to figure out how to do

Read More »

2025 playbook for enterprise AI success, from agents to evals

Join our daily and weekly newsletters for the latest updates and exclusive content on industry-leading AI coverage. Learn More 2025 is poised to be a pivotal year for enterprise AI. The past year has seen rapid innovation, and this year will see the same. This has made it more critical than ever to revisit your AI strategy to stay competitive and create value for your customers. From scaling AI agents to optimizing costs, here are the five critical areas enterprises should prioritize for their AI strategy this year. 1. Agents: the next generation of automation AI agents are no longer theoretical. In 2025, they’re indispensable tools for enterprises looking to streamline operations and enhance customer interactions. Unlike traditional software, agents powered by large language models (LLMs) can make nuanced decisions, navigate complex multi-step tasks, and integrate seamlessly with tools and APIs. At the start of 2024, agents were not ready for prime time, making frustrating mistakes like hallucinating URLs. They started getting better as frontier large language models themselves improved. “Let me put it this way,” said Sam Witteveen, cofounder of Red Dragon, a company that develops agents for companies, and that recently reviewed the 48 agents it built last year. “Interestingly, the ones that we built at the start of the year, a lot of those worked way better at the end of the year just because the models got better.” Witteveen shared this in the video podcast we filmed to discuss these five big trends in detail. Models are getting better and hallucinating less, and they’re also being trained to do agentic tasks. Another feature that the model providers are researching is a way to use the LLM as a judge, and as models get cheaper (something we’ll cover below), companies can use three or more models to

Read More »

OpenAI’s red teaming innovations define new essentials for security leaders in the AI era

Join our daily and weekly newsletters for the latest updates and exclusive content on industry-leading AI coverage. Learn More OpenAI has taken a more aggressive approach to red teaming than its AI competitors, demonstrating its security teams’ advanced capabilities in two areas: multi-step reinforcement and external red teaming. OpenAI recently released two papers that set a new competitive standard for improving the quality, reliability and safety of AI models in these two techniques and more. The first paper, “OpenAI’s Approach to External Red Teaming for AI Models and Systems,” reports that specialized teams outside the company have proven effective in uncovering vulnerabilities that might otherwise have made it into a released model because in-house testing techniques may have missed them. In the second paper, “Diverse and Effective Red Teaming with Auto-Generated Rewards and Multi-Step Reinforcement Learning,” OpenAI introduces an automated framework that relies on iterative reinforcement learning to generate a broad spectrum of novel, wide-ranging attacks. Going all-in on red teaming pays practical, competitive dividends It’s encouraging to see competitive intensity in red teaming growing among AI companies. When Anthropic released its AI red team guidelines in June of last year, it joined AI providers including Google, Microsoft, Nvidia, OpenAI, and even the U.S.’s National Institute of Standards and Technology (NIST), which all had released red teaming frameworks. Investing heavily in red teaming yields tangible benefits for security leaders in any organization. OpenAI’s paper on external red teaming provides a detailed analysis of how the company strives to create specialized external teams that include cybersecurity and subject matter experts. The goal is to see if knowledgeable external teams can defeat models’ security perimeters and find gaps in their security, biases and controls that prompt-based testing couldn’t find. What makes OpenAI’s recent papers noteworthy is how well they define using human-in-the-middle

Read More »