Stay Ahead, Stay ONMINE

Advanced Time Intelligence in DAX with Performance in Mind

We all know the usual Time Intelligence function based on years, quarters, months, and days. But sometimes, we need to perform more exotic timer intelligence calculations. But we should not forget to consider performance while programming the measures.  Introduction  There are many Dax functions in Power BI for Time Intelligence Measures.  The most common are:  You […]

We all know the usual Time Intelligence function based on years, quarters, months, and days. But sometimes, we need to perform more exotic timer intelligence calculations. But we should not forget to consider performance while programming the measures. 

Introduction 

There are many Dax functions in Power BI for Time Intelligence Measures. 

The most common are: 

You can find a comprehensive list of Time Intelligence functions here: Time Intelligence – DAX Guide. These functions cover the most common cases. 

However, some requirements cannot be easily covered with these functions. And here we are. 

I want to cover some of these cases I encountered in my projects, which include: 

  • Last n Periods and some variants 
  • How to cope with Leap years 
  • Week-to-Date calculations 
  • Calculating Weekly sums 
  • Fiscal Week YTD 

I will show you how to use an extended date table to support these scenarios and improve efficiency and performance. 

Most Time-Intelligence functions work regardless of whether the Fiscal Year is aligned with the calendar year. One exception is Year-to-Date (YTD). 

For such cases, look at the DATESYTD() function mentioned above. There, you will find the optional parameter to pass the last day of the Fiscal year. 

The last case will cover calculations based on weeks, while the Fiscal year doesn’t align with the calendar year. 

Scenario 

I will use the well-known ContosoRetailDW data model.

The Base Measure is Sum Online Sales, which has the following code: 

Sum Online Sales = SUMX('Online Sales',
 ( 'Online Sales'[UnitPrice]
            * 'Online Sales'[SalesQuantity] ) 
                         - 'Online Sales'[DiscountAmount] )

I will work almost exclusively in DAX-Studio, which provides the Server Timing function to analyze the performance of the DAX code. In the References section below, you can find a link to an article about how to collect and interpret performance data in DAX Studio. 

This is the base query used in my examples to get some data from the data model: 

EVALUATE 
 CALCULATETABLE( 
 SUMMARIZECOLUMNS('Date'[Year] 
 ,'Date'[Month Short Name] 
,'Date'[Week] 
,'Date'[Date] 
,"Online Sales", [Sum Online Sales] 
) 
 ,'Product'[ProductCategoryName] = "Computers" ,'Product'[ProductSubcategoryName] = "Laptops" 
,'Customer'[Continent] = "North America" 
 ,'Customer'[Country] = "United States"  ,'Customer'[State/Province] = "Texas" )

In most examples, I will remove some filters to get more complete data (for each day). 

Date table 

My date table includes a relatively large number of additional columns. 

In the references section below, you can find some articles written by SQLBI, on building weekly related calculations, including creating a date table to support these calculations. 

As described in my article about date tables referenced below, I have added the following columns: 

  • Index or Offset columns to count the days, weeks, months, quarters, semesters, and years from the current date. 
  • Flag columns to mark the current day, week, month, quarter, semester, and year based on the current date. 
  • This and the previous columns require a daily recalculation to ensure the correct date is used as the reference date. 
  • Start- and End-Dates of each week and month (Add more if needed). 
  • Start- and End-Dates for the Fiscal Year. 
  • Previous year dates to include the start and end dates of the current period. This is especially interesting for weeks, as the start- and end dates of the weeks are not the same from year to year. 

As you will see, I will use these columns extensively to simplify my calculations.

In addition, we will use the Calendar Hierarchy to calculate the needed results at different levels of the hierarchy. 

A complete Calendar hierarchy contains either: 

  1. Year 
  2. Semester 
  3. Quarter 
  4. Month 
  5. Day 

Or 

  1. Year 
  2. Week 
  3. Day 

If the Fiscal Year doesn’t align with the Calendar year, I built the Hierarchy with the Fiscal Year instead of the Calendar Year. 

Then, I added a separate FiscalMonthName column and a FiscalMonthSort column to ensure that the first month of the fiscal year was shown first. 

OK, let’s start with the first case. 

Last n periods 

This scenario calculates the rolling sum of values over the past n periods. 

For example, for each day, we want to get the Sales for the last 10 days: 

Figure 1 – Example for the sum over the last 10 days (Figure by the Author) 

Here is the Measure I came up with: 

Online Sales (Last 10 days) = 
 CALCULATE (
 [Sum Online Sales] 
 ,DATESINPERIOD ( 
 'Date'[Date], 
MAX ( 'Date'[Date] ), 
-10, 
DAY 
 ) 
 ) 

When executing the query filtering for Computers and North America, I get this result:

Figure 2 – Last 10 days – Result of Measure (Figure by the Author)

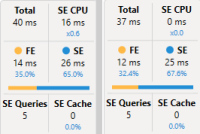
If I look at the server timings, the result is not bad: 

Figure 3 – Server timings for the last 10 days Measure (Figure by the Author) 

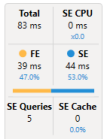
As you can see, the Storage engine performs more than half of the work, which is a good sign. It’s not perfect, but as the execution time is less than 100 ms, it’s still very good from the performance point of view. 

This approach has one crucial issue:

When calculating the rolling sum over multiple months, you must know that this approach is date oriented. 

This means that when you look at a specific time, it goes back to the same day of the given month. For example: 

We look at January 12. 2024, and we want to calculate the rolling sum over the last three months. The starting date for this calculation will be November 13. 2023. 

When do we want to get the rolling sum for the entire month? 

In the case above, I want to have as the starting date November 1, 2023. 

For this case, we can use the MonthIndex column. 

Each column has a unique index based on the current date. 

Therefore, we can use it to go back three months and get the entire month. 

This is the DAX Code for this: 

Online Sales rolling full 3 months = 
 VAR CurDate = 
 MAX ( 'Date'[Date] ) 
 VAR CurMonthIndex = 
 MAX ( 'Date'[MonthIndex] ) 
 VAR FirstDatePrevMonth = 
 CALCULATE ( 
 MIN ( 'Date'[Date] ), 
 REMOVEFILTERS ( 'Date' ), 
 'Date'[MonthIndex] = CurMonthIndex - 2 
 ) 
 RETURN 
 CALCULATE ( 
 [Sum Online Sales], 
 DATESBETWEEN ( 
 'Date'[Date], 
FirstDatePrevMonth, 
CurDate 
 ) 
 )

The execution is still quick, but it’s less efficient, as most of the calculations cannot be performed by the Storage engine:

Figure 4 – Server timings for the rolling sum of the last three full months (Figure by the Author) As you can see, it is not as fast as before. 

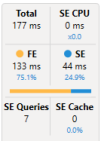
I tried other approaches (for example, 'Date'[MonthIndex] >= CurMonthIndex – 2 && 'Date'[MonthIndex] <= CurMonthIndex), but these approaches were worse than this one. 

Here is the result for the same logic, but for the last two months (To avoid showing too many rows):

Figure 5 – Results for the last two whole months (Figure by the Author) 

Regarding Leap Years 

The leap year problem is odd, which is evident when calculating the previous year for each day. Let me explain: 

When I execute the following Query to get the last days of February for the years 2020 and 2021: 

EVALUATE 
CALCULATETABLE ( 
 SUMMARIZECOLUMNS ( 
 'Date'[Year], 
 'Date'[Month Short Name], 
 'Date'[MonthKey],
 'Date'[Day Of Month], 
 "Online Sales", [Sum Online Sales], 
 "Online Sales (PY)", [Online Sales (PY)] 
 ), 
 'Date'[Year] IN {2020, 2021}, 
 'Date'[Month] = 2, 
 'Date'[Day Of Month] IN {27, 28, 29}, 
 'Customer'[Continent] = "North America", 
 'Customer'[Country] = "United States" 
) 
 ORDER BY 'Date'[MonthKey], 
 'Date'[Day Of Month]

I get the following result: 

Figure 6 – Problem of daily PY for the year after a leap year (Figure by the Author) 

As you can see above, the result for February 28. 2020 is shown twice, and one day is missing the February 2021 for Online Sales (PY). 

When looking at the month, the sum is correct: 

Figure 7 – Correct monthly sum with leap years (Figure by the Author) 

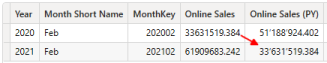
The problem is that there is no February 29 in 2021. Therefore, there is no way that the sales for February 29, 2020 will be displayed when listing the Sales Amount per day. 

While the result is correct, it will be wrong when the data is exported to Excel, and the values are summed. Then, the sum of the daily results will differ from those shown for the entire month. 

This can undermine the users’ perceived reliability of the data. 

My solution was to add a LeapYearDate table. This table is a copy of the Date table but without a Date column. I added one row each year on February 29, even for non-leap years. 

Then, I added a calculated column for each month and day (MonthDay): 

MonthDay = ('LeapYearDate'[Month] * 100 ) + 'LeapYearDate'[Day Of Month]

The Measure to calculate the previous year manually and using the new table is the following:

Online Sales (PY Leap Year) = 
 VAR ActYear = 
 SELECTEDVALUE ( 'LeapYearDate'[Year] ) 
 VAR ActDays = 
 VALUES ( 'LeapYearDate'[MonthDay] ) 
 RETURN 
 CALCULATE ( 
 [Sum Online Sales], 
 REMOVEFILTERS ( LeapYearDate ), 
 'LeapYearDate'[Year] = ActYear - 1, 
 ActDays 
 )

As you can see, I got the current year, and by using the VALUES() function, I got the list of all dates in the current filter context. 

Using this method, my Measure works for single Days, Months, Quarters, and Years. The result of this Measure is the following: 

Figure 8 – Result for the custom PY Measure, which always displays leap days (Figure by the Author)

As you can see here, the Measure is very efficient, as most of the work is done by the Storage engine:

Figure 9 – Server Timings for the custom PY Measure for Leap years (Figure by the Author) 

But, to be honest, I don’t like this approach, even though it works very well. 

The reason is that the LeapYearDate table does not have a date column. Therefore, it cannot be used as a Date table for the existing Time Intelligence functions. 

We must also use the calendar columns from this table in the visualizations. We cannot use the ordinary date table. 

Consequently, we must reinvent all Time Intelligence functions to use this table.

I strongly recommend using this approach only when necessary. 

Week to Date and PY 

Some Business areas concentrate on Weekly analysis. 

Unfortunately, the standard Time Intelligence functions do not support weekly analysis out of the box. Therefore, we must build our Weekly Measures by ourselves. 

The first Measure is WTD. 

The first approach is the following: 

Online Sales WTD v1 = 
 VAR MaxDate = MAX('Date'[Date]) 
  
 VAR CurWeekday = WEEKDAY(MaxDate, 2) 
  
 RETURN 
 CALCULATE([Sum Online Sales] 
 ,DATESBETWEEN('Date'[Date] 
 ,MaxDate - CurWeekDay + 1  ,MaxDate) 
 )

As you can see, I use the WEEKDAY() function to calculate the start date of the week. Then, I use the DATESBETWEEN() function to calculate the WTD. 

When you adapt this pattern to your situation, you must ensure that the second parameter in WEEKDAY() is set to the correct value. Please read the documentation to learn more about it. 

The result is the following:

Figure 10 – Result for WTD in DAX Studio (Figure by the Author) 

Another approach is to store the first date of each week in the Date table and use this information in the Measure: 

Online Sales WTD PY v2 = 
 VAR DayOfWeek = MAX('Date'[Day Of Week]) 
  
 VAR FirstDayOfWeek = MIN('Date'[FirstDayOfWeekDatePY])   
 RETURN 
 CALCULATE([Sum Online Sales] 
 ,DATESBETWEEN('Date'[Date] 
 ,FirstDayOfWeek 
,FirstDayOfWeek + DayOfWeek - 1) 
 )

The result is precisely the same. 

When analyzing the performance in DAX Studio, I see that both Measures are comparable to each other:

Figure 11 – On the left, you can see the execution statistics for the first version, and on the right, you see them for the second  version. As you can see, both are very comparable (Figure by the Author)


I tend to use the second one, as it has better potential when combined with other Measures. But in the end, it depends on the current scenario. 

Another challenge is to calculate the previous year. 

Look at the following dates for the same week in different weeks: 

Figure 12 – Comparing the dates of the same week in different years. (Figure by the Author) 

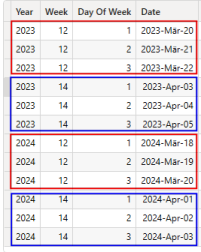
As you can see, the dates are shifted. And as the standard time intelligence functions are based on shifting dates, they will not work. 

I tried different approaches, but in the end, I stored the first date of the same week for the previous year in the date table and used it like in the second version of WTD shown above: 

Online Sales WTD PY = 
 VAR DayOfWeek = MAX('Date'[Day Of Week]) 
  
 VAR FirstDayOfWeek = MIN('Date'[FirstDayOfWeekDatePY])   
 RETURN 
 CALCULATE([Sum Online Sales] 
 ,DATESBETWEEN('Date'[Date]
 ,FirstDayOfWeek 
,FirstDayOfWeek + DayOfWeek - 1) 
 )

This is the result: 

Figure 13 – Result for WTD PY Measure (Figure by the Author) 

As the logic is the same as in the WTD v2, the performance is also the same. Therefore, this Measure is very efficient. 

Weekly Sums for PY 

Sometimes, the weekly view is enough, and we don’t need to calculate the WTD at the Daily level. 

We don’t need a WTD Measure for this scenario for the current year. The base Measure sliced by Week can cover this. The result is correct out of the box. 

But, again, it’s another story for PY.

This is the first version I came up with: 

Online Sales (PY Weekly) v1] = 
 VAR ActYear = MAX('Date'[Year]) 
  
 RETURN 
 CALCULATE([Sum Online Sales] 
 ,ALLEXCEPT('Date' 
 ,'Date'[Week] 
) 
 ,'Date'[Year] = ActYear - 1 
 )

Here, I subtract one from the current year while retaining the filter for the current week. This is the result:

Figure 14 – The result for WTD PY for the whole week. See that the WTD result for the last day of each week corresponds to the PY value (Figure by the Author) 

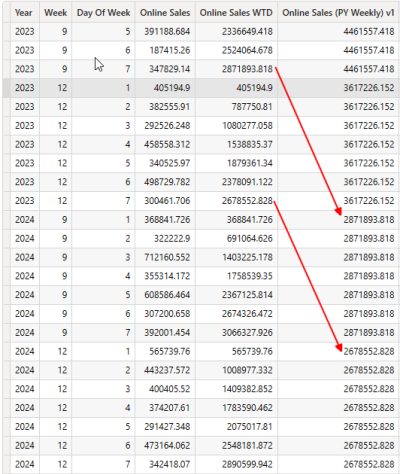
The performance is good, but I can do better. 

What if I could store a unique Week Identifier in the Date column? 

For example, the Current Week is 9 of 2025.. 

The Identifier would be 202509. 

When I detract 100 from it, I get 202409, the identifier for the same week in the previous year. After adding this column to the date table, I can change the Measure to this: 

MEASURE 'All Measures'[Online Sales (PY Weekly) v2] = 
VAR WeeksPY = VALUES('Date'[WeekKeyPY]) 
RETURN 
CALCULATE([Sum Online Sales]
,REMOVEFILTERS('Date') 
,'Date'[WeekKey] IN WeeksPY 
)

This version is much simpler than before, and the result is still the same. 

When we compare the execution statistics of the two versions, we see this: 

Figure 15 – Comparing the execution statistics of the two versions for WTD PY for the whole week. On the left is V1, and on the right is V2. (Figure by the Author) 

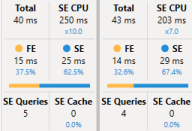
As you can see, the second version, with the precalculated column in the Date table, is slightly more efficient. I have only four SE queries, a good sign for increased efficiency. 

Fiscal Weeks YTD 

This last one is tricky. 

The requirement is that the user wants to see a YTD starting from the first day of the first week of the Fiscal year. 

For example, the Fiscal year starts on July 1. 

In 2022, the week containing July the 1st starts on Monday, June 27. 

This means that the YTD calculation must start on this date. 

The same applies to the YTD PY calculation starting Monday, June 28, 2021. 

This approach has some consequences when visualizing the data. 

Again, knowing if the result must be shown at the day or week level is essential. When showing the data at the day level, the result can be confusing when selecting a Fiscal Year:

Figure 16 – Result of the weekly based YTD for the Fiscal year 22/23 (Figure by the Author) 

As you can see, Friday is the first day of the Fiscal year. And the YTD result doesn’t start on July 1st but on Monday of that week. 

The consequence is that the YTD doesn’t seem to start correctly. The users must know what they are looking at. 

The same is valid for the YTD PY results. 

To facilitate the calculations, I added more columns to the Date table: 

  • FiscalYearWeekYear—This field contains the numerical representation of the Fiscal year (for 23/24, I get 2324), starting with the first week of the Fiscal year. 
  • FiscalYearWeekYearPY – The same as before, but for the previous year (FiscalYearWeekYear – 101). 
  • FiscalWeekSort—This sorting column starts the week with the first day of the fiscal year. A more elaborate way to use this column could be to follow the ISO-Week definition, which I didn’t do to keep it more uncomplicated. 
  • FiscalYearWeekSort – The same as before but with the FiscalYearWeekYear in front (e. g. 232402). 
  • FirstDayOfWeekDate – The date of the Monday of the week in which the current date is in.

Here is the Measure for the Daily YTD:

Online Sales (Fiscal Week YTD) =
VAR FiscalYearWeekYear = MAX('Date'[FiscalYearWeekYear])
VAR StartFiscalYear = CALCULATE(MIN('Date'[Date])
,REMOVEFILTERS('Date')
,'Date'[FiscalYearWeekSort] =

FiscalYearWeekYear * 100 + 1

)

VAR FiscalYearStartWeekDate = CALCULATE(MIN('Date'[FirstDayOfWeekDate])
,ALLEXCEPT('Date'
,'Date'[FiscalYearWeekYear]
)
,'Date'[Date] = StartFiscalYear

)
VAR MaxDate = MAX('Date'[Date])
RETURN
CALCULATE([Sum Online Sales]
,REMOVEFILTERS('Date')

,DATESBETWEEN('Date'[Date]
,FiscalYearStartWeekDate

,MaxDate
)

Here is the DAX Code for the Daily YTD PY:

Online Sales (Fiscal Week YTD) (PY)] =
VAR FiscalYearWeekYear = MAX('Date'[FiscalYearWeekYear])
-- Get the Week/Weekday at the start of the current Fiscal Year
VAR FiscalYearStart = CALCULATE(MIN('Date'[Date])
,REMOVEFILTERS('Date')
,'Date'[FiscalYearWeekSort] =

FiscalYearWeekYear * 100 + 1
)
VAR MaxDate = MAX('Date'[Date])
-- Get the number of Days since the start of the FiscalYear
VAR DaysFromFiscalYearStart =
DATEDIFF( FiscalYearStart, MaxDate, DAY )
-- Get the PY Date of the Fiscal Year Week Start date
VAR DateWeekStartPY = CALCULATE(MIN('Date'[Date])
,REMOVEFILTERS('Date')
,'Date'[FiscalYearWeekSort] =

(FiscalYearWeekYear - 101) * 100 + 1
)
RETURN
CALCULATE(
[Sum Online Sales],
DATESBETWEEN(
'Date'[Date],
DateWeekStartPY,
DateWeekStartPY + DaysFromFiscalYearStart

)
)

As you can see, both Measures follow the same pattern: 

  1. Get the current Fiscal Year. 
  2. Get the Starting Date of the current Fiscal Year. 
  3. Get the Starting date of the week starting the Fiscal Year. 
  4. Calculate the Result based on the Difference between these two dates 

For the PY Measure, one additional step is required: 

  • Calculate the days between the starting and current dates to calculate the correct YTD. This is necessary because of the date shift between the years. 

And here is the DAX code for the weekly base YTD: 

Online Sales (Fiscal Week YTD) =
VAR FiscalWeekSort = MAX( 'Date'[FiscalWeekSort] )
-- Get the Week/Weekday at the start of the current Fiscal Year
VAR FiscalYearNumber = MAX( 'Date'[FiscalYearWeekYear] )

RETURN
CALCULATE(
[Sum Online Sales],
REMOVEFILTERS('Date'),
'Date'[FiscalYearWeekSort] >= (FiscalYearNumber * 100 ) + 1
&& 'Date'[FiscalYearWeekSort] <= (FiscalYearNumber * 100 ) +
FiscalWeekSort
)

For the weekly YTD PY, the DAX code is the following: 

Online Sales (Fiscal Week YTD) (PY) =
VAR FiscalWeekSort = MAX( 'Date'[FiscalWeekSort] )
-- Get the Week/Weekday at the start of the current Fiscal Year
VAR FiscalYearNumberPY = MAX( 'Date'[FiscalYearWeekYearPY] )
RETURN
CALCULATE(
[Sum Online Sales],
REMOVEFILTERS('Date'),
'Date'[FiscalYearWeekSort] >= (FiscalYearNumberPY * 100) + 1
&& 'Date'[FiscalYearWeekSort] <= (FiscalYearNumberPY * 100) +
FiscalWeekSort
)

Again, both Measures follow the same pattern: 

  1. Get the current (Sort-) number of the week in the Fiscal year.
  2. Get the start date for the fiscal year’s first week.
  3. Calculate the result based on these values.

The result for the weekly based Measure is the following (At the weekly level, as the value is the same for each day of the same week): 

Figure 17 – Result for the first three weeks per Fiscal Year with the weekly based YTD and PY Measure (Figure by the Author) 

When comparing the two Approaches, the Measure for the weekly calculation is more efficient than the one for the daily calculation:

Figure 18 – Comparing the execution statistics for the two Measures. On the left is the daily, and on the right is the weekly calculation. They are the same for the calculation for the current and the previous year (Figure by the Author) 

As you can see, the Measure for the weekly result is faster, has a more significant portion executed in the Storage Engine (SE), and has fewer SE queries. 

Therefore, it can be a good idea to ask the users if they need a WTD result at the day level or if it’s enough to see the results at the week level. 

Conclusion 

When you start writing Time Intelligence expressions, consider whether additional calculated columns in your date table can be helpful. 

A carefully crafted and extended date table can be helpful for two reasons: 

  • Make Measures easier to write 
  • Improve the performance of the Measures 

They will be easier to write as I do not need to perform the calculations to get the intermediary results to calculate the required results. 

The consequence of shorter and simpler Measures is better efficiency and performance. 

I will add more and more columns to the template of my date table as I encounter more situations in which they can be helpful. 

One question remains: How to build it? 

In my case, I used an Azure SQL database to create the table used in my examples. 

But it’s possible to create a date table as a DAX table or use Python or JavaScript in Fabric or whatever data platform you use. 

Another option is to use the Bravo tool from SQLBI, which allows you to create a DAX table containing additional columns to support exotic Time Intelligence scenarios. 

References 

You can find more information about my date-table here

Read this piece to learn how to extract performance data in DAX-Studio and how to interpret it. 

An SQLBI article about building a date table to support weekly calculations: Using weekly calendars in Power Bi – SQLBI 

SQLBI Pattern to perform further weekly calculations: 

Week-related calculations – DAX Patterns 

Like in my previous articles, I use the Contoso sample dataset. You can download the ContosoRetailDW Dataset for free from Microsoft here

The Contoso Data can be freely used under the MIT License, as described here.

I changed the dataset to shift the data to contemporary dates. 

Shape
Shape
Stay Ahead

Explore More Insights

Stay ahead with more perspectives on cutting-edge power, infrastructure, energy,  bitcoin and AI solutions. Explore these articles to uncover strategies and insights shaping the future of industries.

Shape

Fortinet speeds threat detection with improved FortiAnalyzer

The package also now integrates with FortiAI, the vendor’s genAI assistant, to better support analytics and telemetry to help security teams speed threat investigation and response, the vendor stated. “FortiAI identifies the threats that need analysis from the data collected by FortiAnalyzer, primarily collected from FortiGates. By automating the collection,

Read More »

Aryaka adds AI-powered observability to SASE platform

Nadkarni explained that Aryaka runs unsupervised machine learning models on the data to identify anomalies and outliers in the data. For example, the models may detect a sudden spike in traffic to a domain that has not been seen before. This unsupervised analysis helps surface potential issues or areas of

Read More »

Exxon Plans to Ramp Up Guyana Gas Output, Sees Potential for Exports

Exxon Mobil Corp. outlined plans to increase natural gas production from oil-focused Guyana and is considering options to export the fuel to global markets, country manager Alistair Routledge said Wednesday.  Exxon’s developments off the coast of Guyana have turned the South American nation into the world’s fastest-growing major oil producer, but the company has faced pressure from the government to do more with the natural gas that’s found alongside its crude.  Routledge today presented a concept called “Wales Gas Vision” that would send gas from Exxon’s Longtail development to the shore for use in producing fertilizer and alumina as well as for powering data centers. Exxon plans to make a final investment decision on Longtail next year with a view to bringing it online by 2029. Gas production from the project could reach 1.2 billion cubic feet per day. Building a pipeline to nearby Trinidad, which has liquefied natural gas export capacity, would be “cost prohibitive,” but Exxon is exploring other ways to sell Guyana’s gas internationally, Routledge said at the Guyana Energy Conference in Georgetown.  “There is still a possibility of using liquefied natural gas technology connectors to global markets,” he said. “That is a further option that is on the table and being investigated.”  The Wales Gas Vision proposal is separate from Guyana’s gas-to-energy project, for which Exxon has already completed an underwater pipeline to supply fuel for power generation. Routledge cautioned the ideas depend on volume uptake, price and timing.  WHAT DO YOU THINK? Generated by readers, the comments included herein do not reflect the views and opinions of Rigzone. All comments are subject to editorial review. Off-topic, inappropriate or insulting comments will be removed. MORE FROM THIS AUTHOR Bloomberg

Read More »

DeepSeek called a net positive for data centers despite overcapacity worries

The global race to develop sophisticated, versatile AI models is driving a surge in development of the physical infrastructure to support them. Microsoft, Amazon, Meta and Google parent Alphabet — four of the AI industry’s biggest players — plan to invest a combined $325 billion in capital expenditures in 2025, much of it for data centers and associated hardware.  The technology giants’ spending plans mark a 46% increase from their combined 2024 capital investments, according to Yahoo! Finance, and track a doubling in proposed data centers’ average size from 150 gigawatts to 300 gigawatts between January 2023 and October 2024. In December, Meta said it would build a $10 billion, 4 million-square-foot data center in Louisiana that could consume the power output equivalent of two large nuclear reactors. The planned spending announcements came after the January release of the highly efficient, open-source AI platform DeepSeek, which led some experts and investors to question just how much infrastructure — from high-performance chips to new power plants and electrical equipment — the AI boom actually requires. But experts interviewed by Facilities Dive see AI efficiency gains as a net positive for data center developers, operators and customers in the long run, despite shorter-term uncertainty that could temporarily create overcapacity in some markets. “Every technology has gotten more efficient” DeepSeek’s late January commercial launch took many Americans by surprise, but the rise of a more efficient and capable AI model follows a well-worn pattern of technology development, said K.R. Sridhar, founder, chairman and CEO of power solutions provider Bloom Energy. “In 2010, it took about 1,500 watt-hours to facilitate the flow of one gigabyte of information,” Sridhar said. “Last year it took about one tenth of that … [but] the total growth of traffic, and therefore the chips and energy, has been twice

Read More »

FERC complies with major portions of Trump order on independent agencies: Christie

A White House executive order setting requirements for the Federal Energy Regulatory Commission and other independent agencies largely covers actions FERC already does, according to FERC Chairman Mark Christie. “A lot of this in the EO is basically putting in one place past practices that have been going on for years,” Christie said Thursday during a media briefing.  FERC, for example, submits its budget and strategic plans to the Office of Management and Budget for review, as required by the executive order, Christie said. The agency sends major rulemakings to the OMB’s Office of Information and Regulatory Affairs for review, FERC chairmen consult with White House officials and the commission has complied with executive orders for decades, according to Christie. Even so, Christie said he needed more information from the White House about certain aspects of the executive order. “Does this contemplate a role in proceedings outside of our ex parte rules?” Christie asked. Also, FERC works on more than 1,000 cases a year and it is unclear if any of them would undergo some sort of review because of the executive order, according to Christie. OMB is likely concerned about large, sweeping regulations issued by agencies, not routine cases that are initiated by third parties, Christie said. “We’re going to ask the appropriate places for more detail and see how this plays out,” Christie said. FERC’s activity is largely governed by the Federal Power Act, the Natural Gas Act, the Administrative Procedure Act, the National Environmental Policy Act and the Sunshine Act, Christie said. “At the end of the day, we follow the law,” he said. The executive order includes a clause stating that nothing in the document affects existing law or the authority of an agency under existing law, Christie noted. FERC was established under the Department of

Read More »

FERC launches colocation review, plus 6 other open meeting takeaways

The Federal Energy Regulatory Commission on Thursday launched a review of issues related to colocating large loads, such as data centers, at power plants in the PJM Interconnection. “There are tremendous implications for reliability and consumers, and we have to be fair,” FERC Chairman Mark Christie said during the agency’s monthly meeting. At the same time, utilities have an obligation to serve new customers, he said. FERC’s effort to clarify rules for colocated load comes amid a surge in data center development across the United States, partly driven by the growth of artificial intelligence. Colocating data centers at existing power plants provides a potential pathway to bringing data centers online quickly and at lower cost compared with “front of meter” options. However, new rules governing colocated resources in PJM likely won’t be approved by FERC until early next year, creating a period of uncertainty for independent power producers such as Talen Energy and Vistra by delaying deal announcements with data center operators, Capstone analysts said Thursday. FERC aims to approve new colocation rules for PJM this year, said Ben Williams, FERC director of the office of external affairs. The agency expects it will vote on a PJM proposal within three months of one being filed at the commission, he noted. The lack of near-term clarity on colocation is another negative development for IPPs and raises the potential that data center developers will prefer to work with regulated utilities instead of in competitive markets, Jeffries analysts said. Issues surrounding siting data centers at large power plants in PJM came to a head late last year. The agency in November rejected an amended interconnection service agreement that would have facilitated expanded power sales to a colocated Amazon data center from the Susquehanna nuclear power plant in Pennsylvania that is majority owned by

Read More »

Torus, Rocky Mountain Power sign MOU for 70-MW C&I demand response capability

Dive Brief: A memorandum of understanding between PacifiCorp subsidiary Rocky Mountain Power and Utah-based distributed energy solutions provider Torus could deliver 70 MW of commercial and industrial demand response capability to RMP’s Wattsmart Battery program within 12 to 18 months, Torus said on Feb. 7. Torus has already filled about one-third of the project’s expected capacity and is “in active permitting and approvals for the deployment of those assets today,” Torus founder and CEO Nate Walkingshaw said in an interview. The partnership “is a great example of Utah’s leadership in innovative energy solutions” as the state looks to double its power production capacity over the next 10 years while remaining a net energy exporter, Utah Gov. Spencer Cox, R, said last month. Dive Insight: The Wattsmart Battery program is “among the most advanced [virtual power plants] in the U.S. due to its degree of integration into the utility’s overall system operations and the wide array of use cases (grid services) of the battery aggregation,” the U.S. Department of Energy said last month in its updated Pathways to Commercial Liftoff: Virtual Power Plants report. The program is already in heavy use, with more than 130 response events in 2024, primarily to manage late afternoon and evening loads, Walkingshaw said. Other energy management providers participate in its residential component, but Torus is the only vendor working with C&I customers, he added. Under the MOU, Torus will deploy its hybrid flywheel battery energy storage systems behind the meter at commercial and industrial facilities across the Wattsmart program territory, which recently expanded from its Utah home base into Wyoming and parts of Idaho, Walkingshaw said. The company is focused on Utah but available to RMP customers in Wyoming and Idaho, a Torus spokesperson said. Customers can immediately use the storage systems to reduce utility

Read More »

U.S. Department of Energy Recognizes National Black History Month, 2025

WASHINGTON— U.S. Secretary of Energy Chris Wright released the following statement in recognition of National Black History Month – February 2025:  “Today, I am honored to join President Trump in recognizing February 2025 as National Black History Month. Throughout our history, Black Americans have strengthened our nation’s position as a global leader in energy production, science, and technology. Lewis Latimer’s contributions to electric lighting, Dr. George Washington Carver’s advancements in biofuels, and Dr. William Knox and Dr. Blanche Lawrence’s critical work on the Manhattan Project are just a few examples of the innovation and dedication to excellence that embody the American spirit—one of hard work, determination, and a relentless drive to achieve greatness.  “The Department of Energy remains committed to advancing bold, America-first energy policies that empower our workforce, fuel economic growth, and solidify our nation’s leadership on the world stage. This Black History Month, join us as we celebrate the patriots and pioneers who have contributed to America’s energy success and look forward to a future where we continue to lead the world in energy production, innovation, and strength.” ###

Read More »

Do data centers threaten the water supply?

In a new report, the Royal Academy of Engineering called upon the government to ensure tech companies accurately report how much energy and water their data centers are using and reducing the use of drinking water for cooling. Without such action, warns one of the report’s authors, Professor Tom Rodden, “we face a real risk that our development, deployment and use of AI could do irreparable damage to the environment.” The situation is a little different for the US as the country has large bodies of water offering a  water supply that the UK just does not have. It’s not an accident that there are many data centers around the Chicago area: they’ve also got the Great Lakes to draw upon. Likewise, the Columbia and Klamath Rivers have become magnets for data centers for both water supply and hydroelectric power. Other than the Thames River, the UK doesn’t have these massive bodies of water. Still, the problem is not unique to the UK, says Alan Howard, senior analyst with Omdia. He notes that Microsoft took heat last year because it was draining the water supply of a small Arizona town of Goodyear with a new AI-oriented data center.  The city of Chandler, Arizona passed an ordinance in 2015 that restricted new water-intensive businesses from setting up shop which slowed data center development.   “I believe some data center operators just bowed out,” said Howard.

Read More »

Ireland says there will be no computation without generation

Stanish said that, in 2023, she wrote a paper that predicted “by 2028, more than 70% of multinational enterprises will alter their data center strategies due to limited energy supplies and data center moratoriums, up from only about 5% in 2023. It has been interesting watching this trend evolve as expected, with Ireland being a major force in this conversation since the boycotts against data center growth started a few years ago.” Fair, equitable, and stable electricity allocation, she said, “means that the availability of electricity for digital services is not guaranteed in the future, and I expect these policies, data center moratoriums, and regional rejections will only continue and expand moving forward.” Stanish pointed out that this trend is not just occurring in Ireland. “Many studies show that, globally, enterprises’ digital technologies are consuming energy at a faster rate than overall growth in energy supply (though, to be clear, these studies mostly assume a static position on energy efficiency of current technologies, and don’t take into account potential for nuclear or hydrogen to assuage some of these supply issues).” If taken at face value, she said, this means that a lack of resources could cause widespread electricity shortages in data centers over the next several years. To mitigate this, Stanish said, “so far, data center moratoriums and related constraints (including reduced tax incentives) have been enacted in the US (specifically Virginia and Georgia), Denmark, Singapore, and other countries, in response to concerns about the excessive energy consumption of IT, particularly regarding compute-intense AI workloads and concerns regarding an IT energy monopoly in certain regions. As a result, governments (federal, state, county, etc.) are working to ensure that consumption does not outpace capacity.” Changes needed In its report, the CRU stated, “a safe and secure supply of energy is essential

Read More »

Perspective: Can We Solve the AI Data Center Power Crisis with Microgrids?

President Trump announced a$500 billion private sector investment in the nation’s Artificial Intelligence (AI) infrastructure last month. The investment will come from The Stargate Project, a joint venture between OpenAI, SoftBank, Oracle and MGX, which intends to build 20 new AI data centers in the U.S in the next four to five years. The Stargate Project committed$100 billion for immediate deployment and construction has already begun on its first data center in Texas. At approximately a half a million square feet each, the partners say these new facilities will cement America’s leadership in AI, create jobs and stimulate economic growth. Stargate is not the only game in town, either. Microsoft is expected to invest$80 billion in AI data center development in 2025, with Google, AWS and Meta also spending big. While all this investment in AI infrastructure is certainly exciting, experts say there’s one lingering question that’s yet to be answered and it’s a big one: How are we going to power all these AI data centers? This will be one of the many questions tackled duringMicrogrid Knowledge’s annual conference, which will be held in Texas April 15-17 at the Sheraton Dallas. “Powering Data Centers: Collaborative Microgrid Solutions for a Growing Market” will be one of the key sessions on April 16. Industry experts will gather to discuss how private entities, developers and utilities can work together to deploy microgrids and distributed energy technologies that address the data center industry’s power needs. The panel will share solutions, technologies and strategies that will favorably position data centers in the energy queue. In advance of this session, we sat down with two microgrid experts to learn more about the challenges facing the data center industry and how microgrids can address the sector’s growing energy needs. We spoke with Michael Stadler, co-founder and

Read More »

Data Center Tours: Iron Mountain VA-1, Manassas, Virginia

Iron Mountain Northern Virginia Overview Iron Mountain’s Northern Virginia data centers VA-1 through VA-7 are situated on a 142-acre highly secure campus in Prince William County, Virginia. Located at 11680 Hayden Road in Manassas, Iron Mountain VA-1 spans 167,958 sq. ft. and harbors 12.4 MW of total capacity to meet colocation needs. The 36 MW VA-2 facility stands nearby. The total campus features a mixture of single and multi-tenant facilities which together provide more than 2,000,000 SF of highly efficient green colocation space for enterprises, federal agencies, service providers and hyperscale clouds.  The company notes that its Manassas campus offers tax savings compared to Ashburn and exceptional levels of energy-efficiency as well as a diverse and accessible ecosystem of cloud, network and other service providers.  Iron Mountain’s Virginia campus has 9 total planned data centers, with 5 operational facilities to date and two more data centers coming soon. VA-2 recently became the first data center in the United States to achieve DCOS Maturity Level 3.    As we continued the tour, Kinra led the way toward the break room, an area where customers can grab coffee or catch up on work. Unlike the high-end aesthetic of some other colocation providers, Iron Mountain’s approach is more practical and focused on functionality. At the secure shipping and receiving area, Kinra explained the process for handling customer equipment. “This is where our customers ship their equipment into,” he said. “They submit a ticket, send their shipments in, and we’ll take it, put it aside for them, and let them know when it’s here. Sometimes they ask us to take it to their environment, which we’ll do for them via a smart hands ticket.” Power Infrastructure and Security Measures The VA-1 campus is supported by a single substation, providing the necessary power for its growing

Read More »

Land and Expand: DPO, Microsoft, JLL and BlackChamber, Prologis, Core Scientific, Overwatch Capital

Land and Expand is a periodic feature at Data Center Frontier highlighting the latest data center development news, including new sites, land acquisitions and campus expansions. Here are some of the new and notable developments from hyperscale and colocation data center developers and operators about which we’ve been reading lately. DPO to Develop $200 Million AI Data Center in Wisconsin Rapids; Strategic Partnership with Billerud’s CWPCo Unlocks Hydroelectric Power for High-Density AI Compute Digital Power Optimization (DPO) is moving forward with plans to build a $200 million high-performance computing (HPC) data center in Wisconsin Rapids, Wisconsin. The project, designed to support up to 20 megawatts (MW) of artificial intelligence (AI) computing, leverages an innovative partnership with Consolidated Water Power Company (CWPCo), a subsidiary of global packaging leader Billerud. DPO specializes in developing and operating data centers optimized for power-dense computing. By partnering with utilities and independent power producers, DPO colocates its facilities at energy generation sites, ensuring direct access to sustainable power for AI, HPC, and blockchain computing. The company is privately held. Leveraging Power Infrastructure for Speed-to-Energization CWPCo, a regulated utility subsidiary, has operated hydroelectric generation assets since 1894, reliably serving industrial and commercial customers in Wisconsin Rapids, Biron, and Stevens Point. Parent company Billerud is a global leader in high-performance packaging materials, committed to sustainability and innovation. The company operates nine production facilities across Sweden, the USA, and Finland, employing 5,800 people in over 19 countries.  The data center will be powered by CWPCo’s renewable hydroelectric assets, tapping into the utility’s existing 32 megawatts of generation capacity. The partnership grants DPO a long-term land lease—extending up to 50 years—alongside interconnection rights to an already-energized substation and a firm, reliable power supply. “AI infrastructure is evolving at an unprecedented pace, and access to power-dense sites is critical,” said Andrew

Read More »

Data center spending to top $1 trillion by 2029 as AI transforms infrastructure

His projections account for recent advances in AI and data center efficiency, he says. For example, the open-source AI model from Chinese company DeepSeek seems to have shown that an LLM can produce very high-quality results at a very low cost with some clever architectural changes to how the models work. These improvements are likely to be quickly replicated by other AI companies. “A lot of these companies are trying to push out more efficient models,” says Fung. “There’s a lot of effort to reduce costs and to make it more efficient.” In addition, hyperscalers are designing and building their own chips, optimized for their AI workloads. Just the accelerator market alone is projected to reach $392 billion by 2029, Dell’Oro predicts. By that time, custom accelerators will outpace commercially available accelerators such as GPUs. The deployment of dedicated AI servers also has an impact on networking, power and cooling. As a result, spending on data center physical infrastructure (DCPI) will also increase, though at a more moderate pace, growing by 14% annually to $61 billion in 2029.  “DCPI deployments are a prerequisite to support AI workloads,” says Tam Dell’Oro, founder of Dell’Oro Group, in the report. The research firm raised its outlook in this area due to the fact that actual 2024 results exceeded its expectations, and demand is spreading from tier one to tier two cloud service providers. In addition, governments and tier one telecom operators are getting involved in data center expansion, making it a long-term trend.

Read More »

Microsoft will invest $80B in AI data centers in fiscal 2025

And Microsoft isn’t the only one that is ramping up its investments into AI-enabled data centers. Rival cloud service providers are all investing in either upgrading or opening new data centers to capture a larger chunk of business from developers and users of large language models (LLMs).  In a report published in October 2024, Bloomberg Intelligence estimated that demand for generative AI would push Microsoft, AWS, Google, Oracle, Meta, and Apple would between them devote $200 billion to capex in 2025, up from $110 billion in 2023. Microsoft is one of the biggest spenders, followed closely by Google and AWS, Bloomberg Intelligence said. Its estimate of Microsoft’s capital spending on AI, at $62.4 billion for calendar 2025, is lower than Smith’s claim that the company will invest $80 billion in the fiscal year to June 30, 2025. Both figures, though, are way higher than Microsoft’s 2020 capital expenditure of “just” $17.6 billion. The majority of the increased spending is tied to cloud services and the expansion of AI infrastructure needed to provide compute capacity for OpenAI workloads. Separately, last October Amazon CEO Andy Jassy said his company planned total capex spend of $75 billion in 2024 and even more in 2025, with much of it going to AWS, its cloud computing division.

Read More »

John Deere unveils more autonomous farm machines to address skill labor shortage

Join our daily and weekly newsletters for the latest updates and exclusive content on industry-leading AI coverage. Learn More Self-driving tractors might be the path to self-driving cars. John Deere has revealed a new line of autonomous machines and tech across agriculture, construction and commercial landscaping. The Moline, Illinois-based John Deere has been in business for 187 years, yet it’s been a regular as a non-tech company showing off technology at the big tech trade show in Las Vegas and is back at CES 2025 with more autonomous tractors and other vehicles. This is not something we usually cover, but John Deere has a lot of data that is interesting in the big picture of tech. The message from the company is that there aren’t enough skilled farm laborers to do the work that its customers need. It’s been a challenge for most of the last two decades, said Jahmy Hindman, CTO at John Deere, in a briefing. Much of the tech will come this fall and after that. He noted that the average farmer in the U.S. is over 58 and works 12 to 18 hours a day to grow food for us. And he said the American Farm Bureau Federation estimates there are roughly 2.4 million farm jobs that need to be filled annually; and the agricultural work force continues to shrink. (This is my hint to the anti-immigration crowd). John Deere’s autonomous 9RX Tractor. Farmers can oversee it using an app. While each of these industries experiences their own set of challenges, a commonality across all is skilled labor availability. In construction, about 80% percent of contractors struggle to find skilled labor. And in commercial landscaping, 86% of landscaping business owners can’t find labor to fill open positions, he said. “They have to figure out how to do

Read More »

2025 playbook for enterprise AI success, from agents to evals

Join our daily and weekly newsletters for the latest updates and exclusive content on industry-leading AI coverage. Learn More 2025 is poised to be a pivotal year for enterprise AI. The past year has seen rapid innovation, and this year will see the same. This has made it more critical than ever to revisit your AI strategy to stay competitive and create value for your customers. From scaling AI agents to optimizing costs, here are the five critical areas enterprises should prioritize for their AI strategy this year. 1. Agents: the next generation of automation AI agents are no longer theoretical. In 2025, they’re indispensable tools for enterprises looking to streamline operations and enhance customer interactions. Unlike traditional software, agents powered by large language models (LLMs) can make nuanced decisions, navigate complex multi-step tasks, and integrate seamlessly with tools and APIs. At the start of 2024, agents were not ready for prime time, making frustrating mistakes like hallucinating URLs. They started getting better as frontier large language models themselves improved. “Let me put it this way,” said Sam Witteveen, cofounder of Red Dragon, a company that develops agents for companies, and that recently reviewed the 48 agents it built last year. “Interestingly, the ones that we built at the start of the year, a lot of those worked way better at the end of the year just because the models got better.” Witteveen shared this in the video podcast we filmed to discuss these five big trends in detail. Models are getting better and hallucinating less, and they’re also being trained to do agentic tasks. Another feature that the model providers are researching is a way to use the LLM as a judge, and as models get cheaper (something we’ll cover below), companies can use three or more models to

Read More »

OpenAI’s red teaming innovations define new essentials for security leaders in the AI era

Join our daily and weekly newsletters for the latest updates and exclusive content on industry-leading AI coverage. Learn More OpenAI has taken a more aggressive approach to red teaming than its AI competitors, demonstrating its security teams’ advanced capabilities in two areas: multi-step reinforcement and external red teaming. OpenAI recently released two papers that set a new competitive standard for improving the quality, reliability and safety of AI models in these two techniques and more. The first paper, “OpenAI’s Approach to External Red Teaming for AI Models and Systems,” reports that specialized teams outside the company have proven effective in uncovering vulnerabilities that might otherwise have made it into a released model because in-house testing techniques may have missed them. In the second paper, “Diverse and Effective Red Teaming with Auto-Generated Rewards and Multi-Step Reinforcement Learning,” OpenAI introduces an automated framework that relies on iterative reinforcement learning to generate a broad spectrum of novel, wide-ranging attacks. Going all-in on red teaming pays practical, competitive dividends It’s encouraging to see competitive intensity in red teaming growing among AI companies. When Anthropic released its AI red team guidelines in June of last year, it joined AI providers including Google, Microsoft, Nvidia, OpenAI, and even the U.S.’s National Institute of Standards and Technology (NIST), which all had released red teaming frameworks. Investing heavily in red teaming yields tangible benefits for security leaders in any organization. OpenAI’s paper on external red teaming provides a detailed analysis of how the company strives to create specialized external teams that include cybersecurity and subject matter experts. The goal is to see if knowledgeable external teams can defeat models’ security perimeters and find gaps in their security, biases and controls that prompt-based testing couldn’t find. What makes OpenAI’s recent papers noteworthy is how well they define using human-in-the-middle

Read More »

Talking about Games

Game theory is a field of research that is quite prominent in Economics but rather unpopular in other scientific disciplines. However, the concepts used in

Read More »