Stay Ahead, Stay ONMINE

Do European M&Ms Actually Taste Better than American M&Ms?

(Oh, I am the only one who’s been asking this question…? Hm. Well, if you have a minute, please enjoy this exploratory Data Analysis — featuring experimental design, statistics, and interactive visualization — applied a bit too earnestly to resolve an international debate.) 1. Introduction 1.1 Background and motivation Chocolate is enjoyed around the world. […]

(Oh, I am the only one who’s been asking this question…? Hm. Well, if you have a minute, please enjoy this exploratory Data Analysis — featuring experimental design, statistics, and interactive visualization — applied a bit too earnestly to resolve an international debate.)

1. Introduction

1.1 Background and motivation

Chocolate is enjoyed around the world. From ancient practices harvesting organic cacao in the Amazon basin, to chocolatiers sculpting edible art in the mountains of Switzerland, and enormous factories in Hershey, Pennsylvania churning out 70 million kisses per day, the nuanced forms and flavors of chocolate have been integrated into many cultures and their customs. While quality can greatly vary across chocolate products, a well-known, shelf-stable, easily shareable form of chocolate are M&Ms. Readily found by convenience store check-out counters and in hotel vending machines, the brightly colored pellets are a popular treat whose packaging is re-branded to fit nearly any commercializable American holiday.

While living in Denmark in 2022, I heard a concerning claim: M&Ms manufactured in Europe taste different, and arguably “better,” than M&Ms produced in the United States. While I recognized that fancy European chocolate is indeed quite tasty and often superior to American chocolate, it was unclear to me if the same claim should hold for M&Ms. I learned that many Europeans perceive an “unpleasant” or “tangy” taste in American chocolate, which is largely attributed to butyric acid, a compound resulting from differences in how milk is treated before incorporation into milk chocolate.

But honestly, how much of a difference could this make for M&Ms? M&Ms!? I imagined M&Ms would retain a relatively processed/mass-produced/cheap candy flavor wherever they were manufactured. As the lone American visiting a diverse lab of international scientists pursuing cutting-edge research in biosustainability, I was inspired to break out my data science toolbox and investigate this M&M flavor phenomenon.

1.2 Previous work

To quote a European woman, who shall remain anonymous, after she tasted an American M&M while traveling in New York:

“They taste so gross. Like vomit. I don’t understand how people can eat this. I threw the rest of the bag away.”

Vomit? Really? In my experience, children raised in the United States had no qualms about eating M&Ms. Growing up, I was accustomed to bowls of M&Ms strategically placed in high traffic areas around my house to provide readily available sugar. Clearly American M&Ms are edible. But are they significantly different and/or inferior to their European equivalent?

In response to the anonymous European woman’s scathing report, myself and two other Americans visiting Denmark sampled M&Ms purchased locally in the Lyngby Storcenter Føtex. We hoped to experience the incredible improvement in M&M flavor that was apparently hidden from us throughout our youths. But curiously, we detected no obvious flavor improvements.

Unfortunately, neither preliminary study was able to conduct a side-by-side taste test with proper controls and randomized M&M sampling. Thus, we turn to science.

1.3 Study Goals

This study seeks to remedy the previous lack of thoroughness and investigate the following questions:

  1. Is there a global consensus that European M&Ms are in fact better than American M&Ms?
  2. Can Europeans actually detect a difference between M&Ms purchased in the US vs in Europe when they don’t know which one they are eating? Or is this a grand, coordinated lie amongst Europeans to make Americans feel embarrassed?
  3. Are Americans actually taste-blind to American vs European M&Ms? Or can they taste a difference but simply don’t describe this difference as “an improvement” in flavor?
  4. Can these alleged taste differences be perceived by citizens of other continents? If so, do they find one flavor obviously superior?

2. Methods

2.1 Experimental design and data collection

Participants were recruited by luring — er, inviting them to a social gathering (with the promise of free food) that was conveniently co-located with the testing site. Once a participant agreed to pause socializing and join the study, they were positioned at a testing station with a trained experimenter who guided them through the following steps:

  • Participants sat at a table and received two cups: 1 empty and 1 full of water. With one cup in each hand, the participant was asked to close their eyes, and keep them closed through the remainder of the experiment.
  • The experimenter randomly extracted one M&M with a spoon, delivered it to the participant’s empty cup, and the participant was asked to eat the M&M (eyes still closed).
  • After eating each M&M, the experimenter collected the taste response by asking the participant to report if they thought the M&M tasted: Especially Good, Especially Bad, or Normal.
  • Each participant received a total of 10 M&Ms (5 European, 5 American), one at a time, in a random sequence determined by random.org.
  • Between eating each M&M, the participant was asked to take a sip of water to help “cleanse their palate.”
  • Data collected: for each participant, the experimenter recorded the participant’s continent of origin (if this was ambiguous, the participant was asked to list the continent on which they have the strongest memories of eating candy as a child). For each of the 10 M&Ms delivered, the experimenter recorded the M&M origin (“Denmark” or “USA”), the M&M color, and the participant’s taste response. Experimenters were also encouraged to jot down any amusing phrases uttered by the participant during the test, recorded under notes (data available here).

2.2 Sourcing materials and recruiting participants

Two bags of M&Ms were purchased for this study. The American-sourced M&Ms (“USA M&M”) were acquired at the SFO airport and delivered by the author’s parents, who visited her in Denmark. The European-sourced M&Ms (“Denmark M&M”) were purchased at a local Føtex grocery store in Lyngby, a little north of Copenhagen.

Experiments were conducted at two main time points. The first 14 participants were tested in Lyngby, Denmark in August 2022. They mostly consisted of friends and housemates the author met at the Novo Nordisk Foundation Center for Biosustainability at the Technical University of Denmark (DTU) who came to a “going away party” into which the experimental procedure was inserted. A few additional friends and family who visited Denmark were also tested during their travels (e.g. on the train).

The remaining 37 participants were tested in Seattle, WA, USA in October 2022, primarily during a “TGIF happy hour” hosted by graduate students in the computer science PhD program at the University of Washington. This second batch mostly consisted of students and staff of the Paul. G. Allen School of Computer Science & Engineering (UW CSE) who responded to the weekly Friday summoning to the Allen Center atrium for free snacks and drinks.

Figure 1. Distribution of participants recruited to the study. In the first sampling event in Lyngby, participants primarily hailed from North America and Europe, and a few additionally came from Asia, South America, or Australia. Our second sampling event in Seattle greatly increased participants, primarily from North America and Asia, and a few more from Europe. Neither event recruited participants from Africa. Figure made with Altair.

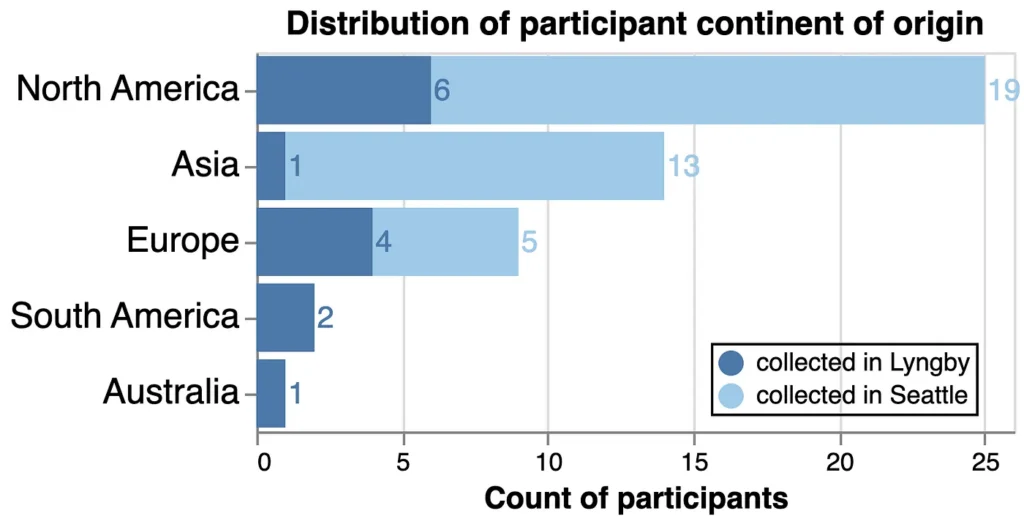
While this study set out to analyze global trends, unfortunately data was only collected from 51 participants the author was able to lure to the study sites and is not well-balanced nor representative of the 6 inhabited continents of Earth (Figure 1). We hope to improve our recruitment tactics in future work. For now, our analytical power with this dataset is limited to response trends for individuals from North America, Europe, and Asia, highly biased by subcommunities the author happened to engage with in late 2022.

2.3 Risks

While we did not acquire formal approval for experimentation with human test subjects, there were minor risks associated with this experiment: participants were warned that they may be subjected to increased levels of sugar and possible “unpleasant flavors” as a result of participating in this study. No other risks were anticipated.

After the experiment however, we unfortunately observed several cases of deflated pride when a participant learned their taste response was skewed more positively towards the M&M type they were not expecting. This pride deflation seemed most severe among European participants who learned their own or their fiancé’s preference skewed towards USA M&Ms, though this was not quantitatively measured and cannot be confirmed beyond anecdotal evidence.

3. Results & Discussion

3.1 Overall response to “USA M&Ms” vs “Denmark M&Ms”

3.1.1 Categorical response analysis — entire dataset

In our first analysis, we count the total number of “Bad”, “Normal”, and “Good” taste responses and report the percentage of each response received by each M&M type. M&Ms from Denmark more frequently received “Good” responses than USA M&Ms but also more frequently received “Bad” responses. M&Ms from the USA were most frequently reported to taste “Normal” (Figure 2). This may result from the elevated number of participants hailing from North America, where the USA M&M is the default and thus more “Normal,” while the Denmark M&M was more often perceived as better or worse than the baseline.

Figure 2. Qualitative taste response distribution across the whole dataset. The percentage of taste responses for “Bad”, “Normal” or “Good” was calculated for each type of M&M. Figure made with Altair.

Now let’s break out some Statistics, such as a chi-squared (X2) test to compare our observed distributions of categorical taste responses. Using the scipy.stats chi2_contingency function, we built contingency tables of the observed counts of “Good,” “Normal,” and “Bad” responses to each M&M type. Using the X2 test to evaluate the null hypothesis that there is no difference between the two M&Ms, we found the p-value for the test statistic to be 0.0185, which is significant at the common p-value cut off of 0.05, but not at 0.01. So a solid “maybe,” depending on whether you’d like this result to be significant or not.

3.1.2 Quantitative response analysis — entire dataset.

The X2 test helps evaluate if there is a difference in categorical responses, but next, we want to determine a relative taste ranking between the two M&M types. To do this, we converted taste responses to a quantitative distribution and calculated a taste score. Briefly, “Bad” = 1, “Normal” = 2, “Good” = 3. For each participant, we averaged the taste scores across the 5 M&Ms they tasted of each type, maintaining separate taste scores for each M&M type.

Figure 3. Quantitative taste score distributions across the whole dataset. Kernel density estimation of the average taste score calculated for each participant for each M&M type. Figure made with Seaborn.

With the average taste score for each M&M type in hand, we turn to scipy.stats ttest_ind (“T-test”) to evaluate if the means of the USA and Denmark M&M taste scores are different (the null hypothesis being that the means are identical). If the means are significantly different, it would provide evidence that one M&M is perceived as significantly tastier than the other.

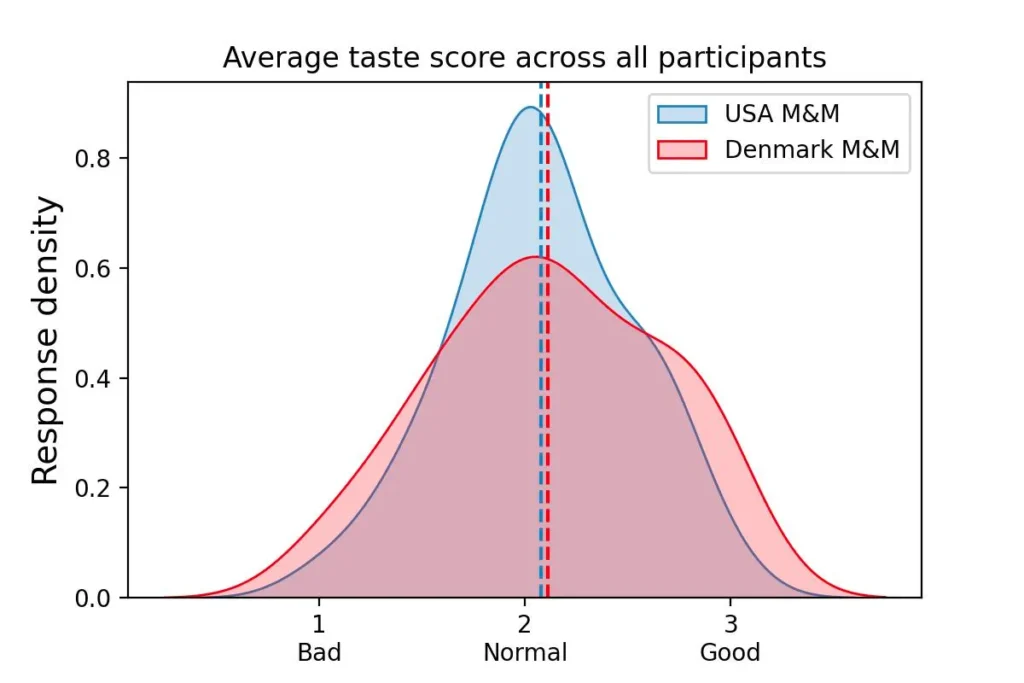
We found the average taste scores for USA M&Ms and Denmark M&Ms to be quite close (Figure 3), and not significantly different (T-test: = 0.721). Thus, across all participants, we do not observe a difference between the perceived taste of the two M&M types (or if you enjoy parsing triple negatives: “we cannot reject the null hypothesis that there is not a difference”).

But does this change if we separate participants by continent of origin?

3.2 Continent-specific responses to “USA M&Ms” vs “Denmark M&Ms”

We repeated the above X2 and T-test analyses after grouping participants by their continents of origin. The Australia and South America groups were combined as a minimal attempt to preserve data privacy. Due to the relatively small sample size of even the combined Australia/South America group (n=3), we will refrain from analyzing trends for this group but include the data in several figures for completeness and enjoyment of the participants who may eventually read this.

3.2.1 Categorical response analysis — by continent

In Figure 4, we display both the taste response counts (upper panel, note the interactive legend) and the response percentages (lower panel) for each continent group. Both North America and Asia follow a similar trend to the whole population dataset: participants report Denmark M&Ms as “Good” more frequently than USA M&Ms, but also report Denmark M&Ms as “Bad” more frequently. USA M&Ms were most frequently reported as “Normal” (Figure 4).

On the contrary, European participants report USA M&Ms as “Bad” nearly 50% of the time and “Good” only 18% of the time, which is the most negative and least positive response pattern, respectively (when excluding the under-sampled Australia/South America group).

Figure 4. Qualitative taste response distribution by continent. Upper panel: counts of taste responses — click the legend to interactively filter! Lower panel: percentage of taste responses for each type of M&M. Figure made with Altair.

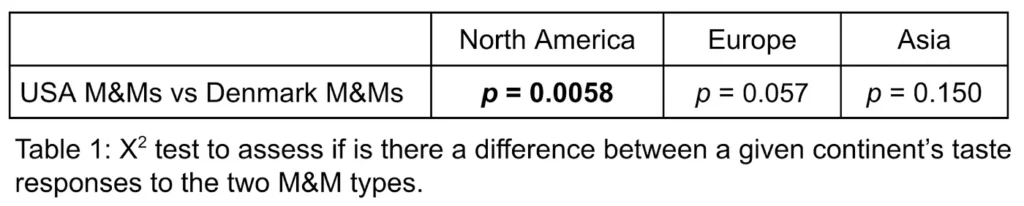
This appeared striking in bar chart form, however only North America had a significant X2 p-value (p = 0.0058) when evaluating each continent’s difference in taste response profile between the two M&M types. The European p-value is perhaps “approaching significance” in some circles, but we’re about to accumulate several more hypothesis tests and should be mindful of multiple hypothesis testing (Table 1). A false positive result here would be devastating.

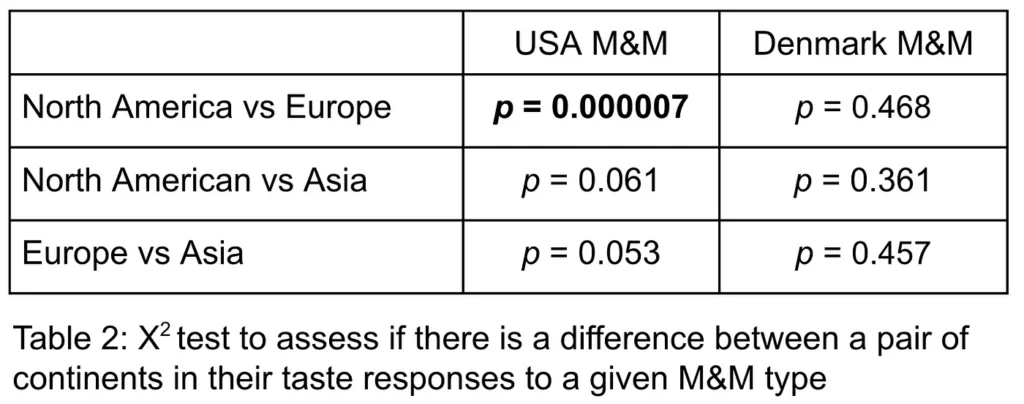
When comparing the taste response profiles between two continents for the same M&M type, there are a couple interesting notes. First, we observed no major taste discrepancies between all pairs of continents when evaluating Denmark M&Ms — the world seems generally consistent in their range of feelings about M&Ms sourced from Europe (right column X2 p-values, Table 2). To visualize this comparison more easily, we reorganize the bars in Figure 4 to group them by M&M type (Figure 5).

Figure 5. Qualitative taste response distribution by M&M type, reported as percentages. (Same data as Figure 4 but re-arranged). Figure made with Altair.

However, when comparing continents to each other in response to USA M&Ms, we see larger discrepancies. We found one pairing to be significantly different: European and North American participants evaluated USA M&Ms very differently (p = 0.000007) (Table 2). It seems very unlikely that this observed difference is by random chance (left column, Table 2).

3.2.2 Quantitative response analysis — by continent

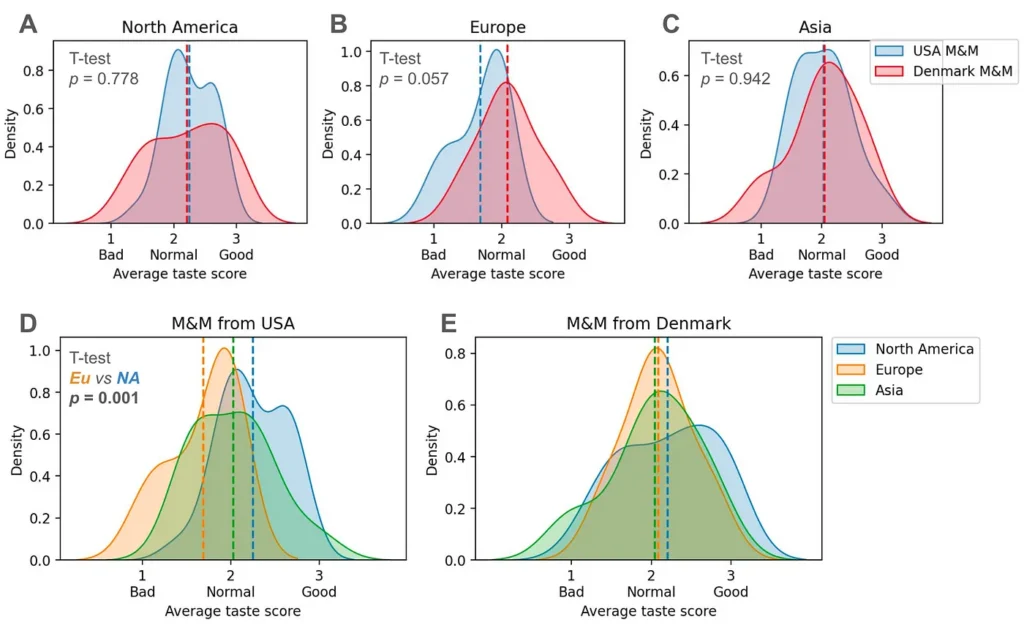
We again convert the categorical profiles to quantitative distributions to assess continents’ relative preference of M&M types. For North America, we see that the taste score means of the two M&M types are actually quite similar, but there is a higher density around “Normal” scores for USA M&Ms (Figure 6A). The European distributions maintain a bit more of a separation in their means (though not quite significantly so), with USA M&Ms scoring lower (Figure 6B). The taste score distributions of Asian participants is most similar (Figure 6C).

Reorienting to compare the quantitative means between continents’ taste scores for the same M&M type, only the comparison between North American and European participants on USA M&Ms is significantly different based on a T-test (p = 0.001) (Figure 6D), though now we really are in danger of multiple hypothesis testing! Be cautious if you are taking this analysis at all seriously.

Figure 6. Quantitative taste score distributions by continent. Kernel density estimation of the average taste score calculated for each each continent for each M&M type. A. Comparison of North America responses to each M&M. B. Comparison of Europe responses to each M&M. C. Comparison of Asia responses to each M&M. D. Comparison of continents for USA M&Ms. E. Comparison of continents for Denmark M&Ms. Figure made with Seaborn.

At this point, I feel myself considering that maybe Europeans are not just making this up. I’m not saying it’s as dramatic as some of them claim, but perhaps a difference does indeed exist… To some degree, North American participants also perceive a difference, but the evaluation of Europe-sourced M&Ms is not consistently positive or negative.

3.3 M&M taste alignment chart

In our analyses thus far, we did not account for the baseline differences in M&M appreciation between participants. For example, say Person 1 scored all Denmark M&Ms as “Good” and all USA M&Ms as “Normal”, while Person 2 scored all Denmark M&Ms as “Normal” and all USA M&Ms as “Bad.” They would have the same relative preference for Denmark M&Ms over USA M&Ms, but Person 2 perhaps just does not enjoy M&Ms as much as Person 1, and the relative preference signal is muddled by averaging the raw scores.

Inspired by the Lawful/Chaotic x Good/Evil alignment chart used in tabletop role playing games like Dungeons & Dragons©™, in Figure 7, we establish an M&M alignment chart to help determine the distribution of participants across M&M enjoyment classes.

Figure 7. M&M enjoyment alignment chart. The x-axis represents a participant’s average taste score for USA M&Ms; the y-axis is a participant’s average taste score for Denmark M&Ms. Figure made with Altair.

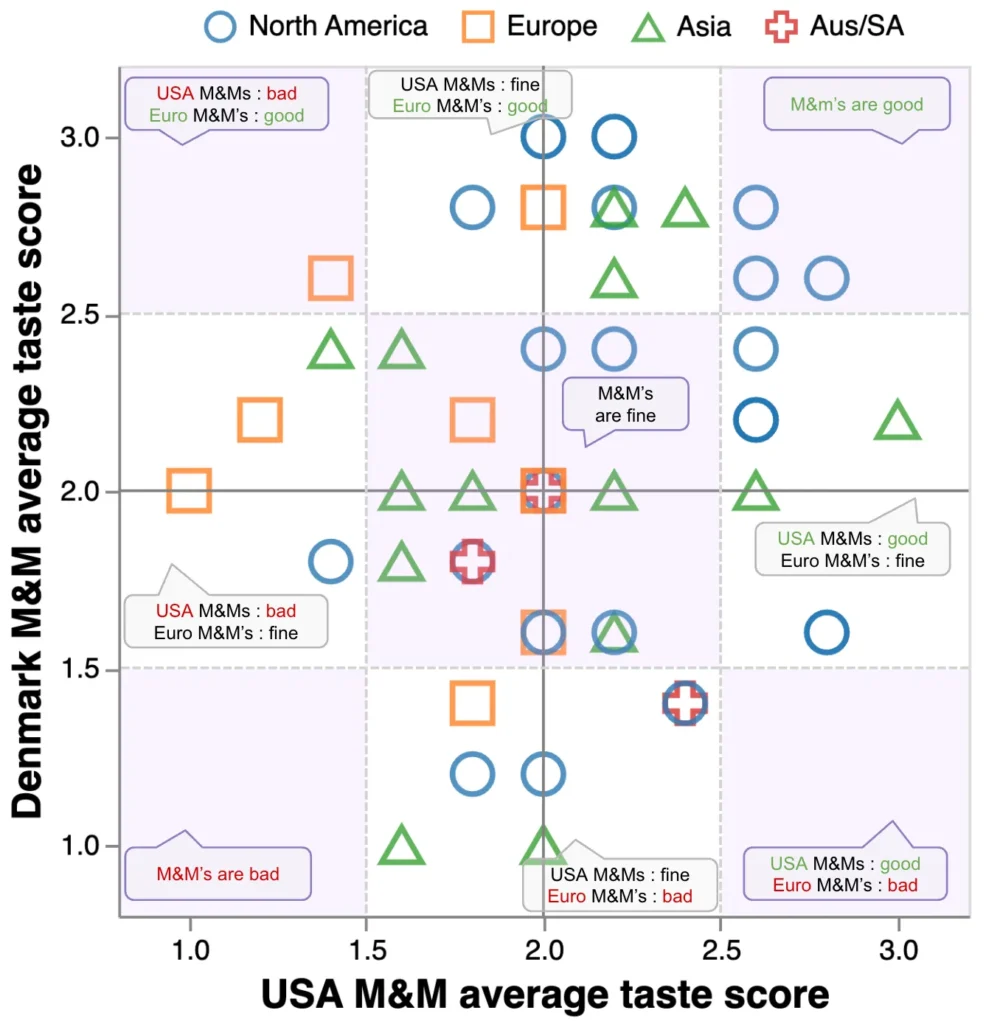
Notably, the upper right quadrant where both M&M types are perceived as “Good” to “Normal” is mostly occupied by North American participants and a few Asian participants. All European participants land in the left half of the figure where USA M&Ms are “Normal” to “Bad”, but Europeans are somewhat split between the upper and lower halves, where perceptions of Denmark M&Ms range from “Good” to “Bad.”

An interactive version of Figure 7 is provided below for the reader to explore the counts of various M&M alignment regions.

Figure 7 (interactive): click and brush your mouse over the scatter plot to see the counts of continents in different M&M enjoyment regions. Figure made with Altair.

3.4 Participant taste response ratio

Next, to factor out baseline M&M enjoyment and focus on participants’ relative preference between the two M&M types, we took the log ratio of each person’s USA M&M taste score average divided by their Denmark M&M taste score average.

Equation 1: Equation to calculate each participant’s overall M&M preference ratio.

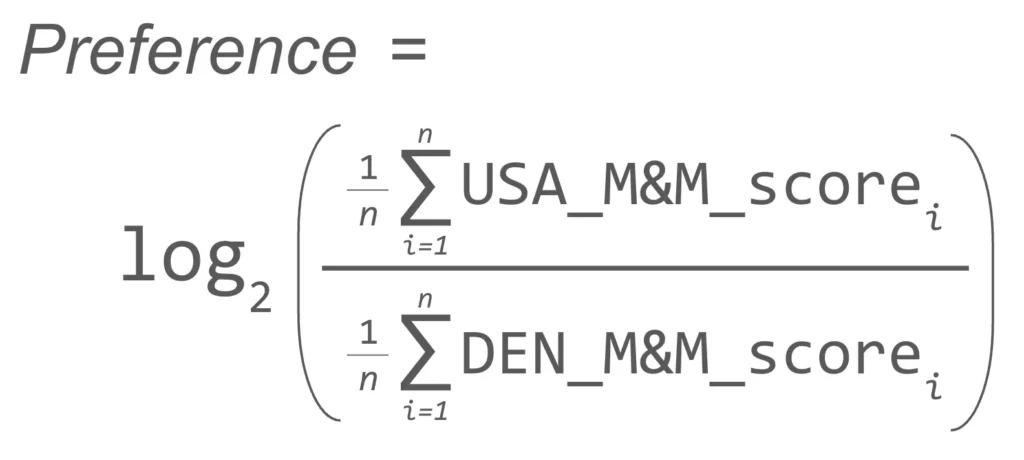
As such, positive scores indicate a preference towards USA M&Ms while negative scores indicate a preference towards Denmark M&Ms.

On average, European participants had the strongest preference towards Denmark M&Ms, with Asians also exhibiting a slight preference towards Denmark M&Ms (Figure 8). To the two Europeans who exhibited deflated pride upon learning their slight preference towards USA M&Ms, fear not: you did not think USA M&Ms were “Good,” but simply ranked them as less bad than Denmark M&Ms (see participant_id 4 and 17 in the interactive version of Figure 7). If you assert that M&Ms are a bad American invention not worth replicating and return to consuming artisanal European chocolate, your honor can likely be restored.

Figure 8. Distribution of participant M&M preference ratios by continent. Preference ratios are calculated as in Equation 1. Positive numbers indicate a relative preference for USA M&Ms, while negative indicate a relative preference for Denmark M&Ms. Figure made with Seaborn.

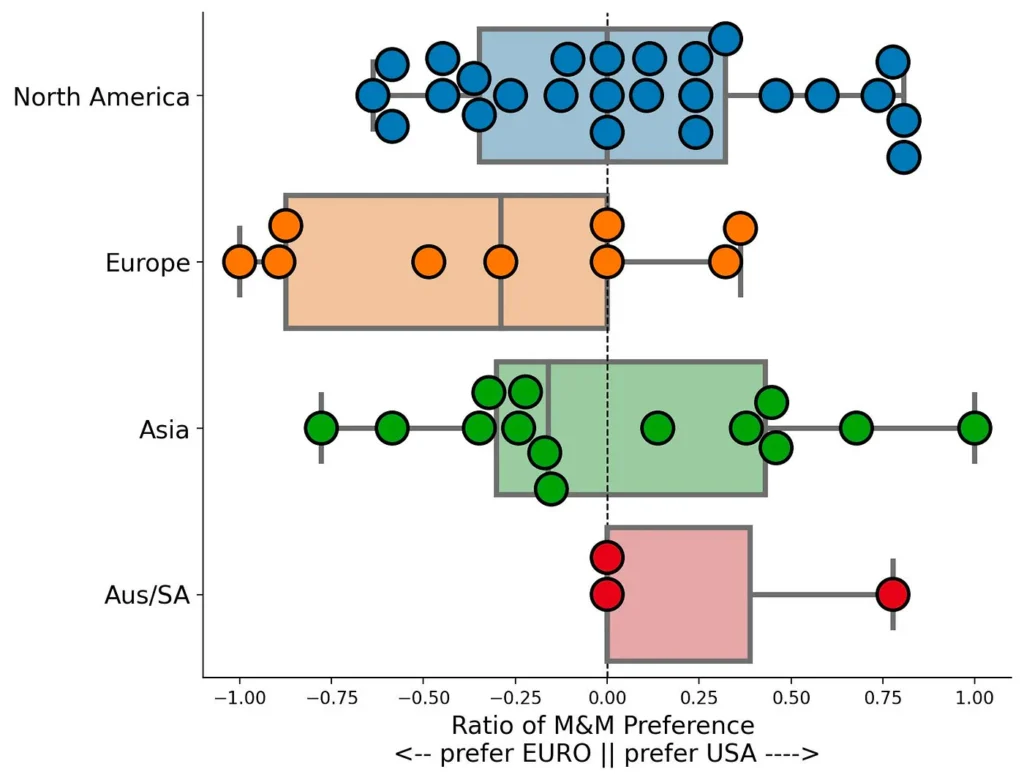
North American participants are pretty split in their preference ratios: some fall quite neutrally around 0, others strongly prefer the familiar USA M&M, while a handful moderately prefer Denmark M&Ms. Anecdotally, North Americans who learned their preference skewed towards European M&Ms displayed signals of inflated pride, as if their results signaled posh refinement.

Overall, a T-test comparing the distributions of M&M preference ratios shows a possibly significant difference in the means between European and North American participants (p = 0.049), but come on, this is like the 20th p-value I’ve reported — this one is probably too close to call.

3.5 Taste inconsistency and “Perfect Classifiers”

For each participant, we assessed their taste score consistency by averaging the standard deviations of their responses to each M&M type, and plotting that against their preference ratio (Figure 9).

Figure 9. Participant taste consistency by preference ratio. The x-axis is a participant’s relative M&M preference ratio. The y-axis is the average of the standard deviation of their USA M&M scores and the standard deviation of their Denmark M&M scores. A value of 0 on the y-axis indicates perfect consistency in responses, while higher values indicate more inconsistent responses. Figure made with Altair.

Most participants were somewhat inconsistent in their ratings, ranking the same M&M type differently across the 5 samples. This would be expected if the taste difference between European-sourced and American-sourced M&Ms is not actually all that perceptible. Most inconsistent were participants who gave the same M&M type “Good”, “Normal”, and “Bad” responses (e.g., points high on the y-axis, with wider standard deviations of taste scores), indicating lower taste perception abilities.

Intriguingly, four participants — one from each continent group — were perfectly consistent: they reported the same taste response for each of the 5 M&Ms from each M&M type, resulting in an average standard deviation of 0.0 (bottom of Figure 9). Excluding the one of the four who simply rated all 10 M&Ms as “Normal”, the other three appeared to be “Perfect Classifiers” — either rating all M&Ms of one type “Good” and the other “Normal”, or rating all M&Ms of one type “Normal” and the other “Bad.” Perhaps these folks are “super tasters.”

3.6 M&M color

Another possible explanation for the inconsistency in individual taste responses is that there exists a perceptible taste difference based on the M&M color. Visually, the USA M&Ms were noticeably more smooth and vibrant than the Denmark M&Ms, which were somewhat more “splotchy” in appearance (Figure 10A). M&M color was recorded during the experiment, and although balanced sampling was not formally built into the experimental design, colors seemed to be sampled roughly evenly, with the exception of Blue USA M&Ms, which were oversampled (Figure 10B).

Figure 10. M&M colors. A. Photo of each M&M color of each type. It’s perhaps a bit hard to perceive on screen in my unprofessionally lit photo, but with the naked eye, USA M&Ms seemed to be brighter and more uniformly colored while Denmark M&Ms have a duller and more mottled color. Is it just me, or can you already hear the Europeans saying “They are brighter because of all those extra chemicals you put in your food that we ban here!” B. Distribution of M&Ms of each color sampled over the course of the experiment. The Blue USA M&Ms were not intentionally oversampled — they must be especially bright/tempting to experimenters. Figure made with Altair.

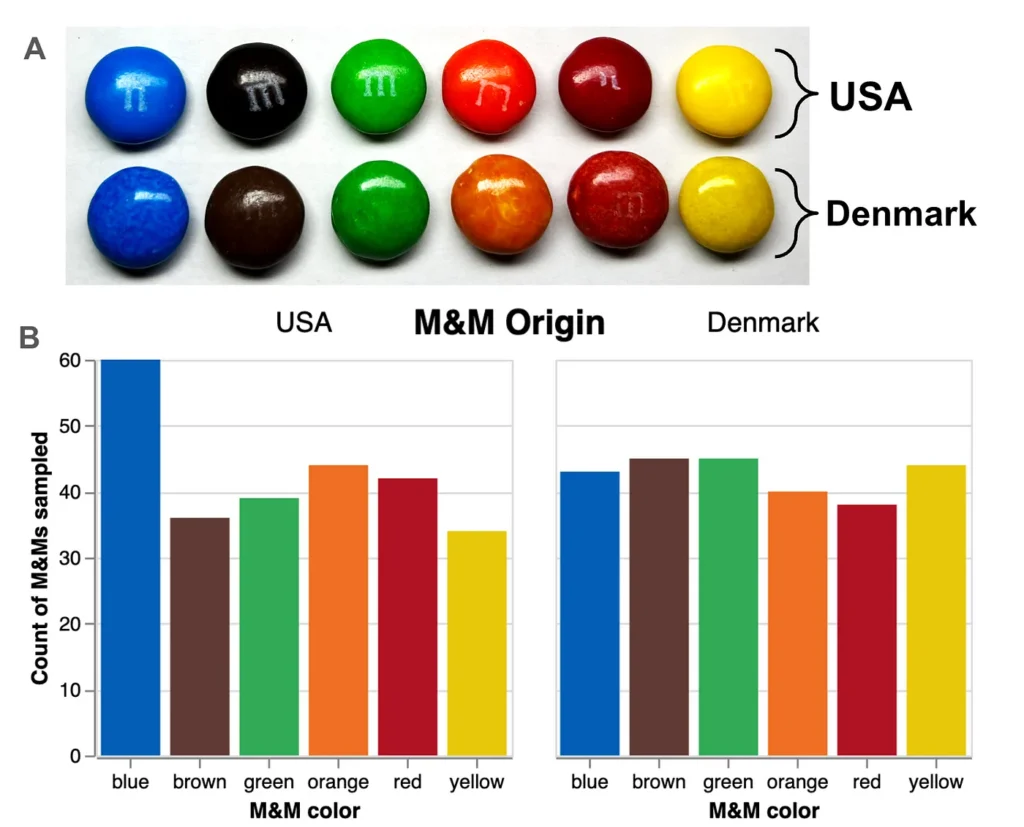
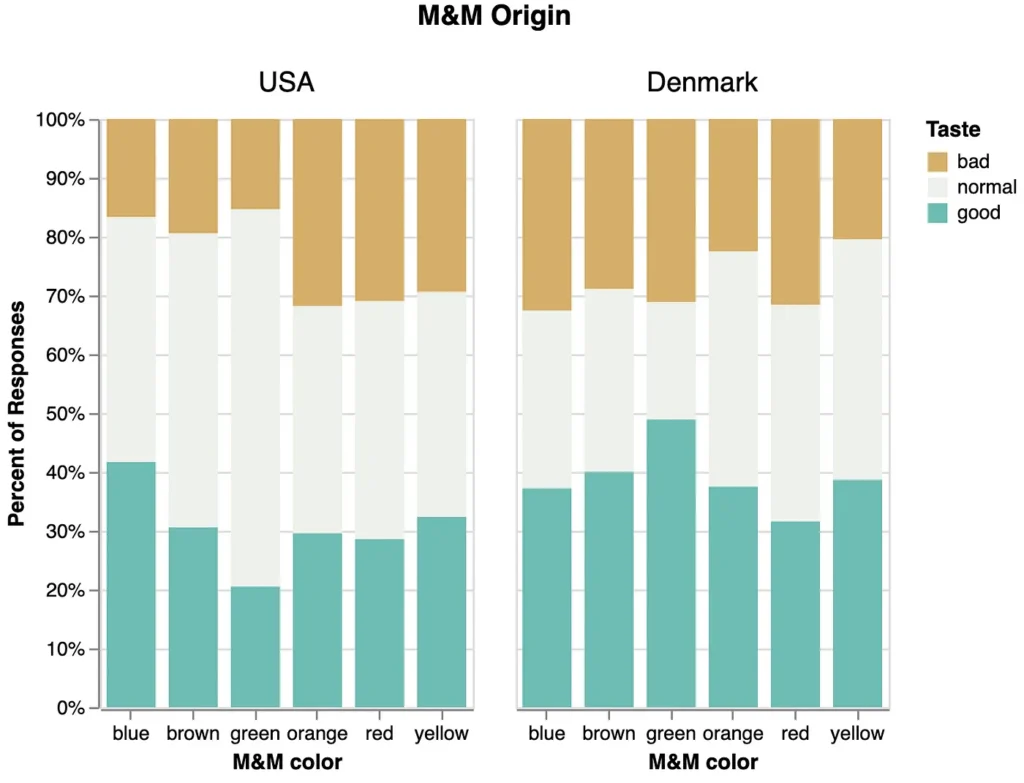
We briefly visualized possible differences in taste responses based on color (Figure 11), however we do not believe there are enough data to support firm conclusions. After all, on average each participant would likely only taste 5 of the 6 M&M colors once, and 1 color not at all. We leave further M&M color investigations to future work.

Figure 11. Taste response profiles for M&Ms of each color and type. Profiles are reported as percentages of “Bad”, “Normal”, and “Good” responses, though not all M&Ms were sampled exactly evenly. Figure made with Altair.

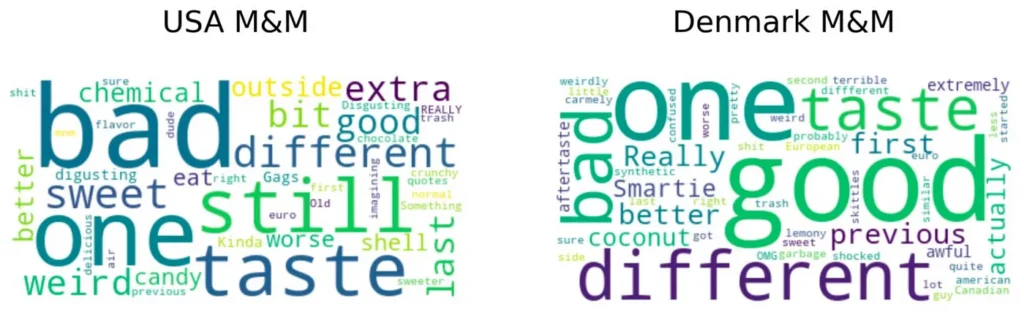
3.7 Colorful commentary

We assured each participant that there was no “right “answer” in this experiment and that all feelings are valid. While some participants took this to heart and occasionally spent over a minute deeply savoring each M&M and evaluating it as if they were a sommelier, many participants seemed to view the experiment as a competition (which occasionally led to deflated or inflated pride). Experimenters wrote down quotes and notes in conjunction with M&M responses, some of which were a bit “colorful.” We provide a hastily rendered word cloud for each M&M type for entertainment purposes (Figure 12) though we caution against reading too far into them without diligent sentiment analysis.

Figure 11. A simple word cloud generated from the notes column of each M&M type. Fair warning — these have not been properly analyzed for sentiment and some inappropriate language was recorded. Figure made with WordCloud.

4. Conclusion

Overall, there does not appear to be a “global consensus” that European M&Ms are better than American M&Ms. However, European participants tended to more strongly express negative reactions to USA M&Ms while North American participants seemed relatively split on whether they preferred M&Ms sourced from the USA vs from Europe. The preference trends of Asian participants often fell somewhere between the North Americans and Europeans.

Therefore, I’ll admit that it’s probable that Europeans are not engaged in a grand coordinated lie about M&Ms. The skew of most European participants towards Denmark M&Ms is compelling, especially since I was the experimenter who personally collected much of the taste response data. If they found a way to cheat, it was done well enough to exceed my own passive perception such that I didn’t notice. However, based on this study, it would appear that a strongly negative “vomit flavor” is not universally perceived and does not become apparent to non-Europeans when tasting both M&Ms types side by side.

We hope this study has been illuminating! We would look forward to extensions of this work with improved participant sampling, additional M&M types sourced from other continents, and deeper investigations into possible taste differences due to color.

Thank you to everyone who participated and ate M&Ms in the name of science!

Figures and analysis can be found on github: https://github.com/erinhwilson/mnm-taste-test

Article by Erin H. Wilson, Ph.D.[1,2,3] who decided the time between defending her dissertation and starting her next job would be best spent on this highly valuable analysis. Hopefully it is clear that this article is intended to be comedic— I do not actually harbor any negative feelings towards Europeans who don’t like American M&Ms, but enjoyed the chance to be sassy and poke fun at our lively debates with overly-enthusiastic data analysis.

Shout out to Matt, Galen, Ameya, and Gian-Marco for assisting in data collection!

[1] Former Ph.D. student in the Paul G. Allen School of Computer Science and Engineering at the University of Washington

[2] Former visiting Ph.D. student at the Novo Nordisk Foundation Center for Biosustainability at the Technical University of Denmark

[3] Future data scientist at LanzaTech

Shape
Shape
Stay Ahead

Explore More Insights

Stay ahead with more perspectives on cutting-edge power, infrastructure, energy,  bitcoin and AI solutions. Explore these articles to uncover strategies and insights shaping the future of industries.

Shape

Chinese cyberspies target VMware vSphere for long-term persistence

Designed to work in virtualized environments The CISA, NSA, and Canadian Cyber Center analysts note that some of the BRICKSTORM samples are virtualization-aware and they create a virtual socket (VSOCK) interface that enables inter-VM communication and data exfiltration. The malware also checks the environment upon execution to ensure it’s running

Read More »

IBM boosts DNS protection for multicloud operations

“In addition to this DNS synchronization, you can publish DNS configurations to your Amazon Simple Storage Service (S3) bucket. As you implement DNS changes, the S3 bucket will automatically update. The ability to store multiple configurations in your S3 bucket allows you to choose the most appropriate restore point if

Read More »

Cloudflare firewall reacts badly to React exploit mitigation

During the same window, Downdetector saw a spike in problem reports for enterprise services including Shopify, Zoom, Claude AI, and Amazon Web Services, and a host of consumer services from games to dating apps. Cloudflare explained the outage on its service status page: “A change made to how Cloudflare’s Web

Read More »

New Fortress Energy Seals Deal to Continue Supplying Gas to Puerto Rico

New Fortress Energy Inc (NFE) has received approval from local authorities to continue delivering natural gas for Puerto Rico’s power system for seven more years. The consent from the Financial Oversight and Management Board for Puerto Rico provides for the supply of about 75 trillion British thermal units (TBtu), New York City-based NFE said in an online statement. “Under the terms of the agreement, NFE will supply reliable, lower-emission natural gas to help enhance grid stability and support cleaner power generation across Puerto Rico’s energy system”, NFE said. According to NFE’s September 16 announcement about the agreed contract terms, the agreement involved “minimum annual take-or-pay volumes of 40 TBtu, increasing to up to 50 TBtu if certain conditions are met”. “This landmark agreement provides two critical benefits to the island. First, it establishes security of supply in San Juan for the next seven years for power plants currently running on LNG”, NFE chief executive Wes Edens said then. “Second, it provides for incremental LNG volumes to be delivered, allowing for the conversion of additional gas-ready plants currently burning diesel, resulting in hundreds of millions of dollars in energy savings for Puerto Ricans”. NFE said at the time, “Pricing of the volumes supplied through the GSA [Gas Supply Agreement] is set at a blend of 115 percent of Henry Hub plus $7.95/million Btu, excluding natural gas supplied to the units at San Juan 5 & 6 (which has historically consumed ~20 TBtu per year). Instead, these volumes are priced at 115 percent of Henry Hub plus $6.50/MMBtu”. According to the September statement, NFE expects to source the LNG under the new GSA from its Fast LNG facility in Altamira, Mexico. With a capacity of 1.4 million metric tons per annum, the project started operations in the fourth quarter of 2024, according to NFE. On March 17 NFE said it had amended the

Read More »

BGN Plans Global Gas Push Ahead of New Supplies

Energy trader BGN is set to expand its fledgling natural gas business into a global portfolio with stakes in plants, vessels and pipelines.  The push comes as the market for liquefied natural gas is set to boom, with US exports ramping up and Qatar, another major producer, also adding output. While that’s likely to push prices lower, the wave of extra supplies is poised to create new trading opportunities. The firm is in talks to buy LNG on contracts as long as 15 years, as well as equity in U.S. export plants, the company’s co-heads of LNG, Ruben Mosquera Arias and Maria Eugenia Suardiaz, said in an interview in Istanbul on Thursday. BGN got its start in the market for liquefied petroleum gas and has amassed a fleet of about 40 ships. In recent years, it has expanded rapidly into crude, oil products and metals.    “In LNG, we would like to be present globally as well, from the Atlantic basin to Asia Pacific,” said Suardiaz, declining to provide details on the volume they plan to handle.  Producers are set to add a record 300 billion cubic meters of annual export capacity by 2030, the International Energy Agency wrote last month in a report. That’s poised to reshape the market after years of scarcity. “We want to capture this wave,” said Mosquera Arias.  The company is also applying for licenses to buy capacity in European pipelines. It expects to take delivery of its first newbuild LNG carriers in the next two years, although the executives declined to provide more details.  BGN started its LNG team in 2024 and sold spot cargoes to both Egypt and Germany earlier this year. In the summer, it struck a deal to supply as many as 42 shipments to the North African country, where it’s already a major

Read More »

Crude Finishes Higher on Short Covering

Oil gained, finishing the week positive as investors assessed the murky outlook for a cease-fire in Ukraine and as the commodity pushed past an important technical level. West Texas Intermediate rose 0.7% to settle above $60 a barrel, signaling that a risk premium persists as a peace deal between Russia and Ukraine remains elusive. Ukrainian negotiators continued talks with US officials in Florida for a second day, with Russia objecting to some of the points in a US-backed plan. The market is watching for progress on a settlement that could lower prices by potentially easing sanctions and boosting Russian oil flows just as an expected oversupply in the market starts to materialize. But an agreement appears distant: Ukraine took credit for an overnight attack on Russia’s Syzran refinery and the Temryuk seaport. Meanwhile, Washington reportedly lobbied European countries in an effort to block a plan to use Moscow’s frozen assets to back a massive loan for Ukraine. Adding to bullish momentum, WTI on Friday settled above its 50-day moving average, a key level of support for the commodity. Prices have also received a boost from algorithmic traders covering some of their bearish positions in recent sessions — and analysts say more buying could materialize in coming weeks. “This session should mark the first notable short covering program since algo selling activity exhausted itself, and the bar is low for subsequent CTA buying activity to hit the tapes over the coming week,” said Dan Ghali, a commodity strategist at TD Securities. Countering geopolitical risks, oversupply is putting downward pressure on prices globally. Saudi Aramco will reduce the price of its flagship Arab Light crude grade to the lowest level since 2021 for January, while Canadian oil has tumbled. And the number of crude oil rigs in the US rose by 6

Read More »

ITT Agrees to Buy Lone Star’s SPX Flow in $4.8B Deal

ITT Inc. has agreed to acquire industrial equipment manufacturer SPX Flow Inc. from Lone Star Funds in a $4.775 billion cash and stock deal. The deal will will consist of a combination of cash and $700 million in ITT common stock issued to Lone Star, according to a statement confirming an earlier report by Bloomberg News that the companies were nearing a deal. Charlotte, North Carolina-based SPX Flow makes products including valves and pumps under brands such as APV and Johnson Pump, as well as food processing equipment such as its Gerstenberg Schröder-branded butter maker. Lone Star Funds agreed in 2021 to take SPX Flow private for $3.8 billion including debt.  The SPX Flow acquisition is the largest ever by Stamford, Connecticut-based ITT, according to data compiled by Bloomberg. ITT’s shares have gained 28% this year, giving it a market value of $14.3 billion. ITT’s history dates to 1920, with its genesis as International Telephone and Telegraph, a provider of telephone switching equipment and services, according to the company’s website. In 1995, that conglomerate was split into three divisions, including the company that became the current manufacturer of components and technology for a range of transportation, industrial and energy markets. WHAT DO YOU THINK? Generated by readers, the comments included herein do not reflect the views and opinions of Rigzone. All comments are subject to editorial review. Off-topic, inappropriate or insulting comments will be removed.

Read More »

Energy Department Launches Breakthrough AI-Driven Biotechnology Platform at PNNL

Richland, Wash.—U.S. Secretary of Energy Chris Wright launched a new chapter to secure American leadership in autonomous biological discovery yesterday alongside scientists and private partners at Pacific Northwest National Laboratory (PNNL). As part of his visit to PNNL, Secretary Wright commissioned and signed the Anaerobic Microbial Phenotyping Platform (AMP2). PNNL scientists believe AMP2 will be the world’s largest autonomous-capable science system for anaerobic microbial experimentation. The platform supports the Trump Administration’s recently announced Genesis Mission, which calls on the Department of Energy (DOE) to transform American leadership in science and innovation with the development of artificial intelligence (AI). Built by Gingko Bioworks, AMP2 gives DOE scientists an unprecedented capability to explore the world of microbes—an invisible yet powerful workforce poised to boost biotech manufacturing as well as provide insights into basic life science questions. This first-of-its-kind capability will transform how the U.S. identifies, grows, and optimizes the use of microbes in days and weeks instead of years using automation and AI.  “President Trump launched the Genesis Mission to ensure American leadership in science and innovation,” said Secretary Chris Wright. “This ongoing public-private partnership at PNNL will help do exactly that in the field of biotechnology. By launching AI-enabled, autonomous platforms like AMP2, our DOE National Laboratories are driving scientific breakthroughs faster than ever before and ensuring the United States leads the world in technologies that will better human lives and secure our future.”  The AMP2 platform will serve as a prototype for DOE’s planned development of the larger Microbial Molecular Phenotyping Capability (M2PC). Together, the systems will establish the world’s largest autonomous microbial research infrastructure, and position the U.S. to lead in biotechnology, biomanufacturing, and next-generation materials innovation for decades to come. Secretary Wright visited PNNL as part of his ongoing tour of all 17 DOE National Laboratories. PNNL marks

Read More »

Chevron, Gorgon Partners OK $2B to Drill for More Gas

Chevron Corp’s Australian unit and its joint venture partners have reached a final investment decision to further develop the massive Gorgon natural gas project in Western Australia, it said in a statement on Friday. Chevron Australia and its partners — including Exxon Mobil Corp. and Shell Plc — will spend A$3 billion ($2 billion) connecting two offshore natural gas fields to existing infrastructure and processing facilities on Barrow Island as part of the Gorgon Stage 3 development, it said in the statement. Six wells will also be drilled.  Gorgon, on the remote Barrow Island in northwestern Australia, is the largest resource development in Australia’s history, and produces about 15.6 million tons of liquefied natural gas a year. WHAT DO YOU THINK? Generated by readers, the comments included herein do not reflect the views and opinions of Rigzone. All comments are subject to editorial review. Off-topic, inappropriate or insulting comments will be removed.

Read More »

At the Crossroads of AI and the Edge: Inside 1623 Farnam’s Rising Role as a Midwest Interconnection Powerhouse

That was the thread that carried through our recent conversation for the DCF Show podcast, where Severn walked through the role Farnam now plays in AI-driven networking, multi-cloud connectivity, and the resurgence of regional interconnection as a core part of U.S. digital infrastructure. Aggregation, Not Proximity: The Practical Edge Severn is clear-eyed about what makes the edge work and what doesn’t. The idea that real content delivery could aggregate at the base of cell towers, he noted, has never been realistic. The traffic simply isn’t there. Content goes where the network already concentrates, and the network concentrates where carriers, broadband providers, cloud onramps, and CDNs have amassed critical mass. In Farnam’s case, that density has grown steadily since the building changed hands in 2018. At the time an “underappreciated asset,” the facility has since become a meeting point for more than 40 broadband providers and over 60 carriers, with major content operators and hyperscale platforms routing traffic directly through its MMRs. That aggregation effect feeds on itself; as more carrier and content traffic converges, more participants anchor themselves to the hub, increasing its gravitational pull. Geography only reinforces that position. Located on the 41st parallel, the building sits at the historical shortest-distance path for early transcontinental fiber routes. It also lies at the crossroads of major east–west and north–south paths that have made Omaha a natural meeting point for backhaul routes and hyperscale expansions across the Midwest. AI and the New Interconnection Economy Perhaps the clearest sign of Farnam’s changing role is the sheer volume of fiber entering the building. More than 5,000 new strands are being brought into the property, with another 5,000 strands being added internally within the Meet-Me Rooms in 2025 alone. These are not incremental upgrades—they are hyperscale-grade expansions driven by the demands of AI traffic,

Read More »

Schneider Electric’s $2.3 Billion in AI Power and Cooling Deals Sends Message to Data Center Sector

When Schneider Electric emerged from its 2025 North American Innovation Summit in Las Vegas last week with nearly $2.3 billion in fresh U.S. data center commitments, it didn’t just notch a big sales win. It arguably put a stake in the ground about who controls the AI power-and-cooling stack over the rest of this decade. Within a single news cycle, Schneider announced: Together, the deals total about $2.27 billion in U.S. data center infrastructure, a number Schneider confirmed in background with multiple outlets and which Reuters highlighted as a bellwether for AI-driven demand.  For the AI data center ecosystem, these contracts function like early-stage fuel supply deals for the power and cooling systems that underpin the “AI factory.” Supply Capacity Agreements: Locking in the AI Supply Chain Significantly, both deals are structured as supply capacity agreements, not traditional one-off equipment purchase orders. Under the SCA model, Schneider is committing dedicated manufacturing lines and inventory to these customers, guaranteeing output of power and cooling systems over a multi-year horizon. In return, Switch and Digital Realty are providing Schneider with forecastable volume and visibility at the scale of gigawatt-class campus build-outs.  A Schneider spokesperson told Reuters that the two contracts are phased across 2025 and 2026, underscoring that this arrangement is about pipeline, as opposed to a one-time backlog spike.  That structure does three important things for the market: Signals confidence that AI demand is durable.You don’t ring-fence billions of dollars of factory output for two customers unless you’re highly confident the AI load curve runs beyond the current GPU cycle. Pre-allocates power & cooling the way the industry pre-allocated GPUs.Hyperscalers and neoclouds have already spent two years locking up Nvidia and AMD capacity. These SCAs suggest power trains and thermal systems are joining chips on the list of constrained strategic resources.

Read More »

The Data Center Power Squeeze: Mapping the Real Limits of AI-Scale Growth

As we all know, the data center industry is at a crossroads. As artificial intelligence reshapes the already insatiable digital landscape, the demand for computing power is surging at a pace that outstrips the growth of the US electric grid. As engines of the AI economy, an estimated 1,000 new data centers1 are needed to process, store, and analyze the vast datasets that run everything from generative models to autonomous systems. But this transformation comes with a steep price and the new defining criteria for real estate: power. Our appetite for electricity is now the single greatest constraint on our expansion, threatening to stall the very innovation we enable. In 2024, US data centers consumed roughly 4% of the nation’s total electricity, a figure that is projected to triple by 2030, reaching 12% or more.2 For AI-driven hyperscale facilities, the numbers are even more staggering. With the largest planned data centers requiring gigawatts of power, enough to supply entire cities, the cumulative demand from all data centers is expected to reach 134 gigawatts by 2030, nearly three times the current load.​3 This presents a systemic challenge. The U.S. power grid, built for a different era, is struggling to keep pace. Utilities are reporting record interconnection requests, with some regions seeing demand projections that exceed their total system capacity by fivefold.4 In Virginia and Texas, the epicenters of data center expansion, grid operators are warning of tight supply-demand balances and the risk of blackouts during peak periods.5 The problem is not just the sheer volume of power needed, but the speed at which it must be delivered. Data center operators are racing to secure power for projects that could be online in as little as 18 months, but grid upgrades and new generation can take years, if not decades. The result

Read More »

The Future of Hyperscale: Neoverse Joins NVLink Fusion as SC25 Accelerates Rack-Scale AI Architectures

Neoverse’s Expanding Footprint and the Power-Efficiency Imperative With Neoverse deployments now approaching roughly 50% of all compute shipped into top hyperscalers in 2025 (representing more than a billion Arm cores) and with nation-scale AI campuses such as the Stargate project already anchored on Arm compute, the addition of NVLink Fusion becomes a pivotal extension of the Neoverse roadmap. Partners can now connect custom Arm CPUs to their preferred NVIDIA accelerators across a coherent, high-bandwidth, rack-scale fabric. Arm characterized the shift as a generational inflection point in data-center architecture, noting that “power—not FLOPs—is the bottleneck,” and that future design priorities hinge on maximizing “intelligence per watt.” Ian Buck, vice president and general manager of accelerated computing at NVIDIA, underscored the practical impact: “Folks building their own Arm CPU, or using an Arm IP, can actually have access to NVLink Fusion—be able to connect that Arm CPU to an NVIDIA GPU or to the rest of the NVLink ecosystem—and that’s happening at the racks and scale-up infrastructure.” Despite the expanded design flexibility, this is not being positioned as an open interconnect ecosystem. NVIDIA continues to control the NVLink Fusion fabric, and all connections ultimately run through NVIDIA’s architecture. For data-center planners, the SC25 announcement translates into several concrete implications: 1.   NVIDIA “Grace-style” Racks Without Buying Grace With NVLink Fusion now baked into Neoverse, hyperscalers and sovereign operators can design their own Arm-based control-plane or pre-processing CPUs that attach coherently to NVIDIA GPU domains—such as NVL72 racks or HGX B200/B300 systems—without relying on Grace CPUs. A rack-level architecture might now resemble: Custom Neoverse SoC for ingest, orchestration, agent logic, and pre/post-processing NVLink Fusion fabric Blackwell GPU islands and/or NVLink-attached custom accelerators (Marvell, MediaTek, others) This decouples CPU choice from NVIDIA’s GPU roadmap while retaining the full NVLink fabric. In practice, it also opens

Read More »

Flex’s Integrated Data Center Bet: How a Manufacturing Giant Plans to Reshape AI-Scale Infrastructure

At this year’s OCP Global Summit, Flex made a declaration that resonated across the industry: the era of slow, bespoke data center construction is over. AI isn’t just stressing the grid or forcing new cooling techniques—it’s overwhelming the entire design-build process. To meet this moment, Flex introduced a globally manufactured, fully integrated data center platform aimed directly at multi-gigawatt AI campuses. The company claims it can cut deployment timelines by as much as 30 percent by shifting integration upstream into the factory and unifying power, cooling, compute, and lifecycle services into pre-engineered modules. This is not a repositioning on the margins. Flex is effectively asserting that the future hyperscale data center will be manufactured like a complex industrial system, not built like a construction project. On the latest episode of The Data Center Frontier Show, we spoke with Rob Campbell, President of Flex Communications, Enterprise & Cloud, and Chris Butler, President of Flex Power, about why Flex believes this new approach is not only viable but necessary in the age of AI. The discussion revealed a company leaning heavily on its global manufacturing footprint, its cross-industry experience, and its expanding cooling and power technology stack to redefine what deployment speed and integration can look like at scale. AI Has Broken the Old Data Center Model From the outset, Campbell and Butler made clear that Flex’s strategy is a response to a structural shift. AI workloads no longer allow power, cooling, and compute to evolve independently. Densities have jumped so quickly—and thermals have risen so sharply—that the white space, gray space, and power yard are now interdependent engineering challenges. Higher chip TDPs, liquid-cooled racks approaching one to two megawatts, and the need to assemble entire campuses in record time have revealed deep fragility in traditional workflows. As Butler put it, AI

Read More »

Data Center Jobs: Engineering, Construction, Commissioning, Sales, Field Service and Facility Tech Jobs Available in Major Data Center Hotspots

Each month Data Center Frontier, in partnership with Pkaza, posts some of the hottest data center career opportunities in the market. Here’s a look at some of the latest data center jobs posted on the Data Center Frontier jobs board, powered by Pkaza Critical Facilities Recruiting. Looking for Data Center Candidates? Check out Pkaza’s Active Candidate / Featured Candidate Hotlist Data Center Facility Technician (All Shifts Available) Impact, TX This position is also available in: Ashburn, VA; Abilene, TX; Needham, MA and New York, NY. Navy Nuke / Military Vets leaving service accepted!  This opportunity is working with a leading mission-critical data center provider. This firm provides data center solutions custom-fit to the requirements of their client’s mission-critical operational facilities. They provide reliability of mission-critical facilities for many of the world’s largest organizations facilities supporting enterprise clients, colo providers and hyperscale companies. This opportunity provides a career-growth minded role with exciting projects with leading-edge technology and innovation as well as competitive salaries and benefits. Electrical Commissioning Engineer Montvale, NJ This traveling position is also available in: New York, NY; White Plains, NY;  Richmond, VA; Ashburn, VA; Charlotte, NC; Atlanta, GA; Hampton, GA; Fayetteville, GA; New Albany, OH; Cedar Rapids, IA; Phoenix, AZ; Salt Lake City, UT; Dallas, TX or Chicago, IL. *** ALSO looking for a LEAD EE and ME CxA Agents and CxA PMs. *** Our client is an engineering design and commissioning company that has a national footprint and specializes in MEP critical facilities design. They provide design, commissioning, consulting and management expertise in the critical facilities space. They have a mindset to provide reliability, energy efficiency, sustainable design and LEED expertise when providing these consulting services for enterprise, colocation and hyperscale companies. This career-growth minded opportunity offers exciting projects with leading-edge technology and innovation as well as competitive salaries and

Read More »

Microsoft will invest $80B in AI data centers in fiscal 2025

And Microsoft isn’t the only one that is ramping up its investments into AI-enabled data centers. Rival cloud service providers are all investing in either upgrading or opening new data centers to capture a larger chunk of business from developers and users of large language models (LLMs).  In a report published in October 2024, Bloomberg Intelligence estimated that demand for generative AI would push Microsoft, AWS, Google, Oracle, Meta, and Apple would between them devote $200 billion to capex in 2025, up from $110 billion in 2023. Microsoft is one of the biggest spenders, followed closely by Google and AWS, Bloomberg Intelligence said. Its estimate of Microsoft’s capital spending on AI, at $62.4 billion for calendar 2025, is lower than Smith’s claim that the company will invest $80 billion in the fiscal year to June 30, 2025. Both figures, though, are way higher than Microsoft’s 2020 capital expenditure of “just” $17.6 billion. The majority of the increased spending is tied to cloud services and the expansion of AI infrastructure needed to provide compute capacity for OpenAI workloads. Separately, last October Amazon CEO Andy Jassy said his company planned total capex spend of $75 billion in 2024 and even more in 2025, with much of it going to AWS, its cloud computing division.

Read More »

John Deere unveils more autonomous farm machines to address skill labor shortage

Join our daily and weekly newsletters for the latest updates and exclusive content on industry-leading AI coverage. Learn More Self-driving tractors might be the path to self-driving cars. John Deere has revealed a new line of autonomous machines and tech across agriculture, construction and commercial landscaping. The Moline, Illinois-based John Deere has been in business for 187 years, yet it’s been a regular as a non-tech company showing off technology at the big tech trade show in Las Vegas and is back at CES 2025 with more autonomous tractors and other vehicles. This is not something we usually cover, but John Deere has a lot of data that is interesting in the big picture of tech. The message from the company is that there aren’t enough skilled farm laborers to do the work that its customers need. It’s been a challenge for most of the last two decades, said Jahmy Hindman, CTO at John Deere, in a briefing. Much of the tech will come this fall and after that. He noted that the average farmer in the U.S. is over 58 and works 12 to 18 hours a day to grow food for us. And he said the American Farm Bureau Federation estimates there are roughly 2.4 million farm jobs that need to be filled annually; and the agricultural work force continues to shrink. (This is my hint to the anti-immigration crowd). John Deere’s autonomous 9RX Tractor. Farmers can oversee it using an app. While each of these industries experiences their own set of challenges, a commonality across all is skilled labor availability. In construction, about 80% percent of contractors struggle to find skilled labor. And in commercial landscaping, 86% of landscaping business owners can’t find labor to fill open positions, he said. “They have to figure out how to do

Read More »

2025 playbook for enterprise AI success, from agents to evals

Join our daily and weekly newsletters for the latest updates and exclusive content on industry-leading AI coverage. Learn More 2025 is poised to be a pivotal year for enterprise AI. The past year has seen rapid innovation, and this year will see the same. This has made it more critical than ever to revisit your AI strategy to stay competitive and create value for your customers. From scaling AI agents to optimizing costs, here are the five critical areas enterprises should prioritize for their AI strategy this year. 1. Agents: the next generation of automation AI agents are no longer theoretical. In 2025, they’re indispensable tools for enterprises looking to streamline operations and enhance customer interactions. Unlike traditional software, agents powered by large language models (LLMs) can make nuanced decisions, navigate complex multi-step tasks, and integrate seamlessly with tools and APIs. At the start of 2024, agents were not ready for prime time, making frustrating mistakes like hallucinating URLs. They started getting better as frontier large language models themselves improved. “Let me put it this way,” said Sam Witteveen, cofounder of Red Dragon, a company that develops agents for companies, and that recently reviewed the 48 agents it built last year. “Interestingly, the ones that we built at the start of the year, a lot of those worked way better at the end of the year just because the models got better.” Witteveen shared this in the video podcast we filmed to discuss these five big trends in detail. Models are getting better and hallucinating less, and they’re also being trained to do agentic tasks. Another feature that the model providers are researching is a way to use the LLM as a judge, and as models get cheaper (something we’ll cover below), companies can use three or more models to

Read More »

OpenAI’s red teaming innovations define new essentials for security leaders in the AI era

Join our daily and weekly newsletters for the latest updates and exclusive content on industry-leading AI coverage. Learn More OpenAI has taken a more aggressive approach to red teaming than its AI competitors, demonstrating its security teams’ advanced capabilities in two areas: multi-step reinforcement and external red teaming. OpenAI recently released two papers that set a new competitive standard for improving the quality, reliability and safety of AI models in these two techniques and more. The first paper, “OpenAI’s Approach to External Red Teaming for AI Models and Systems,” reports that specialized teams outside the company have proven effective in uncovering vulnerabilities that might otherwise have made it into a released model because in-house testing techniques may have missed them. In the second paper, “Diverse and Effective Red Teaming with Auto-Generated Rewards and Multi-Step Reinforcement Learning,” OpenAI introduces an automated framework that relies on iterative reinforcement learning to generate a broad spectrum of novel, wide-ranging attacks. Going all-in on red teaming pays practical, competitive dividends It’s encouraging to see competitive intensity in red teaming growing among AI companies. When Anthropic released its AI red team guidelines in June of last year, it joined AI providers including Google, Microsoft, Nvidia, OpenAI, and even the U.S.’s National Institute of Standards and Technology (NIST), which all had released red teaming frameworks. Investing heavily in red teaming yields tangible benefits for security leaders in any organization. OpenAI’s paper on external red teaming provides a detailed analysis of how the company strives to create specialized external teams that include cybersecurity and subject matter experts. The goal is to see if knowledgeable external teams can defeat models’ security perimeters and find gaps in their security, biases and controls that prompt-based testing couldn’t find. What makes OpenAI’s recent papers noteworthy is how well they define using human-in-the-middle

Read More »