Stay Ahead, Stay ONMINE

How To Generate GIFs from 3D Models with Python

As a data scientist, you know that effectively communicating your insights is as important as the insights themselves. But how do you communicate over 3D data? I can bet most of us have been there: you spend days, weeks, maybe even months meticulously collecting and processing 3D data. Then comes the moment to share your […]

As a data scientist, you know that effectively communicating your insights is as important as the insights themselves.

But how do you communicate over 3D data?

I can bet most of us have been there: you spend days, weeks, maybe even months meticulously collecting and processing 3D data. Then comes the moment to share your findings, whether it’s with clients, colleagues, or the broader scientific community. You throw together a few static screenshots, but they just don’t capture the essence of your work. The subtle details, the spatial relationships, the sheer scale of the data—it all gets lost in translation.

Comparing 3D Data Communication Methods. © F. Poux

Or maybe you’ve tried using specialized 3D visualization software. But when your client uses it, they struggle with clunky interfaces, steep learning curves, and restrictive licensing.

What should be a smooth, intuitive process becomes a frustrating exercise in technical acrobatics. It’s an all-too-common scenario: the brilliance of your 3D data is trapped behind a wall of technical barriers.

This highlights a common issue: the need to create shareable content that can be opened by anyone, i.e., that does not demand specific 3D data science skills.

Think about it: what is the most used way to share visual information? Images.

But how can we convey the 3D information from a simple 2D image?

Well, let us use “first principle thinking”: let us create shareable content stacking multiple 2D views, such as GIFs or MP4s, from raw point clouds.

The bread of magic to generate GIF and MP4The bread of magic to generate GIF and MP4. © F. Poux

This process is critical for presentations, reports, and general communication. But generating GIFs and MP4s from 3D data can be complex and time-consuming. I’ve often found myself wrestling with the challenge of quickly generating rotating GIF or MP4 files from a 3D point cloud, a task that seemed simple enough but often spiraled into a time-consuming ordeal. 

Current workflows might lack efficiency and ease of use, and a streamlined process can save time and improve data presentation.

Let me share a solution that involves leveraging Python and specific libraries to automate the creation of GIFs and MP4s from point clouds (or any 3D dataset such as a mesh or a CAD model).

Think about it. You’ve spent hours meticulously collecting and processing this 3D data. Now, you need to present it in a compelling way for a presentation or a report. But how can we be sure it can be integrated into a SaaS solution where it is triggered on upload? You try to create a dynamic visualization to showcase a critical feature or insight, and yet you’re stuck manually capturing frames and stitching them together. How can we automate this process to seamlessly integrate it into your existing systems?
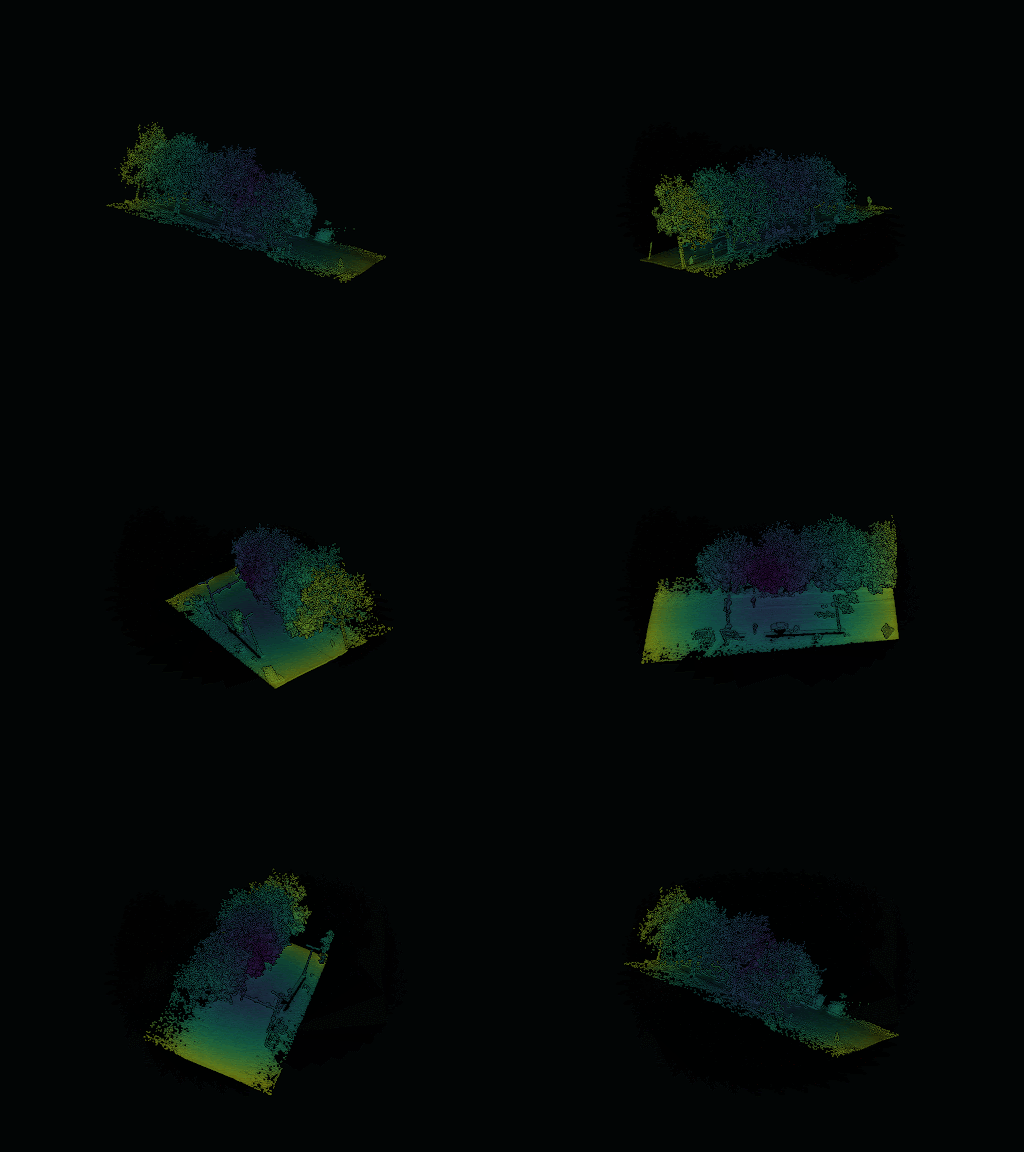
An example of a GIF generated with the methodology. © F. Poux

If you are new to my (3D) writing world, welcome! We are going on an exciting adventure that will allow you to master an essential 3D Python skill. Before diving, I like to establish a clear scenario, the mission brief.

Once the scene is laid out, we embark on the Python journey. Everything is given. You will see Tips (🦚Notes and 🌱Growing) to help you get the most out of this article. Thanks to the 3D Geodata Academy for supporting the endeavor.

The Mission 🎯

You are working for a new engineering firm, “Geospatial Dynamics,” which wants to showcase its cutting-edge LiDAR scanning services. Instead of sending clients static point cloud images, you propose to use a new tool, which is a Python script, to generate dynamic rotating GIFs of project sites.

After doing so market research, you found that this can immediately elevate their proposals, resulting in a 20% higher project approval rate. That’s the power of visual storytelling.

The three stages of the mission towards an increase project approval. © F. Poux

On top, you can even imagine a more compelling scenario, where “GeoSpatial Dynamics” is able to process point clouds massively and then generate MP4 videos that are sent to potential clients. This way, you lower the churn and make the brand more memorable.

With that in mind, we can start designing a robust framework to answer our mission’s goal.

The Framework

I remember a project where I had to show a detailed architectural scan to a group of investors. The usual still images just could not capture the fine details. I desperately needed a way to create a rotating GIF to convey the full scope of the design. That is why I’m excited to introduce this Cloud2Gif Python solution. With this, you’ll be able to easily generate shareable visualizations for presentations, reports, and communication.

The framework I propose is straightforward yet effective. It takes raw 3D data, processes it using Python and the PyVista library, generates a series of frames, and stitches them together to create a GIF or MP4 video. The high-level workflow includes:

The various stages of the framework in this article. © F. Poux

1. Loading the 3D data (mesh with texture).

2. Loading a 3D Point Cloud

3. Setting up the visualization environment.

4. Generating a GIF

 4.1. Defining a camera orbit path around the data.

 4.2. Rendering frames from different viewpoints along the path.

 4.3. Encoding the frames into a GIF or

5. Generating an orbital MP4

6. Creating a Function

7. Testing with multiple datasets

This streamlined process allows for easy customization and integration into existing workflows. The key advantage here is the simplicity of the approach. By leveraging the basic principles of 3D data rendering, a very efficient and self-contained script can be put together and deployed on any system as long as Python is installed.

This makes it compatible with various edge computing solutions and allows for easy integration with sensor-heavy systems. The goal is to generate a GIF and an MP4 from a 3D data set. The process is simple, requiring a 3D data set, a bit of magic (the code), and the output as GIF and MP4 files.

The growth of the solution as we move along the major stages. © F. Poux

Now, what are the tools and libraries that we will need for this endeavor?

1. Setup Guide: The Libraries, Tools and Data

© F. Poux

For this project, we primarily use the following two Python libraries:

  • NumPy: The cornerstone of numerical computing in Python. Without it, I would have to deal with every vertex (point) in a very inefficient way. NumPy Official Website
  • pyvista: A high-level interface to the Visualization Toolkit (VTK). PyVista enables me to easily visualize and interact with 3D data. It handles rendering, camera control, and exporting frames. PyVista Official Website
PyVista and Numpy libraries for 3D Data. © F. Poux

These libraries provide all the necessary tools to handle data processing, visualization, and output generation. This set of libraries was carefully chosen so that a minimal amount of external dependencies is present, which improves sustainability and makes it easily deployable on any system.

Let me share the details of the environment as well as the data preparation setup.

Quick Environment Setup Guide

Let me provide very brief details on how to set up your environment.

Step 1: Install Miniconda

Four simple steps to get a working Miniconda version:

How to install Anaconda for 3D Coding. © F. Poux

Step 2: Create a new environment

You can run the following code in your terminal

conda create -n pyvista_env python=3.10
conda activate pyvista_env

Step 3: Install required packages

For this, you can leverage pip as follows:

pip install numpy
pip install pyvista

Step 4: Test the installation

If you want to test your installation, type python in your terminal and run the following lines:

import numpy as np
import pyvista as pv
print(f”PyVista version: {pv.__version__}”)

This should return the pyvista version. Do not forget to exit Python from your terminal afterward (Ctrl+C).

🦚 Note: Here are some common issues and workarounds:

  • If PyVista doesn’t show a 3D window: pip install vtk
  • If environment activation fails: Restart the terminal
  • If data loading fails: Check file format compatibility (PLY, LAS, LAZ supported)

Beautiful, at this stage, your environment is ready. Now, let me share some quick ways to get your hands on 3D datasets.

Data Preparation for 3D Visualization

At the end of the article, I share with you the datasets as well as the code. However, in order to ensure you are fully independent, here are three reliable sources I regularly use to get my hands on point cloud data:

The LiDAR Data Download Process. © F. Poux

The USGS 3DEP LiDAR Point Cloud Downloads

OpenTopography

ETH Zurich’s PCD Repository

For quick testing, you can also use PyVista’s built-in example data:

# Load sample data
from pyvista import examples
terrain = examples.download_crater_topo()
terrain.plot()

🦚 Note: Remember to always check the data license and attribution requirements when using public datasets.

Finally, to ensure a complete setup, below is a typical expected folder structure:

project_folder/
├── environment.yml
├── data/
│ └── pointcloud.ply
└── scripts/
└── gifmaker.py

Beautiful, we can now jump right onto the first stage: loading and visualizing textured mesh data.

2. Loading and Visualizing Textured Mesh Data

One first critical step is properly loading and rendering 3D data. In my research laboratory, I have found that PyVista provides an excellent foundation for handling complex 3D visualization tasks. 

© F. Poux

Here’s how you can approach this fundamental step:

import numpy as np
import pyvista as pv

mesh = pv.examples.load_globe()
texture = pv.examples.load_globe_texture()

pl = pv.Plotter()
pl.add_mesh(mesh, texture=texture, smooth_shading=True)
pl.show()

This code snippet loads a textured globe mesh, but the principles apply to any textured 3D model.

The earth rendered as a sphere with PyVista. © F. Poux

Let me discuss and speak a bit about the smooth_shading parameter. It’s a tiny element that renders the surfaces more continuous (as opposed to faceted), which, in the case of spherical objects, improves the visual impact.

Now, this is just a starter for 3D mesh data. This means that we deal with surfaces that join points together. But what if we want to work solely with point-based representations? 

In that scenario, we have to consider shifting our data processing approach to propose solutions to the unique visual challenges attached to point cloud datasets.

3. Point Cloud Data Integration

Point cloud visualization demands extra attention to detail. In particular, adjusting the point density and the way we represent points on the screen has a noticeable impact. 

© F. Poux

Let us use a PLY file for testing (see the end of the article for resources). 

The example PLY point cloud data with PyVista. © F. Poux

You can load a point cloud pv.read and create scalar fields for better visualization (such as using a scalar field based on the height or extent around the center of the point cloud).

In my work with LiDAR datasets, I’ve developed a simple, systematic approach to point cloud loading and initial visualization:

cloud = pv.read('street_sample.ply')
scalars = np.linalg.norm(cloud.points - cloud.center, axis=1)

pl = pv.Plotter()
pl.add_mesh(cloud)
pl.show()

The scalar computation here is particularly important. By calculating the distance from each point to the cloud’s center, we create a basis for color-coding that helps convey depth and structure in our visualizations. This becomes especially valuable when dealing with large-scale point clouds where spatial relationships might not be immediately apparent.

Moving from basic visualization to creating engaging animations requires careful consideration of the visualization environment. Let’s explore how to optimize these settings for the best possible results.

4. Optimizing the Visualization Environment

The visual impact of our animations heavily depends on the visualization environment settings. 

© F. Poux

Through extensive testing, I’ve identified key parameters that consistently produce professional-quality results:

pl = pv.Plotter(off_screen=False)
pl.add_mesh(
   cloud,
   style='points',
   render_points_as_spheres=True,
   emissive=False,
   color='#fff7c2',
   scalars=scalars,
   opacity=1,
   point_size=8.0,
   show_scalar_bar=False
   )

pl.add_text('test', color='b')
pl.background_color = 'k'
pl.enable_eye_dome_lighting()
pl.show()

As you can see, the plotter is initialized off_screen=False to render directly to the screen. The point cloud is then added to the plotter with specified styling. The style=’points’ parameter ensures that the point cloud is rendered as individual points. The scalars=’scalars’ argument uses the previously computed scalar field for coloring, while point_size sets the size of the points, and opacity adjusts the transparency. A base color is also set.

🦚 Note: In my experience, rendering points as spheres significantly improves the depth perception in the final generated animation. You can also combine this by using the eye_dome_lighting feature. This algorithm adds another layer of depth cues through some sort of normal-based shading, which makes the structure of point clouds more apparent.

You can play around with the various parameters until you obtain a rendering that is satisfying for your applications. Then, I propose that we move to creating the animated GIFs.

A GIF of the point cloudA GIF of the point cloud. © F. Poux

5. Creating Animated GIFs

At this stage, our aim is to generate a series of renderings by varying the viewpoint from which we generate these. 

© F. Poux

This means that we need to design a camera path that is sound, from which we can generate frame rendering. 

This means that to generate our GIF, we must first create an orbiting path for the camera around the point cloud. Then, we can sample the path at regular intervals and capture frames from different viewpoints. 

These frames can then be used to create the GIF. Here are the steps:

The 4 stages in the animated gifs generation. © F. Poux
  1. I change to off-screen rendering
  2. I take the cloud length parameters to set the camera
  3. I create a path
  4. I create a loop that takes a point of this pass

Which translates into the following:

pl = pv.Plotter(off_screen=True, image_scale=2)
pl.add_mesh(
   cloud,
   style='points',
   render_points_as_spheres=True,
   emissive=False,
   color='#fff7c2',
   scalars=scalars,
   opacity=1,
   point_size=5.0,
   show_scalar_bar=False
   )

pl.background_color = 'k'
pl.enable_eye_dome_lighting()
pl.show(auto_close=False)

viewup = [0, 0, 1]

path = pl.generate_orbital_path(n_points=40, shift=cloud.length, viewup=viewup, factor=3.0)
pl.open_gif("orbit_cloud_2.gif")
pl.orbit_on_path(path, write_frames=True, viewup=viewup)
pl.close()

As you can see, an orbital path is created around the point cloud using pl.generate_orbital_path(). The path’s radius is determined by cloud_length, the center is set to the center of the point cloud, and the normal vector is set to [0, 0, 1], indicating that the circle lies in the XY plane.

From there, we can enter a loop to generate individual frames for the GIF (the camera’s focal point is set to the center of the point cloud).

The image_scale parameter deserves special attention—it determines the resolution of our output. 

I’ve found that a value of 2 provides a good balance between the perceived quality and the file size. Also, the viewup vector is crucial for maintaining proper orientation throughout the animation. You can experiment with its value if you want a rotation following a non-horizontal plane.

This results in a GIF that you can use to communicate very easily. 

Another synthetic point cloud generated GIFAnother synthetic point cloud generated GIF. © F. Poux

But we can push one extra stage: creating an MP4 video. This can be useful if you want to obtain higher-quality animations with smaller file sizes as compared to GIFs (which are not as compressed).

6. High-Quality MP4 Video Generation

The generation of an MP4 video follows the exact same principles as we used to generate our GIF. 

© F. Poux

Therefore, let me get straight to the point. To generate an MP4 file from any point cloud, we can reason in four stages:

© F. Poux
  • Gather your configurations over the parameters that best suit you.
  • Create an orbital path the same way you did with GIFs
  • Instead of using the open_gif function, let us use it open_movie to write a “movie” type file.
  • We orbit on the path and write the frames, similarly to our GIF method.

🦚 Note: Don’t forget to use your proper configuration in the definition of the path.

This is what the end result looks like with code:

pl = pv.Plotter(off_screen=True, image_scale=1)
pl.add_mesh(
   cloud,
   style='points_gaussian',
   render_points_as_spheres=True,
   emissive=True,
   color='#fff7c2',
   scalars=scalars,
   opacity=0.15,
   point_size=5.0,
   show_scalar_bar=False
   )

pl.background_color = 'k'
pl.show(auto_close=False)

viewup = [0.2, 0.2, 1]

path = pl.generate_orbital_path(n_points=40, shift=cloud.length, viewup=viewup, factor=3.0)
pl.open_movie("orbit_cloud.mp4")
pl.orbit_on_path(path, write_frames=True)
pl.close()

Notice the use of points_gaussian style and adjusted opacity—these settings provide interesting visual quality in video format, particularly for dense point clouds.

And now, what about streamlining the process?

7. Streamlining the Process with a Custom Function

© F. Poux

To make this process more efficient and reproducible, I’ve developed a function that encapsulates all these steps:

def cloudgify(input_path):
   cloud = pv.read(input_path)
   scalars = np.linalg.norm(cloud.points - cloud.center, axis=1)
   pl = pv.Plotter(off_screen=True, image_scale=1)
   pl.add_mesh(
       cloud,
       style='Points',
       render_points_as_spheres=True,
       emissive=False,
       color='#fff7c2',
       scalars=scalars,
       opacity=0.65,
       point_size=5.0,
       show_scalar_bar=False
       )

   pl.background_color = 'k'
   pl.enable_eye_dome_lighting()
   pl.show(auto_close=False)

   viewup = [0, 0, 1]

   path = pl.generate_orbital_path(n_points=40, shift=cloud.length, viewup=viewup, factor=3.0)
  
   pl.open_gif(input_path.split('.')[0]+'.gif')
   pl.orbit_on_path(path, write_frames=True, viewup=viewup)
   pl.close()
  
   path = pl.generate_orbital_path(n_points=100, shift=cloud.length, viewup=viewup, factor=3.0)
   pl.open_movie(input_path.split('.')[0]+'.mp4')
   pl.orbit_on_path(path, write_frames=True)
   pl.close()
  
   return

🦚 Note: This function standardizes our visualization process while maintaining flexibility through its parameters. It incorporates several optimizations I’ve developed through extensive testing. Note the different n_points values for GIF (40) and MP4 (100)—this balances file size and smoothness appropriately for each format. The automatic filename generation split(‘.’)[0] ensures consistent output naming.

And what better than to test our new creation on multiple datasets?

8. Batch Processing Multiple Datasets

© F. Poux

Finally, we can apply our function to multiple datasets:

dataset_paths= ["lixel_indoor.ply", "NAAVIS_EXTERIOR.ply", "pcd_synthetic.ply", "the_adas_lidar.ply"]

for pcd in dataset_paths:
   cloudgify(pcd)

This approach can be remarkably efficient when processing large datasets made of several files. Indeed, if your parametrization is sound, you can maintain consistent 3D visualization across all outputs.

🌱 Growing: I am a big fan of 0% supervision to create 100% automatic systems. This means that if you want to push the experiments even more, I suggest investigating ways to automatically infer the parameters based on the data, i.e., data-driven heuristics. Here is an example of a paper I wrote a couple of years down the line that focuses on such an approach for unsupervised segmentation (Automation in Construction, 2022)

A Little Discussion 

Alright, you know my tendency to push innovation. While relatively simple, this Cloud2Gif solution has direct applications that can help you propose better experiences. Three of them come to mind, which I leverage on a weekly basis:

© F. Poux
  • Interactive Data Profiling and Exploration: By generating GIFs of complex simulation results, I can profile my results at scale very quickly. Indeed, the qualitative analysis is thus a matter of slicing a sheet filled with metadata and GIFs to check if the results are on par with my metrics. This is very handy
  • Educational Materials: I often use this script to generate engaging visuals for my online courses and tutorials, enhancing the learning experience for the professionals and students that go through it. This is especially true now that most material is found online, where we can leverage the capacity of browsers to play animations.
  • Real-time Monitoring Systems: I worked on integrating this script into a real-time monitoring system to generate visual alerts based on sensor data. This is especially relevant for sensor-heavy systems, where it can be difficult to extract meaning from the point cloud representation manually. Especially when conceiving 3D Capture Systems, leveraging SLAM or other techniques, it can be helpful to get a feedback loop in real-time to ensure a cohesive registration.

However, when we consider the broader research landscape and the pressing needs of the 3D data community, the real value proposition of this approach becomes evident. Scientific research is increasingly interdisciplinary, and communication is key. We need tools that enable researchers from diverse backgrounds to understand and share complex 3D data easily.

The Cloud2Gif script is self-contained and requires minimal external dependencies. This makes it ideally suited for deployment on resource-constrained edge devices. And this may be the top application that I worked on, leveraging such a straightforward approach.

As a little digression, I saw the positive impact of the script in two scenarios. First, I designed an environmental monitoring system for diseases in farmland crops. This was a 3D project, and I could include the generation of visual alerts (with an MP4 file) based on the real-time LiDAR sensor data. A great project!

In another context, I wanted to provide visual feedback to on-site technicians using a SLAM-equipped system for mapping purposes. I integrated the process to generate a GIF every 30 seconds that showed the current state of data registration. It was a great way to ensure consistent data capture. This actually allowed us to reconstruct complex environments with better consistency in managing our data drift.

Conclusion

Today, I walked through a simple yet powerful Python script to transform 3D data into dynamic GIFs and MP4 videos. This script, combined with libraries like NumPy and PyVista, allows us to create engaging visuals for various applications, from presentations to research and educational materials.

The key here is accessibility: the script is easily deployable and customizable, providing an immediate way of transforming complex data into an accessible format. This Cloud2Gif script is an excellent piece for your application if you need to share, assess, or get quick visual feedback within data acquisition situations.

What is next?

Well, if you feel up for a challenge, you can create a simple web application that allows users to upload point clouds, trigger the video generation process, and download the resulting GIF or MP4 file. 

This, in a similar manner as shown here:

In addition to Flask, you can also create a simple web application that can be deployed on Amazon Web Services so that it is scalable and easily accessible to anyone, with minimal maintenance.

These are skills that you develop through the Segmentor OS Program at the 3D Geodata Academy.

About the author

Florent Poux, Ph.D. is a Scientific and Course Director focused on educating engineers on leveraging AI and 3D Data Science. He leads research teams and teaches 3D Computer Vision at various universities. His current aim is to ensure humans are correctly equipped with the knowledge and skills to tackle 3D challenges for impactful innovations.

Resources

  1. 🏆Awards: Jack Dangermond Award
  2. 📕Book: 3D Data Science with Python
  3. 📜Research: 3D Smart Point Cloud (Thesis)
  4. 🎓Courses: 3D Geodata Academy Catalog
  5. 💻Code: Florent’s Github Repository
  6. 💌3D Tech Digest: Weekly Newsletter
Shape
Shape
Stay Ahead

Explore More Insights

Stay ahead with more perspectives on cutting-edge power, infrastructure, energy,  bitcoin and AI solutions. Explore these articles to uncover strategies and insights shaping the future of industries.

Shape

Fortinet speeds threat detection with improved FortiAnalyzer

The package also now integrates with FortiAI, the vendor’s genAI assistant, to better support analytics and telemetry to help security teams speed threat investigation and response, the vendor stated. “FortiAI identifies the threats that need analysis from the data collected by FortiAnalyzer, primarily collected from FortiGates. By automating the collection,

Read More »

Incoming Devon CEO steps back acquisition activity to focus on value ‘underfoot’

After that transaction is finalized in about 5 weeks, Devon will hold about 46,000 acres with a more than 95% working interest and oversee drilling and completion of wells there, something BPX had been handling under the JV’s terms. Having that control, executives said, is set to save Devon more than $2 million per well. “We’ve already got our hands on the wheel. We’re seeing that improvement come through and we feel very, very confident in being able to achieve” the cost savings, Gaspar said. “In addition to that, the amount of control that we’ll have—our ability to dial up [or] dial down activity as we need to—I  think is a huge value creator as well.” Fourth-quarter numbers, outlook Devon reported a fourth-quarter profit of $639 million on revenues of a little more than $4.4 billion. Those numbers were down from $1.15 billion and up from $4.15 billion, respectively, in the last 3 months of 2023. Higher marketing and midstream costs as well as great depreciation, depletion, and amortization hurt income year over year. Devon’s total production in the fourth quarter came in at 848,000 boe/d, which included 117,000 boe/d from the acquired Grayson Mill assets. Oil production was a record 398,000 b/d, with 63,000 b/d coming from Grayson Mill. During the quarter, the company averaged 24 operated rigs and six completion crews and placed online 128 gross operated wells. Looking to 2025, Devon expects total production of 805,000-825,000 boe/d, a drop of nearly 4% from the fourth quarter, but 2% higher than executives’ forecast of 3 months ago. Capital spending, which was $3.65 billion in 2024, is expected between $3.8 billion to $4.0 billion, which is $200 million lower than leaders’ preliminary forecast. Of the $3.65 billion allocated to upstream capex, $2.0 billion is earmarked for the Delaware basin

Read More »

UK Proffers More Cash to Support Grangemouth Refinery Transition

The UK has increased potential financial support for the transition of the Grangemouth oil refinery in Scotland to a low-carbon future. The government will make an additional £200 million ($253 million) available for Grangemouth — where oil-refining operations are to halt this year — according to a statement. The private sector will have to commit its own funds to projects in order to unlock the support, it said. With production of fuels like diesel and gasoline to cease, there has been speculation that the Grangemouth site could be used to make what’s known as sustainable aviation fuel. Airlines must use 2% of the fuel, mostly made from used cooking oil and vegetable oils, from this year and the UK has a target to have five production plants under construction by 2025. The funding announced Sunday by Prime Minister Keir Starmer is in addition to already committed support. A previously announced initiative dubbed Project Willow, which is tasked with identifying commercially viable opportunities for the site, is to report in the spring, according to the government statement.  Ineos, which operates the Grangemouth oil refinery, is to retain chemicals operations at the site.  WHAT DO YOU THINK? Generated by readers, the comments included herein do not reflect the views and opinions of Rigzone. All comments are subject to editorial review. Off-topic, inappropriate or insulting comments will be removed. MORE FROM THIS AUTHOR Bloomberg

Read More »

Oil Edges Up Amid Uncertainty

Oil edged higher in a largely aimless session amid a slew of geopolitical uncertainties, including Russia-Ukraine peace talks and a possible increase in Iraqi crude production. West Texas Intermediate rose to $70.70 after changing direction multiple times throughout the day. Iraq may restart exports as early as this week should a pipeline to Turkey resume operations, Iraqi Oil Minister Hayyan Abdul Ghani said Monday. Markets could see as much as an additional 185,000 barrels a day, but the ministry said exports will remain within OPEC limits. Crude wandered in a roughly $5 range for February after spiking above $80 a barrel at the beginning of the year. Prices have slid from those highs amid persistent expectations of lackluster Chinese demand, the potential for additional barrels on the market and the prospect that multiple tariff actions will weigh on global growth. Markets are keeping a close eye on negotiations to end the three-year war in Ukraine. A settlement with Russia may pave the way for sanctions to be eased, potentially shifting export flows. Ukrainian President Volodymyr Zelenskiy said he would be ready to step down in order to guarantee peace in his country as Trump has called for Ukraine to hold elections. Meanwhile, OPEC and its allies are expected to again delay plans to revive production as the market faces a potential surplus. More than 70% of traders and analysts surveyed anticipate that the group will postpone the first in a series of monthly increases scheduled for April. At the same time, there have been flickers of strength in some parts of the market, with the Brent-Dubai exchange for swaps, a measure of the relative value of European and Middle Eastern crude, at its lowest since June. That indicates refiners are still eager to get their hands on the kind of

Read More »

National Grid sells US renewables arm in £1.4bn deal

National Grid (LON:NG) has agreed to sell its US onshore renewables business to Brookfield Asset Management in a deal valuing the division at $1.74 billion (£1.37 billion). The deal is expected to complete by the end of September. The FTSE 100-listed energy infrastructure group, which runs much of Britain’s electricity grid, is selling off parts of its portfolio to help fund investment plans. National Grid said: “This transaction is another important step in delivering National Grid’s previously communicated strategy to focus on networks and streamline our business, as announced in May 2024.” The group said in December that it would invest £35 billion in its electricity-transmission business over the five years to March 2031 under aims to almost double the amount of energy that can be transported around the UK. It comes as part of a wider spending plan to invest about £60 billion in networks before the end of the decade, with more than £30 billion of that going to England, Scotland and Wales. As well as its move to offload National Grid Renewables in the US, the transmission giant is also selling its UK liquid natural gas asset, Grain LNG. National Grid Renewables develops, constructs, owns and runs solar, onshore wind farms and battery storage assets in the US. Recommended for you National Grid scores SF6 UK-first at London Power Tunnels project

Read More »

Why is the USA Natural Gas Price Dropping Today?

The price of U.S. natural gas is likely being driven by a combination of both technical and fundamental drivers. That’s what Art Hogan, Chief Market Strategist at B. Riley Wealth, told Rigzone in an exclusive interview on Monday when asked why the U.S. natural gas price is dropping today. “On the fundamental side, according to AccuWeather reports, most locations this upcoming week will observe high temperatures between 10-15 degrees Fahrenheit above the historical average for late February,” Hogan said. “Technically, the movements of the natural gas futures confirm this bearish pressure as the upside seems to be capped at last week’s high at $4.476, followed by a sharp sell-off that resulted in a weekly close at $4.234 after testing the week’s low at $3.554,” he added. When asked the same question in a separate exclusive interview on Monday, Phil Flynn, a senior market analyst at the PRICE Futures Group, said, “despite the fact that we saw a major drop in natural gas inventories and the fact that we’re further below the five year average than we have been probably in almost in two years, the hope of spring is giving the market a bit of a sell off – despite the strong technical breakout of last week”. “The warmer temperatures are raising hopes that winter is coming to an end, and the demand will start to ease off and production will rise,” he added. In the interview, Flynn went on to tell Rigzone that “the key for this market will be what happens in March after the warm-up”. “There are still some forecasters that are calling for a return to arctic-like temperatures into March, and if that does happen it’s going to create an interesting dynamic for this market and the ‘flip side’ that the ability of U.S. natural gas

Read More »

Trump pauses implementation of new DOE appliance efficiency standards

The U.S. Department of Energy will postpone the implementation of several appliance energy efficiency standards finalized by the Biden administration, the agency said Feb. 14. The natural gas sector hailed the decision as a win for consumer choice while efficiency advocates warn the decision could add billions to utility bills. DOE in December estimated that the stronger appliance standards would save consumers about $1 trillion and cut emissions by 2.5 billion metric tons over three decades. But Trump’s policies favor less regulation, and the Project 2025 platform created by the Heritage Foundation and shaped by numerous previous and current Trump administration officials, called for eliminating appliance standards completely. “A top priority for President Trump is lowering costs for American families,” Energy Secretary Chris Wright said in a statement. “Today’s announcement will foster consumer choice and lower prices … the people, not the government, should be choosing the home appliances and products they want at prices they can afford.” Under Biden, the DOE’s appliance efficiency program boosted the standards for more than two dozen product classes, though the implementation of those standards for some appliances are still years away. DOE’s decision this month postpones implementation of new standards for central air conditioners, clothes washers and dryers, general service lamps, walk-in coolers and freezers, gas instantaneous water heaters, commercial refrigeration equipment, and air compressors. The Energy Policy and Conservation Act says DOE must review appliance efficiency standards every six years. DOE also said it will create a new energy efficiency category for natural gas tankless water heaters, exempting them from “onerous rules.” Under Biden, the agency in December published a final rule that opponents said would essentially ban some types of water heaters. The National Association of Home Builders said it “strongly supports congressional resolutions introduced in both chambers of Congress that seek to block the Biden administration’s recent attempt

Read More »

Quantum Computing Advancements Leap Forward In Evolving Data Center and AI Landscape

Overcoming the Barriers to Quantum Adoption Despite the promise of quantum computing, widespread deployment faces multiple hurdles: High Capital Costs: Quantum computing infrastructure requires substantial investment, with uncertain return-on-investment models. The partnership will explore cost-sharing strategies to mitigate risk. Undefined Revenue Models: Business frameworks for quantum services, including pricing structures and access models, remain in development. Hardware Limitations: Current quantum processors still struggle with error rates and scalability, requiring advancements in error correction and hybrid computing approaches. Software Maturity: Effective algorithms for leveraging quantum computing’s advantages remain an active area of research, particularly in real-world AI and optimization problems. SoftBank’s strategy includes leveraging its extensive telecom infrastructure and AI expertise to create real-world testing environments for quantum applications. By integrating quantum into existing data center operations, SoftBank aims to position itself at the forefront of the quantum-AI revolution. A Broader Play in Advanced Computing SoftBank’s quantum initiative follows a series of high-profile moves into the next generation of computing infrastructure. The company has been investing heavily in AI data centers, aligning with its “Beyond Carrier” strategy that expands its focus beyond telecommunications. Recent efforts include the development of large-scale AI models tailored to Japan and the enhancement of radio access networks (AI-RAN) through AI-driven optimizations. Internationally, SoftBank has explored data center expansion opportunities beyond Japan, as part of its efforts to support AI, cloud computing, and now quantum applications. The company’s long-term vision suggests that quantum data centers could eventually play a role in supporting AI-driven workloads at scale, offering performance benefits that classical supercomputers cannot achieve. The Road Ahead SoftBank and Quantinuum’s collaboration signals growing momentum for quantum computing in enterprise settings. While quantum remains a long-term bet, integrating QPUs into data center infrastructure represents a forward-looking approach that could redefine high-performance computing in the years to come. With

Read More »

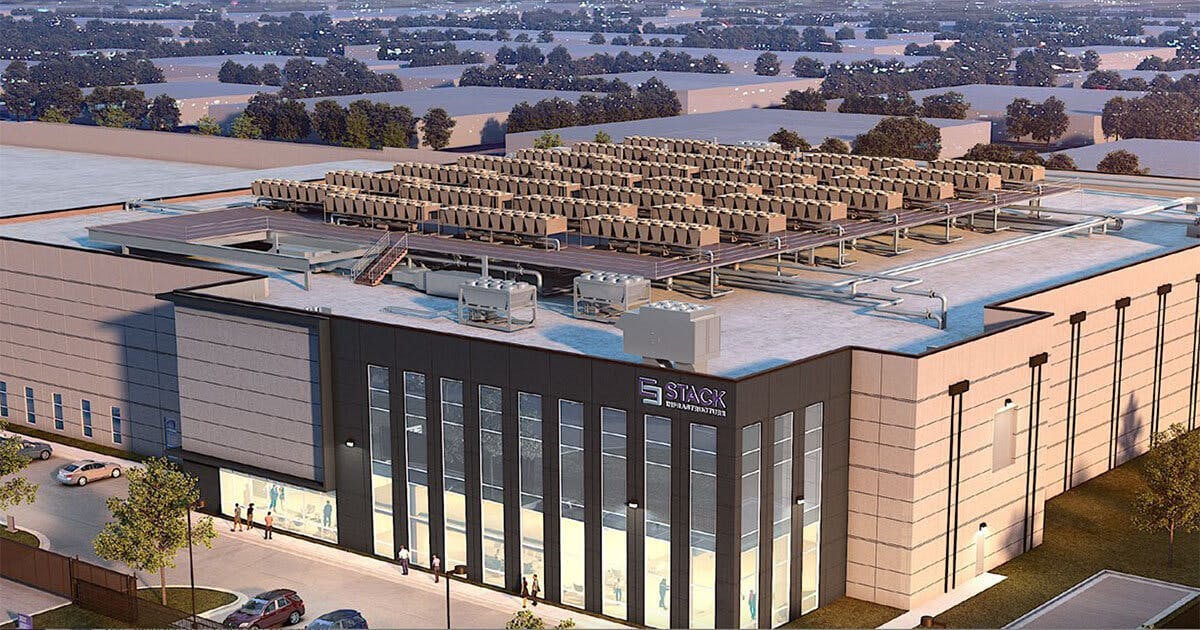
STACK Infrastructure Pushes Aggressive Data Center Expansion and Sustainability Strategy Into 2025

Global data center developer and operator STACK Infrastructure is providing a growing range of digital infrastructure solutions for hyperscalers, cloud service providers, and enterprise clients. Like almost all of the cutting-edge developers in the industry, Stack is maintaining the focus on scalability, reliability, and sustainability while delivering a full range of solutions, including build-to-suit, colocation, and powered shell facilities, with continued development in key global markets. Headquartered in the United States, the company has expanded its presence across North America, Europe, and Asia-Pacific, catering to the increasing demand for high-performance computing, artificial intelligence (AI), and cloud-based workloads. The company is known for its commitment to sustainable growth, leveraging green financing initiatives, energy-efficient designs, and renewable power sources to minimize its environmental impact. Through rapid expansion in technology hubs like Silicon Valley, Northern Virginia, Malaysia, and Loudoun County, the company continues to develop industry benchmarks for innovation and infrastructure resilience. With a customer-centric approach and a robust development pipeline, STACK Infrastructure is shaping the future of digital connectivity and data management in an era of accelerating digital transformation. Significant Developments Across 23 Major Data Center Markets Early in 2024, Stack broke ground on the expansion of their existing 100 MW campus in San Jose, servicing the power constrained Silicon Valley. Stack worked with the city of San Jose to add a 60 MW expansion to their SVY01 data center. While possibly the highest profile of Stack’s developments, due to its location, at that point in time the company had announced significant developments across 23 major data center markets, including:       Stack’s 48 MW Santa Clara data center, featuring immediately available shell space powered by an onsite substation with rare, contracted capacity. Stack’s 56 MW Toronto campus, spanning 19 acres, includes an existing 8 MW data center and 48 MW expansion capacity,

Read More »

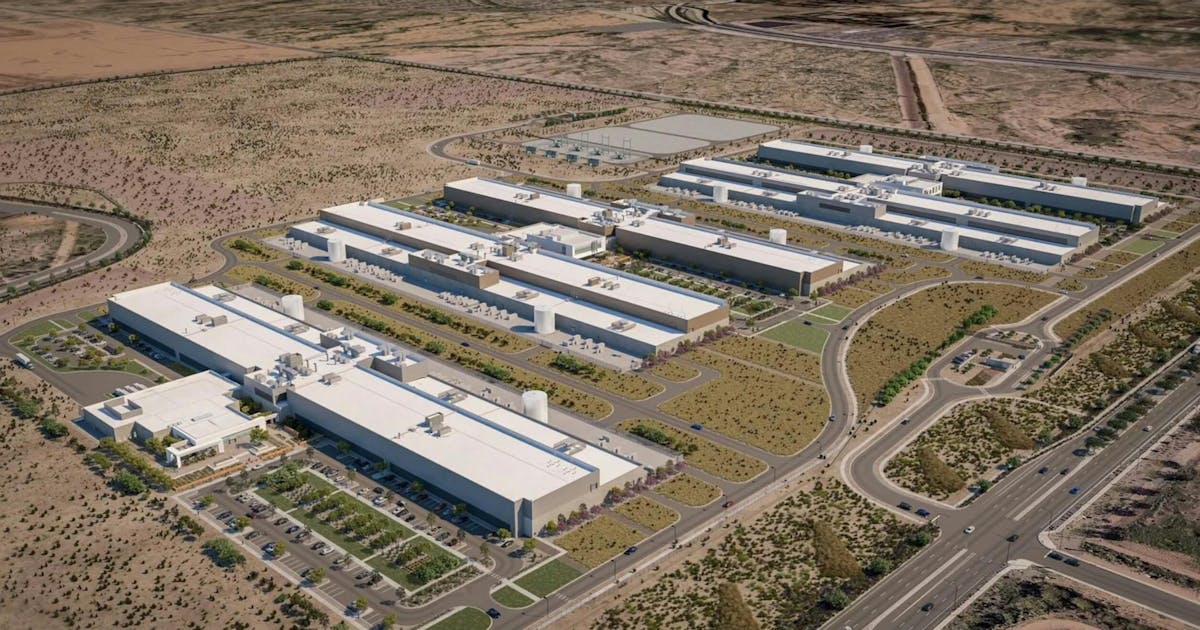
Meta Update: Opens Mesa, Arizona Data Center; Unveils Major Subsea Cable Initiative; Forges Oklahoma Wind Farm PPA; More

Meta’s Project Waterworth: Building the Global Backbone for AI-Powered Digital Infrastructure Also very recently, Meta unveiled its most ambitious subsea cable initiative yet: Project Waterworth. Aimed at revolutionizing global digital connectivity, the project will span over 50,000 kilometers—surpassing the Earth’s circumference—and connect five major continents. When completed, it will be the world’s longest subsea cable system, featuring the highest-capacity technology available today. A Strategic Expansion to Key Global Markets As announced on Feb. 14, Project Waterworth is designed to enhance connectivity across critical regions, including the United States, India, Brazil, and South Africa. These regions are increasingly pivotal to global digital growth, and the new subsea infrastructure will fuel economic cooperation, promote digital inclusion, and unlock opportunities for technological advancement. In India, for instance, where rapid digital infrastructure growth is already underway, the project will accelerate progress and support the country’s ambitions for an expanded digital economy. This enhanced connectivity will foster regional integration and bolster the foundation for next-generation applications, including AI-driven services. Strengthening Global Digital Highways Subsea cables are the unsung heroes of global digital infrastructure, facilitating over 95% of intercontinental data traffic. With a multi-billion-dollar investment, Meta aims to open three new oceanic corridors that will deliver the high-speed, high-capacity bandwidth needed to fuel innovations like artificial intelligence. Meta’s experience in subsea infrastructure is extensive. Over the past decade, the company has collaborated with various partners to develop more than 20 subsea cables, including systems boasting up to 24 fiber pairs—far exceeding the typical 8 to 16 fiber pairs found in most new deployments. This technological edge ensures scalability and reliability, essential for handling the world’s ever-increasing data demands. Engineering Innovations for Resilience and Capacity Project Waterworth isn’t just about scale—it’s about resilience and cutting-edge engineering. The system will be the longest 24-fiber-pair subsea cable ever built, enhancing

Read More »

Do data centers threaten the water supply?

In a new report, the Royal Academy of Engineering called upon the government to ensure tech companies accurately report how much energy and water their data centers are using and reducing the use of drinking water for cooling. Without such action, warns one of the report’s authors, Professor Tom Rodden, “we face a real risk that our development, deployment and use of AI could do irreparable damage to the environment.” The situation is a little different for the US as the country has large bodies of water offering a  water supply that the UK just does not have. It’s not an accident that there are many data centers around the Chicago area: they’ve also got the Great Lakes to draw upon. Likewise, the Columbia and Klamath Rivers have become magnets for data centers for both water supply and hydroelectric power. Other than the Thames River, the UK doesn’t have these massive bodies of water. Still, the problem is not unique to the UK, says Alan Howard, senior analyst with Omdia. He notes that Microsoft took heat last year because it was draining the water supply of a small Arizona town of Goodyear with a new AI-oriented data center.  The city of Chandler, Arizona passed an ordinance in 2015 that restricted new water-intensive businesses from setting up shop which slowed data center development.   “I believe some data center operators just bowed out,” said Howard.

Read More »

Ireland says there will be no computation without generation

Stanish said that, in 2023, she wrote a paper that predicted “by 2028, more than 70% of multinational enterprises will alter their data center strategies due to limited energy supplies and data center moratoriums, up from only about 5% in 2023. It has been interesting watching this trend evolve as expected, with Ireland being a major force in this conversation since the boycotts against data center growth started a few years ago.” Fair, equitable, and stable electricity allocation, she said, “means that the availability of electricity for digital services is not guaranteed in the future, and I expect these policies, data center moratoriums, and regional rejections will only continue and expand moving forward.” Stanish pointed out that this trend is not just occurring in Ireland. “Many studies show that, globally, enterprises’ digital technologies are consuming energy at a faster rate than overall growth in energy supply (though, to be clear, these studies mostly assume a static position on energy efficiency of current technologies, and don’t take into account potential for nuclear or hydrogen to assuage some of these supply issues).” If taken at face value, she said, this means that a lack of resources could cause widespread electricity shortages in data centers over the next several years. To mitigate this, Stanish said, “so far, data center moratoriums and related constraints (including reduced tax incentives) have been enacted in the US (specifically Virginia and Georgia), Denmark, Singapore, and other countries, in response to concerns about the excessive energy consumption of IT, particularly regarding compute-intense AI workloads and concerns regarding an IT energy monopoly in certain regions. As a result, governments (federal, state, county, etc.) are working to ensure that consumption does not outpace capacity.” Changes needed In its report, the CRU stated, “a safe and secure supply of energy is essential

Read More »

Perspective: Can We Solve the AI Data Center Power Crisis with Microgrids?

President Trump announced a$500 billion private sector investment in the nation’s Artificial Intelligence (AI) infrastructure last month. The investment will come from The Stargate Project, a joint venture between OpenAI, SoftBank, Oracle and MGX, which intends to build 20 new AI data centers in the U.S in the next four to five years. The Stargate Project committed$100 billion for immediate deployment and construction has already begun on its first data center in Texas. At approximately a half a million square feet each, the partners say these new facilities will cement America’s leadership in AI, create jobs and stimulate economic growth. Stargate is not the only game in town, either. Microsoft is expected to invest$80 billion in AI data center development in 2025, with Google, AWS and Meta also spending big. While all this investment in AI infrastructure is certainly exciting, experts say there’s one lingering question that’s yet to be answered and it’s a big one: How are we going to power all these AI data centers? This will be one of the many questions tackled duringMicrogrid Knowledge’s annual conference, which will be held in Texas April 15-17 at the Sheraton Dallas. “Powering Data Centers: Collaborative Microgrid Solutions for a Growing Market” will be one of the key sessions on April 16. Industry experts will gather to discuss how private entities, developers and utilities can work together to deploy microgrids and distributed energy technologies that address the data center industry’s power needs. The panel will share solutions, technologies and strategies that will favorably position data centers in the energy queue. In advance of this session, we sat down with two microgrid experts to learn more about the challenges facing the data center industry and how microgrids can address the sector’s growing energy needs. We spoke with Michael Stadler, co-founder and

Read More »

Microsoft will invest $80B in AI data centers in fiscal 2025

And Microsoft isn’t the only one that is ramping up its investments into AI-enabled data centers. Rival cloud service providers are all investing in either upgrading or opening new data centers to capture a larger chunk of business from developers and users of large language models (LLMs).  In a report published in October 2024, Bloomberg Intelligence estimated that demand for generative AI would push Microsoft, AWS, Google, Oracle, Meta, and Apple would between them devote $200 billion to capex in 2025, up from $110 billion in 2023. Microsoft is one of the biggest spenders, followed closely by Google and AWS, Bloomberg Intelligence said. Its estimate of Microsoft’s capital spending on AI, at $62.4 billion for calendar 2025, is lower than Smith’s claim that the company will invest $80 billion in the fiscal year to June 30, 2025. Both figures, though, are way higher than Microsoft’s 2020 capital expenditure of “just” $17.6 billion. The majority of the increased spending is tied to cloud services and the expansion of AI infrastructure needed to provide compute capacity for OpenAI workloads. Separately, last October Amazon CEO Andy Jassy said his company planned total capex spend of $75 billion in 2024 and even more in 2025, with much of it going to AWS, its cloud computing division.

Read More »

John Deere unveils more autonomous farm machines to address skill labor shortage

Join our daily and weekly newsletters for the latest updates and exclusive content on industry-leading AI coverage. Learn More Self-driving tractors might be the path to self-driving cars. John Deere has revealed a new line of autonomous machines and tech across agriculture, construction and commercial landscaping. The Moline, Illinois-based John Deere has been in business for 187 years, yet it’s been a regular as a non-tech company showing off technology at the big tech trade show in Las Vegas and is back at CES 2025 with more autonomous tractors and other vehicles. This is not something we usually cover, but John Deere has a lot of data that is interesting in the big picture of tech. The message from the company is that there aren’t enough skilled farm laborers to do the work that its customers need. It’s been a challenge for most of the last two decades, said Jahmy Hindman, CTO at John Deere, in a briefing. Much of the tech will come this fall and after that. He noted that the average farmer in the U.S. is over 58 and works 12 to 18 hours a day to grow food for us. And he said the American Farm Bureau Federation estimates there are roughly 2.4 million farm jobs that need to be filled annually; and the agricultural work force continues to shrink. (This is my hint to the anti-immigration crowd). John Deere’s autonomous 9RX Tractor. Farmers can oversee it using an app. While each of these industries experiences their own set of challenges, a commonality across all is skilled labor availability. In construction, about 80% percent of contractors struggle to find skilled labor. And in commercial landscaping, 86% of landscaping business owners can’t find labor to fill open positions, he said. “They have to figure out how to do

Read More »

2025 playbook for enterprise AI success, from agents to evals

Join our daily and weekly newsletters for the latest updates and exclusive content on industry-leading AI coverage. Learn More 2025 is poised to be a pivotal year for enterprise AI. The past year has seen rapid innovation, and this year will see the same. This has made it more critical than ever to revisit your AI strategy to stay competitive and create value for your customers. From scaling AI agents to optimizing costs, here are the five critical areas enterprises should prioritize for their AI strategy this year. 1. Agents: the next generation of automation AI agents are no longer theoretical. In 2025, they’re indispensable tools for enterprises looking to streamline operations and enhance customer interactions. Unlike traditional software, agents powered by large language models (LLMs) can make nuanced decisions, navigate complex multi-step tasks, and integrate seamlessly with tools and APIs. At the start of 2024, agents were not ready for prime time, making frustrating mistakes like hallucinating URLs. They started getting better as frontier large language models themselves improved. “Let me put it this way,” said Sam Witteveen, cofounder of Red Dragon, a company that develops agents for companies, and that recently reviewed the 48 agents it built last year. “Interestingly, the ones that we built at the start of the year, a lot of those worked way better at the end of the year just because the models got better.” Witteveen shared this in the video podcast we filmed to discuss these five big trends in detail. Models are getting better and hallucinating less, and they’re also being trained to do agentic tasks. Another feature that the model providers are researching is a way to use the LLM as a judge, and as models get cheaper (something we’ll cover below), companies can use three or more models to

Read More »

OpenAI’s red teaming innovations define new essentials for security leaders in the AI era

Join our daily and weekly newsletters for the latest updates and exclusive content on industry-leading AI coverage. Learn More OpenAI has taken a more aggressive approach to red teaming than its AI competitors, demonstrating its security teams’ advanced capabilities in two areas: multi-step reinforcement and external red teaming. OpenAI recently released two papers that set a new competitive standard for improving the quality, reliability and safety of AI models in these two techniques and more. The first paper, “OpenAI’s Approach to External Red Teaming for AI Models and Systems,” reports that specialized teams outside the company have proven effective in uncovering vulnerabilities that might otherwise have made it into a released model because in-house testing techniques may have missed them. In the second paper, “Diverse and Effective Red Teaming with Auto-Generated Rewards and Multi-Step Reinforcement Learning,” OpenAI introduces an automated framework that relies on iterative reinforcement learning to generate a broad spectrum of novel, wide-ranging attacks. Going all-in on red teaming pays practical, competitive dividends It’s encouraging to see competitive intensity in red teaming growing among AI companies. When Anthropic released its AI red team guidelines in June of last year, it joined AI providers including Google, Microsoft, Nvidia, OpenAI, and even the U.S.’s National Institute of Standards and Technology (NIST), which all had released red teaming frameworks. Investing heavily in red teaming yields tangible benefits for security leaders in any organization. OpenAI’s paper on external red teaming provides a detailed analysis of how the company strives to create specialized external teams that include cybersecurity and subject matter experts. The goal is to see if knowledgeable external teams can defeat models’ security perimeters and find gaps in their security, biases and controls that prompt-based testing couldn’t find. What makes OpenAI’s recent papers noteworthy is how well they define using human-in-the-middle

Read More »