Stay Ahead, Stay ONMINE

Practical SQL Puzzles That Will Level Up Your Skill

There are some Sql patterns that, once you know them, you start seeing them everywhere. The solutions to the puzzles that I will show you today are actually very simple SQL queries, but understanding the concept behind them will surely unlock new solutions to the queries you write on a day-to-day basis. These challenges are all based on real-world scenarios, as over the past few months I made a point of writing down every puzzle-like query that I had to build. I also encourage you to try them for yourself, so that you can challenge yourself first, which will improve your learning! All queries to generate the datasets will be provided in a PostgreSQL and DuckDB-friendly syntax, so that you can easily copy and play with them. At the end I will also provide you a link to a GitHub repo containing all the code, as well as the answer to the bonus challenge I will leave for you! I organized these puzzles in order of increasing difficulty, so, if you find the first ones too easy, at least take a look at the last one, which uses a technique that I truly believe you won’t have seen before. Okay, let’s get started. I love this puzzle because of how short and simple the final query is, even though it deals with many edge cases. The data for this challenge shows tickets moving in between Kanban stages, and the objective is to find how long, on average, tickets stay in the Doing stage. The data contains the ID of the ticket, the date the ticket was created, the date of the move, and the “from” and “to” stages of the move. The stages present are New, Doing, Review, and Done. Some things you need to know (edge cases): Tickets can move backwards, meaning tickets can go back to the Doing stage. You should not include tickets that are still stuck in the Doing stage, as there is no way to know how long they will stay there for. Tickets are not always created in the New stage. “`SQL CREATE TABLE ticket_moves ( ticket_id INT NOT NULL, create_date DATE NOT NULL, move_date DATE NOT NULL, from_stage TEXT NOT NULL, to_stage TEXT NOT NULL ); “` “`SQL INSERT INTO ticket_moves (ticket_id, create_date, move_date, from_stage, to_stage) VALUES — Ticket 1: Created in “New”, then moves to Doing, Review, Done. (1, ‘2024-09-01’, ‘2024-09-03’, ‘New’, ‘Doing’), (1, ‘2024-09-01’, ‘2024-09-07’, ‘Doing’, ‘Review’), (1, ‘2024-09-01’, ‘2024-09-10’, ‘Review’, ‘Done’), — Ticket 2: Created in “New”, then moves: New → Doing → Review → Doing again → Review. (2, ‘2024-09-05’, ‘2024-09-08’, ‘New’, ‘Doing’), (2, ‘2024-09-05’, ‘2024-09-12’, ‘Doing’, ‘Review’), (2, ‘2024-09-05’, ‘2024-09-15’, ‘Review’, ‘Doing’), (2, ‘2024-09-05’, ‘2024-09-20’, ‘Doing’, ‘Review’), — Ticket 3: Created in “New”, then moves to Doing. (Edge case: no subsequent move from Doing.) (3, ‘2024-09-10’, ‘2024-09-16’, ‘New’, ‘Doing’), — Ticket 4: Created already in “Doing”, then moves to Review. (4, ‘2024-09-15’, ‘2024-09-22’, ‘Doing’, ‘Review’); “` A summary of the data: Ticket 1: Created in the New stage, moves normally to Doing, then Review, and then Done. Ticket 2: Created in New, then moves: New → Doing → Review → Doing again → Review. Ticket 3: Created in New, moves to Doing, but it is still stuck there. Ticket 4: Created in the Doing stage, moves to Review afterward. It might be a good idea to stop for a bit and think how you would deal with this. Can you find out how long a ticket stays on a single stage? Honestly, this sounds intimidating at first, and it looks like it will be a nightmare to deal with all the edge cases. Let me show you the full solution to the problem, and then I will explain what is happening afterward. “`SQL WITH stage_intervals AS (     SELECT         ticket_id,         from_stage,         move_date          – COALESCE(             LAG(move_date) OVER (                 PARTITION BY ticket_id                  ORDER BY move_date             ),              create_date         ) AS days_in_stage     FROM         ticket_moves ) SELECT     SUM(days_in_stage) / COUNT(DISTINCT ticket_id) as avg_days_in_doing FROM     stage_intervals WHERE     from_stage = ‘Doing’; “` The first CTE uses the LAG function to find the previous move of the ticket, which will be the time the ticket entered that stage. Calculating the duration is as simple as subtracting the previous date from the move date. What you should notice is the use of the COALESCE in the previous move date. What that does is that if a ticket doesn’t have a previous move, then it uses the date of creation of the ticket. This takes care of the cases of tickets being created directly into the Doing stage, as it still will properly calculate the time it took to leave the stage. This is the result of the first CTE, showing the time spent in each stage. Notice how the Ticket 2 has two entries, as it visited the Doing stage in two separate occasions. With this done, it’s just a matter of getting the average as the SUM of total days spent in doing, divided by the distinct number of tickets that ever left the stage. Doing it this way, instead of simply using the AVG, makes sure that the two rows for Ticket 2 get properly accounted for as a single ticket. Not so bad, right? The goal of this second challenge is to find the most recent contract sequence of every employee. A break of sequence happens when two contracts have a gap of more than one day between them.  In this dataset, there are no contract overlaps, meaning that a contract for the same employee either has a gap or ends a day before the new one starts. “`SQL CREATE TABLE contracts (     contract_id integer PRIMARY KEY,     employee_id integer NOT NULL,     start_date date NOT NULL,     end_date date NOT NULL ); INSERT INTO contracts (contract_id, employee_id, start_date, end_date) VALUES      — Employee 1: Two continuous contracts     (1, 1, ‘2024-01-01’, ‘2024-03-31’),     (2, 1, ‘2024-04-01’, ‘2024-06-30’),     — Employee 2: One contract, then a gap of three days, then two contracts     (3, 2, ‘2024-01-01’, ‘2024-02-15’),     (4, 2, ‘2024-02-19’, ‘2024-04-30’),     (5, 2, ‘2024-05-01’, ‘2024-07-31’),     — Employee 3: One contract     (6, 3, ‘2024-03-01’, ‘2024-08-31’); “` As a summary of the data: Employee 1: Has two continuous contracts. Employee 2: One contract, then a gap of three days, then two contracts. Employee 3: One contract. The expected result, given the dataset, is that all contracts should be included except for the first contract of Employee 2, which is the only one that has a gap. Before explaining the logic behind the solution, I would like you to think about what operation can be used to join the contracts that belong to the same sequence. Focus only on the second row of data, what information do you need to know if this contract was a break or not? I hope it’s clear that this is the perfect situation for window functions, again. They are incredibly useful for solving problems like this, and understanding when to use them helps a lot in finding clean solutions to problems. First thing to do, then, is to get the end date of the previous contract for the same employee with the LAG function. Doing that, it’s simple to compare both dates and check if it was a break of sequence. “`SQL WITH ordered_contracts AS (     SELECT         *,         LAG(end_date) OVER (PARTITION BY employee_id ORDER BY start_date) AS previous_end_date     FROM         contracts ), gapped_contracts AS (     SELECT         *,         — Deals with the case of the first contract, which won’t have         — a previous end date. In this case, it’s still the start of a new         — sequence.         CASE WHEN previous_end_date IS NULL             OR previous_end_date < start_date – INTERVAL '1 day' THEN             1         ELSE             0         END AS is_new_sequence     FROM         ordered_contracts ) SELECT * FROM gapped_contracts ORDER BY employee_id ASC; “` An intuitive way to continue the query is to number the sequences of each employee. For example, an employee who has no gap, will always be on his first sequence, but an employee who had 5 breaks in contracts will be on his 5th sequence. Funnily enough, this is done by another window function. “`SQL — — Previous CTEs — sequences AS (     SELECT         *,         SUM(is_new_sequence) OVER (PARTITION BY employee_id ORDER BY start_date) AS sequence_id FROM     gapped_contracts ) SELECT * FROM sequences ORDER BY employee_id ASC; “` Notice how, for Employee 2, he starts his sequence #2 after the first gapped value. To finish this query, I grouped the data by employee, got the value of their most recent sequence, and then did an inner join with the sequences to keep only the most recent one. “`SQL — — Previous CTEs — max_sequence AS (     SELECT         employee_id,         MAX(sequence_id) AS max_sequence_id FROM     sequences GROUP BY     employee_id ), latest_contract_sequence AS (     SELECT         c.contract_id,         c.employee_id,         c.start_date,         c.end_date     FROM         sequences c         JOIN max_sequence m ON c.sequence_id = m.max_sequence_id             AND c.employee_id = m.employee_id         ORDER BY             c.employee_id,             c.start_date ) SELECT     * FROM     latest_contract_sequence; “` As expected, our final result is basically our starting query just with the first contract of Employee 2 missing!  Finally, the last puzzle — I’m glad you made it this far.  For me, this is the most mind-blowing one, as when I first encountered this problem I thought of a completely different solution that would be a mess to implement in SQL. For this puzzle, I’ve changed the context from what I had to deal with for my job, as I think it will make it easier to explain.  Imagine you’re a data analyst at an event venue, and you’re analyzing the talks scheduled for an upcoming event. You want to find the time of day where there will be the highest number of talks happening at the same time. This is what you should know about the schedules: Rooms are booked in increments of 30min, e.g. from 9h-10h30. The data is clean, there are no overbookings of meeting rooms. There can be back-to-back meetings in a single meeting room. Meeting schedule visualized (this is the actual data).  “`SQL CREATE TABLE meetings (     room TEXT NOT NULL,     start_time TIMESTAMP NOT NULL,     end_time TIMESTAMP NOT NULL ); INSERT INTO meetings (room, start_time, end_time) VALUES     — Room A meetings     ('Room A', '2024-10-01 09:00', '2024-10-01 10:00'),     ('Room A', '2024-10-01 10:00', '2024-10-01 11:00'),     ('Room A', '2024-10-01 11:00', '2024-10-01 12:00'),     — Room B meetings     ('Room B', '2024-10-01 09:30', '2024-10-01 11:30'),     — Room C meetings     ('Room C', '2024-10-01 09:00', '2024-10-01 10:00'),     ('Room C', '2024-10-01 11:30', '2024-10-01 12:00'); “` The way to solve this is using what is called a Sweep Line Algorithm, or also known as an event-based solution. This last name actually helps to understand what will be done, as the idea is that instead of dealing with intervals, which is what we have in the original data, we deal with events instead. To do this, we need to transform every row into two separate events. The first event will be the Start of the meeting, and the second event will be the End of the meeting. “`SQL WITH events AS (   — Create an event for the start of each meeting (+1)   SELECT      start_time AS event_time,      1 AS delta   FROM meetings   UNION ALL   — Create an event for the end of each meeting (-1)   SELECT     — Small trick to work with the back-to-back meetings (explained later)     end_time – interval '1 minute' as end_time,     -1 AS delta   FROM meetings ) SELECT * FROM events; “` Take the time to understand what is happening here. To create two events from a single row of data, we’re simply unioning the dataset on itself; the first half uses the start time as the timestamp, and the second part uses the end time. You might already notice the delta column created and see where this is going. When an event starts, we count it as +1, when it ends, we count it as -1. You might even be already thinking of another window function to solve this, and you’re actually right! But before that, let me just explain the trick I used in the end dates. As I don’t want back-to-back meetings to count as two concurrent meetings, I’m subtracting a single minute of every end date. This way, if a meeting ends and another starts at 10h30, it won’t be assumed that two meetings are concurrently happening at 10h30. Okay, back to the query and yet another window function. This time, though, the function of choice is a rolling SUM. “`SQL — — Previous CTEs — ordered_events AS (   SELECT     event_time,     delta,     SUM(delta) OVER (ORDER BY event_time, delta DESC) AS concurrent_meetings   FROM events ) SELECT * FROM ordered_events ORDER BY event_time DESC; “` The rolling SUM at the Delta column is essentially walking down every record and finding how many events are active at that time. For example, at 9 am sharp, it sees two events starting, so it marks the number of concurrent meetings as two! When the third meeting starts, the count goes up to three. But when it gets to 9h59 (10 am), then two meetings end, bringing the counter back to one. With this data, the only thing missing is to find when the highest value of concurrent meetings happens. “`SQL — — Previous CTEs — max_events AS (   — Find the maximum concurrent meetings value   SELECT      event_time,      concurrent_meetings,     RANK() OVER (ORDER BY concurrent_meetings DESC) AS rnk   FROM ordered_events ) SELECT event_time, concurrent_meetings FROM max_events WHERE rnk = 1; “` That’s it! The interval of 9h30–10h is the one with the largest number of concurrent meetings, which checks out with the schedule visualization above! This solution looks incredibly simple in my opinion, and it works for so many situations. Every time you are dealing with intervals now, you should think if the query wouldn’t be easier if you thought about it in the perspective of events. But before you move on, and to really nail down this concept, I want to leave you with a bonus challenge, which is also a common application of the Sweep Line Algorithm. I hope you give it a try! Bonus challenge The context for this one is still the same as the last puzzle, but now, instead of trying to find the period when there are most concurrent meetings, the objective is to find bad scheduling. It seems that there are overlaps in the meeting rooms, which need to be listed so it can be fixed ASAP. How would you find out if the same meeting room has two or more meetings booked at the same time? Here are some tips on how to solve it: It’s still the same algorithm. This means you will still do the UNION, but it will look slightly different. You should think in the perspective of each meeting room. You can use this data for the challenge: “`SQL CREATE TABLE meetings_overlap (     room TEXT NOT NULL,     start_time TIMESTAMP NOT NULL,     end_time TIMESTAMP NOT NULL ); INSERT INTO meetings_overlap (room, start_time, end_time) VALUES     — Room A meetings     ('Room A', '2024-10-01 09:00', '2024-10-01 10:00'),     ('Room A', '2024-10-01 10:00', '2024-10-01 11:00'),     ('Room A', '2024-10-01 11:00', '2024-10-01 12:00'),     — Room B meetings     ('Room B', '2024-10-01 09:30', '2024-10-01 11:30'),     — Room C meetings     ('Room C', '2024-10-01 09:00', '2024-10-01 10:00'),     — Overlaps with previous meeting.     ('Room C', '2024-10-01 09:30', '2024-10-01 12:00'); “` If you’re interested in the solution to this puzzle, as well as the rest of the queries, check this GitHub repo. The first takeaway from this blog post is that window functions are overpowered. Ever since I got more comfortable with using them, I feel that my queries have gotten so much simpler and easier to read, and I hope the same happens to you. If you’re interested in learning more about them, you would probably enjoy reading this other blog post I’ve written, where I go over how you can understand and use them effectively. The second takeaway is that these patterns used in the challenges really do happen in many other places. You might need to find sequences of subscriptions, customer retention, or you might need to find overlap of tasks. There are many situations when you will need to use window functions in a very similar fashion to what was done in the puzzles. The third thing I want you to remember is about this solution to using events besides dealing with intervals. I’ve looked at some problems I solved a long time ago that I could’ve used this pattern on to make my life easier, and unfortunately, I didn’t know about it at the time. I really do hope you enjoyed this post and gave a shot to the puzzles yourself. And I’m sure that if you made it this far, you either learned something new about SQL or strengthened your knowledge of window functions!  Thank you so much for reading. If you have questions or just want to get in touch with me, don’t hesitate to contact me at mtrentz.com. All images by the author unless stated otherwise.

There are some Sql patterns that, once you know them, you start seeing them everywhere. The solutions to the puzzles that I will show you today are actually very simple SQL queries, but understanding the concept behind them will surely unlock new solutions to the queries you write on a day-to-day basis.

These challenges are all based on real-world scenarios, as over the past few months I made a point of writing down every puzzle-like query that I had to build. I also encourage you to try them for yourself, so that you can challenge yourself first, which will improve your learning!

All queries to generate the datasets will be provided in a PostgreSQL and DuckDB-friendly syntax, so that you can easily copy and play with them. At the end I will also provide you a link to a GitHub repo containing all the code, as well as the answer to the bonus challenge I will leave for you!

I organized these puzzles in order of increasing difficulty, so, if you find the first ones too easy, at least take a look at the last one, which uses a technique that I truly believe you won’t have seen before.

Okay, let’s get started.

I love this puzzle because of how short and simple the final query is, even though it deals with many edge cases. The data for this challenge shows tickets moving in between Kanban stages, and the objective is to find how long, on average, tickets stay in the Doing stage.

The data contains the ID of the ticket, the date the ticket was created, the date of the move, and the “from” and “to” stages of the move. The stages present are New, Doing, Review, and Done.

Some things you need to know (edge cases):

  • Tickets can move backwards, meaning tickets can go back to the Doing stage.
  • You should not include tickets that are still stuck in the Doing stage, as there is no way to know how long they will stay there for.
  • Tickets are not always created in the New stage.
```SQL

CREATE TABLE ticket_moves (
    ticket_id INT NOT NULL,
    create_date DATE NOT NULL,
    move_date DATE NOT NULL,
    from_stage TEXT NOT NULL,
    to_stage TEXT NOT NULL
);

```
```SQL

INSERT INTO ticket_moves (ticket_id, create_date, move_date, from_stage, to_stage)
    VALUES
        -- Ticket 1: Created in "New", then moves to Doing, Review, Done.
        (1, '2024-09-01', '2024-09-03', 'New', 'Doing'),
        (1, '2024-09-01', '2024-09-07', 'Doing', 'Review'),
        (1, '2024-09-01', '2024-09-10', 'Review', 'Done'),
        -- Ticket 2: Created in "New", then moves: New → Doing → Review → Doing again → Review.
        (2, '2024-09-05', '2024-09-08', 'New', 'Doing'),
        (2, '2024-09-05', '2024-09-12', 'Doing', 'Review'),
        (2, '2024-09-05', '2024-09-15', 'Review', 'Doing'),
        (2, '2024-09-05', '2024-09-20', 'Doing', 'Review'),
        -- Ticket 3: Created in "New", then moves to Doing. (Edge case: no subsequent move from Doing.)
        (3, '2024-09-10', '2024-09-16', 'New', 'Doing'),
        -- Ticket 4: Created already in "Doing", then moves to Review.
        (4, '2024-09-15', '2024-09-22', 'Doing', 'Review');
```
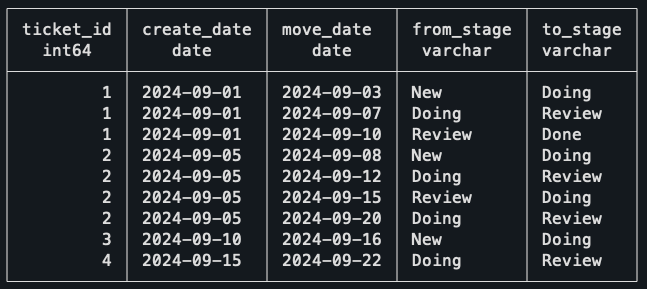
A summary of the data:

  • Ticket 1: Created in the New stage, moves normally to Doing, then Review, and then Done.
  • Ticket 2: Created in New, then moves: New → Doing → Review → Doing again → Review.
  • Ticket 3: Created in New, moves to Doing, but it is still stuck there.
  • Ticket 4: Created in the Doing stage, moves to Review afterward.

It might be a good idea to stop for a bit and think how you would deal with this. Can you find out how long a ticket stays on a single stage?

Honestly, this sounds intimidating at first, and it looks like it will be a nightmare to deal with all the edge cases. Let me show you the full solution to the problem, and then I will explain what is happening afterward.

```SQL

WITH stage_intervals AS (
    SELECT
        ticket_id,
        from_stage,
        move_date 
        - COALESCE(
            LAG(move_date) OVER (
                PARTITION BY ticket_id 
                ORDER BY move_date
            ), 
            create_date
        ) AS days_in_stage
    FROM
        ticket_moves
)
SELECT
    SUM(days_in_stage) / COUNT(DISTINCT ticket_id) as avg_days_in_doing
FROM
    stage_intervals
WHERE
    from_stage = 'Doing';
```
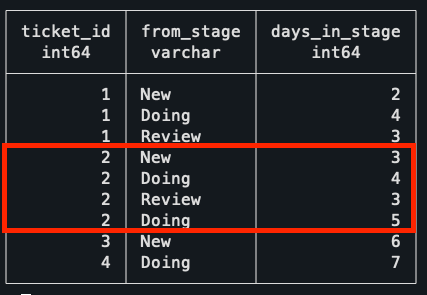
The first CTE uses the LAG function to find the previous move of the ticket, which will be the time the ticket entered that stage. Calculating the duration is as simple as subtracting the previous date from the move date.

What you should notice is the use of the COALESCE in the previous move date. What that does is that if a ticket doesn’t have a previous move, then it uses the date of creation of the ticket. This takes care of the cases of tickets being created directly into the Doing stage, as it still will properly calculate the time it took to leave the stage.

This is the result of the first CTE, showing the time spent in each stage. Notice how the Ticket 2 has two entries, as it visited the Doing stage in two separate occasions.
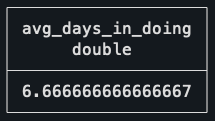
With this done, it’s just a matter of getting the average as the SUM of total days spent in doing, divided by the distinct number of tickets that ever left the stage. Doing it this way, instead of simply using the AVG, makes sure that the two rows for Ticket 2 get properly accounted for as a single ticket.

Not so bad, right?

The goal of this second challenge is to find the most recent contract sequence of every employee. A break of sequence happens when two contracts have a gap of more than one day between them. 

In this dataset, there are no contract overlaps, meaning that a contract for the same employee either has a gap or ends a day before the new one starts.

```SQL
CREATE TABLE contracts (
    contract_id integer PRIMARY KEY,
    employee_id integer NOT NULL,
    start_date date NOT NULL,
    end_date date NOT NULL
);

INSERT INTO contracts (contract_id, employee_id, start_date, end_date)
VALUES 
    -- Employee 1: Two continuous contracts
    (1, 1, '2024-01-01', '2024-03-31'),
    (2, 1, '2024-04-01', '2024-06-30'),
    -- Employee 2: One contract, then a gap of three days, then two contracts
    (3, 2, '2024-01-01', '2024-02-15'),
    (4, 2, '2024-02-19', '2024-04-30'),
    (5, 2, '2024-05-01', '2024-07-31'),
    -- Employee 3: One contract
    (6, 3, '2024-03-01', '2024-08-31');
```
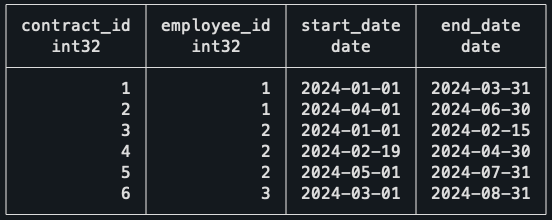
As a summary of the data:

  • Employee 1: Has two continuous contracts.
  • Employee 2: One contract, then a gap of three days, then two contracts.
  • Employee 3: One contract.

The expected result, given the dataset, is that all contracts should be included except for the first contract of Employee 2, which is the only one that has a gap.

Before explaining the logic behind the solution, I would like you to think about what operation can be used to join the contracts that belong to the same sequence. Focus only on the second row of data, what information do you need to know if this contract was a break or not?

I hope it’s clear that this is the perfect situation for window functions, again. They are incredibly useful for solving problems like this, and understanding when to use them helps a lot in finding clean solutions to problems.

First thing to do, then, is to get the end date of the previous contract for the same employee with the LAG function. Doing that, it’s simple to compare both dates and check if it was a break of sequence.

```SQL
WITH ordered_contracts AS (
    SELECT
        *,
        LAG(end_date) OVER (PARTITION BY employee_id ORDER BY start_date) AS previous_end_date
    FROM
        contracts
),
gapped_contracts AS (
    SELECT
        *,
        -- Deals with the case of the first contract, which won't have
        -- a previous end date. In this case, it's still the start of a new
        -- sequence.
        CASE WHEN previous_end_date IS NULL
            OR previous_end_date < start_date - INTERVAL '1 day' THEN
            1
        ELSE
            0
        END AS is_new_sequence
    FROM
        ordered_contracts
)
SELECT * FROM gapped_contracts ORDER BY employee_id ASC;
```

An intuitive way to continue the query is to number the sequences of each employee. For example, an employee who has no gap, will always be on his first sequence, but an employee who had 5 breaks in contracts will be on his 5th sequence. Funnily enough, this is done by another window function.

```SQL
--
-- Previous CTEs
--
sequences AS (
    SELECT
        *,
        SUM(is_new_sequence) OVER (PARTITION BY employee_id ORDER BY start_date) AS sequence_id
FROM
    gapped_contracts
)
SELECT * FROM sequences ORDER BY employee_id ASC;
```

Notice how, for Employee 2, he starts his sequence #2 after the first gapped value. To finish this query, I grouped the data by employee, got the value of their most recent sequence, and then did an inner join with the sequences to keep only the most recent one.

```SQL
--
-- Previous CTEs
--
max_sequence AS (
    SELECT
        employee_id,
        MAX(sequence_id) AS max_sequence_id
FROM
    sequences
GROUP BY
    employee_id
),
latest_contract_sequence AS (
    SELECT
        c.contract_id,
        c.employee_id,
        c.start_date,
        c.end_date
    FROM
        sequences c
        JOIN max_sequence m ON c.sequence_id = m.max_sequence_id
            AND c.employee_id = m.employee_id
        ORDER BY
            c.employee_id,
            c.start_date
)
SELECT
    *
FROM
    latest_contract_sequence;
```

As expected, our final result is basically our starting query just with the first contract of Employee 2 missing! 

Finally, the last puzzle — I’m glad you made it this far. 

For me, this is the most mind-blowing one, as when I first encountered this problem I thought of a completely different solution that would be a mess to implement in SQL.

For this puzzle, I’ve changed the context from what I had to deal with for my job, as I think it will make it easier to explain. 

Imagine you’re a data analyst at an event venue, and you’re analyzing the talks scheduled for an upcoming event. You want to find the time of day where there will be the highest number of talks happening at the same time.

This is what you should know about the schedules:

  • Rooms are booked in increments of 30min, e.g. from 9h-10h30.
  • The data is clean, there are no overbookings of meeting rooms.
  • There can be back-to-back meetings in a single meeting room.

Meeting schedule visualized (this is the actual data). 

```SQL
CREATE TABLE meetings (
    room TEXT NOT NULL,
    start_time TIMESTAMP NOT NULL,
    end_time TIMESTAMP NOT NULL
);

INSERT INTO meetings (room, start_time, end_time) VALUES
    -- Room A meetings
    ('Room A', '2024-10-01 09:00', '2024-10-01 10:00'),
    ('Room A', '2024-10-01 10:00', '2024-10-01 11:00'),
    ('Room A', '2024-10-01 11:00', '2024-10-01 12:00'),
    -- Room B meetings
    ('Room B', '2024-10-01 09:30', '2024-10-01 11:30'),
    -- Room C meetings
    ('Room C', '2024-10-01 09:00', '2024-10-01 10:00'),
    ('Room C', '2024-10-01 11:30', '2024-10-01 12:00');
```
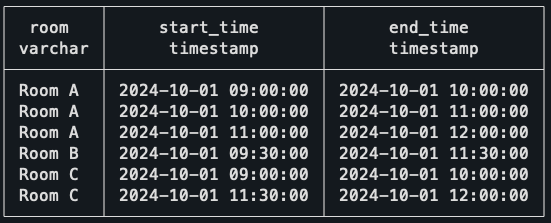
The way to solve this is using what is called a Sweep Line Algorithm, or also known as an event-based solution. This last name actually helps to understand what will be done, as the idea is that instead of dealing with intervals, which is what we have in the original data, we deal with events instead.

To do this, we need to transform every row into two separate events. The first event will be the Start of the meeting, and the second event will be the End of the meeting.

```SQL
WITH events AS (
  -- Create an event for the start of each meeting (+1)
  SELECT 
    start_time AS event_time, 
    1 AS delta
  FROM meetings
  UNION ALL
  -- Create an event for the end of each meeting (-1)
  SELECT 
   -- Small trick to work with the back-to-back meetings (explained later)
    end_time - interval '1 minute' as end_time,
    -1 AS delta
  FROM meetings
)
SELECT * FROM events;
```
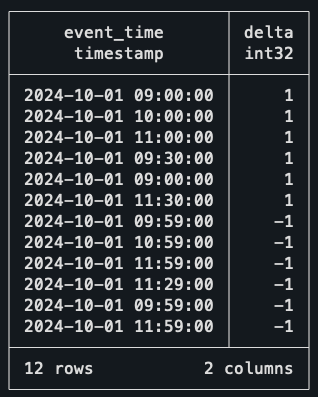
Take the time to understand what is happening here. To create two events from a single row of data, we’re simply unioning the dataset on itself; the first half uses the start time as the timestamp, and the second part uses the end time.

You might already notice the delta column created and see where this is going. When an event starts, we count it as +1, when it ends, we count it as -1. You might even be already thinking of another window function to solve this, and you’re actually right!

But before that, let me just explain the trick I used in the end dates. As I don’t want back-to-back meetings to count as two concurrent meetings, I’m subtracting a single minute of every end date. This way, if a meeting ends and another starts at 10h30, it won’t be assumed that two meetings are concurrently happening at 10h30.

Okay, back to the query and yet another window function. This time, though, the function of choice is a rolling SUM.

```SQL
--
-- Previous CTEs
--
ordered_events AS (
  SELECT
    event_time,
    delta,
    SUM(delta) OVER (ORDER BY event_time, delta DESC) AS concurrent_meetings
  FROM events
)
SELECT * FROM ordered_events ORDER BY event_time DESC;
```
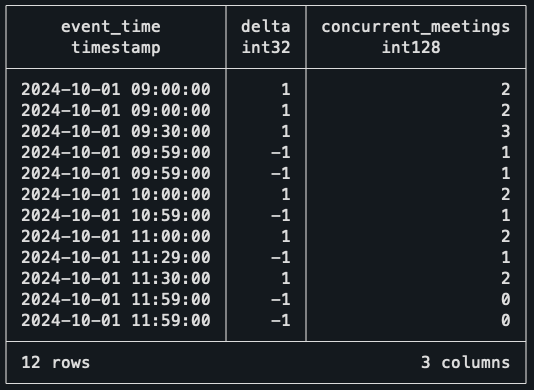
The rolling SUM at the Delta column is essentially walking down every record and finding how many events are active at that time. For example, at 9 am sharp, it sees two events starting, so it marks the number of concurrent meetings as two!

When the third meeting starts, the count goes up to three. But when it gets to 9h59 (10 am), then two meetings end, bringing the counter back to one. With this data, the only thing missing is to find when the highest value of concurrent meetings happens.

```SQL
--
-- Previous CTEs
--
max_events AS (
  -- Find the maximum concurrent meetings value
  SELECT 
    event_time, 
    concurrent_meetings,
    RANK() OVER (ORDER BY concurrent_meetings DESC) AS rnk
  FROM ordered_events
)
SELECT event_time, concurrent_meetings
FROM max_events
WHERE rnk = 1;
```

That’s it! The interval of 9h30–10h is the one with the largest number of concurrent meetings, which checks out with the schedule visualization above!

This solution looks incredibly simple in my opinion, and it works for so many situations. Every time you are dealing with intervals now, you should think if the query wouldn’t be easier if you thought about it in the perspective of events.

But before you move on, and to really nail down this concept, I want to leave you with a bonus challenge, which is also a common application of the Sweep Line Algorithm. I hope you give it a try!

Bonus challenge

The context for this one is still the same as the last puzzle, but now, instead of trying to find the period when there are most concurrent meetings, the objective is to find bad scheduling. It seems that there are overlaps in the meeting rooms, which need to be listed so it can be fixed ASAP.

How would you find out if the same meeting room has two or more meetings booked at the same time? Here are some tips on how to solve it:

  • It’s still the same algorithm.
  • This means you will still do the UNION, but it will look slightly different.
  • You should think in the perspective of each meeting room.

You can use this data for the challenge:

```SQL
CREATE TABLE meetings_overlap (
    room TEXT NOT NULL,
    start_time TIMESTAMP NOT NULL,
    end_time TIMESTAMP NOT NULL
);

INSERT INTO meetings_overlap (room, start_time, end_time) VALUES
    -- Room A meetings
    ('Room A', '2024-10-01 09:00', '2024-10-01 10:00'),
    ('Room A', '2024-10-01 10:00', '2024-10-01 11:00'),
    ('Room A', '2024-10-01 11:00', '2024-10-01 12:00'),
    -- Room B meetings
    ('Room B', '2024-10-01 09:30', '2024-10-01 11:30'),
    -- Room C meetings
    ('Room C', '2024-10-01 09:00', '2024-10-01 10:00'),
    -- Overlaps with previous meeting.
    ('Room C', '2024-10-01 09:30', '2024-10-01 12:00');
```

If you’re interested in the solution to this puzzle, as well as the rest of the queries, check this GitHub repo.

The first takeaway from this blog post is that window functions are overpowered. Ever since I got more comfortable with using them, I feel that my queries have gotten so much simpler and easier to read, and I hope the same happens to you.

If you’re interested in learning more about them, you would probably enjoy reading this other blog post I’ve written, where I go over how you can understand and use them effectively.

The second takeaway is that these patterns used in the challenges really do happen in many other places. You might need to find sequences of subscriptions, customer retention, or you might need to find overlap of tasks. There are many situations when you will need to use window functions in a very similar fashion to what was done in the puzzles.

The third thing I want you to remember is about this solution to using events besides dealing with intervals. I’ve looked at some problems I solved a long time ago that I could’ve used this pattern on to make my life easier, and unfortunately, I didn’t know about it at the time.


I really do hope you enjoyed this post and gave a shot to the puzzles yourself. And I’m sure that if you made it this far, you either learned something new about SQL or strengthened your knowledge of window functions! 

Thank you so much for reading. If you have questions or just want to get in touch with me, don’t hesitate to contact me at mtrentz.com.

All images by the author unless stated otherwise.

Shape
Shape
Stay Ahead

Explore More Insights

Stay ahead with more perspectives on cutting-edge power, infrastructure, energy,  bitcoin and AI solutions. Explore these articles to uncover strategies and insights shaping the future of industries.

Shape

Why enterprise networks need both reach and resilience

As enterprises expand across regions, so do their cloud platforms and digital ecosystems. But with the rise of AI and its unprecedented appetite for data, networks are now under more pressure. Many businesses are learning the limits of legacy architecture the hard way. In the race to meet today’s standard

Read More »

Can your network handle the demands of today’s connected workplace?

Enterprise innovation is accelerating at a dizzying pace, from AI-powered applications and real-time data platforms to immersive customer experiences. Solutions like Microsoft Copilot are transforming productivity. Platforms-as-a-Service, such as Lattice, are reimagining how teams collaborate and grow. But beneath this digital renaissance lies the hard truth: none of it works

Read More »

White House Highlights Senate Passing of ‘Big Beautiful Bill’

A statement posted on the White House website on Tuesday said the Senate “delivered a resounding victory for American workers, farmers, and small businesses by passing President Donald J. Trump’s One Big Beautiful Bill”. The White House statement described the bill as “a transformative legislative package that locks in historic tax relief, delivers border security, reforms welfare, funds critical infrastructure, and more”. The statement linked to an X post by the “Official Rapid Response account of the Trump 47 White House” which noted that Vice President JD Vance “cast[ed]… the deciding vote as the Senate approve[d]… the One Big Beautiful Bill – moving it back to the House and one step closer to President Trump’s desk”. A summary of the bill on the Congress website, dated May 22, states that it “reduces taxes, reduces or increases spending for various federal programs, increases the statutory debt limit, and otherwise addresses agencies and programs throughout the federal government”. A tracker on the site showed that the bill had to pass the House and the Senate before going to the President and becoming law. In a statement sent to Rigzone late Tuesday, Independent Petroleum Association of America (IPAA) President and CEO Jeff Eshelman said “President Trump’s One Big Beautiful Bill remains a win for American energy”. “The bill passed today improves the ability of independent oil and natural gas producers to supply reliable, affordable energy to the American people,” he noted. “IPAA is pleased that the legislation reinstates oil and natural gas lease sales for onshore and offshore federal lands and makes common sense reforms to the permitting and leasing process on federal lands. IPAA members, the small businesses of the oil patch, are grateful that industry tax treatments including intangible drilling costs and percentage depletion were protected, along with carried interest deductions being preserved,” he added. “While

Read More »

Saudis Led Surge in OPEC Stalwarts’ Oil Exports Last Month

Saudi Arabia led a surge in crude exports from stalwart oil-producing giants in the Middle East in June.  The flood may reflect a race by Riyadh – along with neighboring Kuwait and the United Arab Emirates – to expedite barrels out of the Persian Gulf while a conflict between Israel and Iran threatened the region’s shipping corridor. While the trio are entitled to raise crude production under an OPEC+ accord, their exports appear to have climbed even further. The three nations loaded 11.9 million barrels a day onto tankers in June, ship-tracking compiled by Bloomberg shows. Their collective seaborne exports were the highest since April 2023.  “Amid supply disruption concerns, Middle Eastern oil producers might have looked at additional storage locations around the world,” said Giovanni Staunovo, a commodity analyst UBS Group AG.  The boost from the three producers, who rank among the biggest and most reliable in the Organization of the Petroleum Exporting Countries, signals the group and its partners are pressing on with plans to speed up the return of halted output – a strategy shift that has rattled crude traders and depressed prices, given faltering demand and an impending oversupply. The correlation between exports and production is patchy because countries load barrels from storage and can also ship them to storage. Likewise, the timing of a few large tanker shipments can have a big impact on flow rates. The bottom line, though is that the month-on-month gain from the trio – at 937,000 a day, their largest collective hike since September 2023 – means large amounts of extra supply are now en route toward buyer countries. Riyadh bolstered crude exports by 441,000 barrels a day, or about 7 percent, this month to 6.36 million a day, according to a preliminary analysis of tanker-tracking data compiled by Bloomberg. Kuwait’s exports rose to the highest

Read More »

Eni Forms New Company to Expand Oilfield Chemicals Business

Eni SpA’s chemical arm, Versalis SpA, has transferred its oilfield chemicals assets to a new company called Versalis Oilfield Solutions SRL in an expansion bid, Eni said Tuesday. “The operation aims to consolidate Versalis’ position in the oilfield services sector by bringing together key expertise and strategic activities in a single, focused and operationally efficient entity”, Italy’s state-controlled Eni said in an online statement. “Versalis’ oilfield operations encompass research and development of advanced chemical formulations, outsourcing their production and marketing solvents and additives designed for the oil drilling industry. Products are tailored to meet specific client requirements, while services include sales and after-sales support, ensuring continuous and qualified technical assistance”. Launched 2010, Eni’s oilfield chemicals business now operates in Africa, the Americas, Asia and Europe, according to the company. Versalis Oilfield Solutions will expand “the scope of activities in terms of products and services, achieve higher revenue targets, and maintain strong profitability”, Eni said. Last year Eni finalized a plan to transform Versalis, which makes basic chemicals, chemical products including plastics and biochemical products such as biolubricants. With an investment of around EUR 2 billion ($2.36 billion), the plan “aims to reduce emissions by approximately 1 million tonnes of CO2, currently about 40 percent of Versalis’ emissions in Italy”, Eni said in a press release October 24, 2024. “It includes the set-up of new industrial plants consistent with the energy transition and decarbonization of industrial sites across sustainable chemistry, as well as biorefining and energy storage”, Eni added. “To enable the construction of the new plants, activity at the cracking plants in Brindisi and Priolo, and the polyethylene plant in Ragusa, will be phased out”. “Eni aims to significantly reduce Versalis’ exposure to basic chemicals, a sector that is facing structural and irreversible decline in Europe, and which has led

Read More »

Macquarie Strategists Forecast USA Crude Inventory Drop

Macquarie strategists are forecasting that U.S. crude inventories will be down by 1.3 million barrels for the week ending June 27, an oil and gas report sent to Rigzone by the Macquarie team late Monday revealed. “This follows a 5.8 million barrel draw in the prior week, with the crude balance again realizing significantly tighter than our expectations amidst another week of disappointing net imports,” the strategists stated in the oil and gas report. “For this week’s crude balance, from refineries, we model an increase in crude runs (+0.2 million barrels per day),” the Macquarie strategists added in the report. “Among net imports, we again model a sharp increase, with exports significantly lower (-1.0 million barrels per day) and imports modestly higher (+0.2 million barrels per day) on a nominal basis,” they continued. The strategists highlighted in the report that timing of cargoes remains a source of potential volatility in this week’s crude balance. “From implied domestic supply (prod.+adj.+transfers), we look for a nominal reduction (-0.3 million barrels per day) this week,” the strategists said in the report. “Rounding out the picture, we anticipate another small increase in Strategic Petroleum Reserve (SPR) stocks (+0.3 million barrels) this week,” they added. The Macquarie strategists went on to state in the report that “among products”, they “look for a gasoline build (+2.3 million barrels) with distillate stocks slightly higher (+0.2 million barrels), and jet stocks modestly lower (-0.4 million barrels)”. “We model implied demand for these three products at 14.7 million barrels per day for the week ending June 27,” the strategists went on to state. U.S. commercial crude oil inventories, excluding those in the SPR, dropped by 5.8 million barrels from the week ending June 13 to the week ending June 20, the U.S. Energy Information Administration (EIA) highlighted in its

Read More »

Uniper to Supply Solar Power to Baden-Wuerttemberg Universities

German utility Uniper SE has signed a deal to supply the state of Baden-Wuerttemberg with 86 gigawatt hours (GWh) of solar electricity per year for three years, or around 258 gigawatt hours. The power is meant for the universities in Ulm, Mannheim, Hohenheim, and Constance. The delivery period will run from January 1, 2026, to December 31, 2028, the company said in a media release. The contract involves a full green supply with flexible guarantees of origin adapted to customer consumption and is based on electricity from Spanish photovoltaic systems that have recently been connected to the grid, Uniper said. The agreement brings the universities one step closer to a sustainable electricity supply. The University of Konstanz already operates its own combined heat and power plants, which cover 50 percent of its electricity requirements. The University of Mannheim has also been sourcing all of its electricity from renewable energies since 2012, Uniper said. “Our customers’ demand for green electricity has increased enormously and we are pleased to be able to meet this demand – always with the aim of harmonizing security of supply and low CO2 energy. In this context, we are supporting the universities in Baden-Wuerttemberg on their way to a better CO2 balance”, Gundolf Schweppe, CCO for Sales at Uniper, said. Uniper and Baden-Wuerttemberg had partnered for energy supply before. In 2021, they signed a gas contract with the University of Stuttgart for January 2023 to December 2026. “Green power contracts have become a key driver in times of energy transition: they guarantee the supply of renewable energy, protect against price fluctuations, promote innovation, and ultimately reduce emissions”, Uniper said. To contact the author, email [email protected] What do you think? We’d love to hear from you, join the conversation on the Rigzone Energy Network. The Rigzone Energy Network is

Read More »

Petronas Signs Vehicle Fluids Deal with Mahindra

Malaysia’s Petroliam Nasional Berhad (Petronas) has secured a deal with Mahindra & Mahindra Ltd. Petronas Lubricants International (PLI) and Petronas Lubricants (India) Pvt. Ltd. bagged an Aftermarket Service Fill contract from India’s largest sports utility vehicle (SUV) manufacturer. Under the agreement, Petronas Lubricants will be the sole distributor of vehicle fluids to Mahindra’s authorized dealers, workshops, and stockists under the Maximile brand within Mahindra’s South Zone Distribution network in India, Petronas said in a media release. The deal involves engine oils, transmission oils, axle oils, and steering fluids. The deal spans 50 Stock Keeping Units (SKUs), catering to a wide range of passenger cars and SUVs across the region, Petronas said. “This collaboration marks a strategic step for PLIPL, reinforcing its commitment to deliver high-performance, OEM-aligned solutions to India’s rapidly growing automotive market”, Petronas said. “Through decades of engineering expertise, PLIPL’s innovative products will now be accessible to a broader market, enabling more customers to experience its award-winning Fluid Technology Solutions™ while supporting the future of mobility in India with Mahindra as a trusted partner. “With proven capabilities in R&D, manufacturing, and global distribution, PETRONAS Lubricants International is ideally positioned to support Mahindra’s expansive service network and evolving customer expectations”, it added. The agreement was signed by Binu Chandy, Chief Executive Officer of Petronas Lubricants India Pvt. Ltd., and R. Veeraraghavan, Senior Vice President of Strategic Sourcing, Mahindra & Mahindra Ltd., in Mumbai. To contact the author, email [email protected] What do you think? We’d love to hear from you, join the conversation on the Rigzone Energy Network. The Rigzone Energy Network is a new social experience created for you and all energy professionals to Speak Up about our industry, share knowledge, connect with peers and industry insiders and engage in a professional community that will empower your career in energy. MORE FROM THIS

Read More »

Data center capacity continues to shift to hyperscalers

However, even though colocation and on-premises data centers will continue to lose share, they will still continue to grow. They just won’t be growing as fast as hyperscalers. So, it creates the illusion of shrinkage when it’s actually just slower growth. In fact, after a sustained period of essentially no growth, on-premises data center capacity is receiving a boost thanks to genAI applications and GPU infrastructure. “While most enterprise workloads are gravitating towards cloud providers or to off-premise colo facilities, a substantial subset are staying on-premise, driving a substantial increase in enterprise GPU servers,” said John Dinsdale, a chief analyst at Synergy Research Group.

Read More »

Oracle inks $30 billion cloud deal, continuing its strong push into AI infrastructure.

He pointed out that, in addition to its continued growth, OCI has a remaining performance obligation (RPO) — total future revenue expected from contracts not yet reported as revenue — of $138 billion, a 41% increase, year over year. The company is benefiting from the immense demand for cloud computing largely driven by AI models. While traditionally an enterprise resource planning (ERP) company, Oracle launched OCI in 2016 and has been strategically investing in AI and data center infrastructure that can support gigawatts of capacity. Notably, it is a partner in the $500 billion SoftBank-backed Stargate project, along with OpenAI, Arm, Microsoft, and Nvidia, that will build out data center infrastructure in the US. Along with that, the company is reportedly spending about $40 billion on Nvidia chips for a massive new data center in Abilene, Texas, that will serve as Stargate’s first location in the country. Further, the company has signaled its plans to significantly increase its investment in Abu Dhabi to grow out its cloud and AI offerings in the UAE; has partnered with IBM to advance agentic AI; has launched more than 50 genAI use cases with Cohere; and is a key provider for ByteDance, which has said it plans to invest $20 billion in global cloud infrastructure this year, notably in Johor, Malaysia. Ellison’s plan: dominate the cloud world CTO and co-founder Larry Ellison announced in a recent earnings call Oracle’s intent to become No. 1 in cloud databases, cloud applications, and the construction and operation of cloud data centers. He said Oracle is uniquely positioned because it has so much enterprise data stored in its databases. He also highlighted the company’s flexible multi-cloud strategy and said that the latest version of its database, Oracle 23ai, is specifically tailored to the needs of AI workloads. Oracle

Read More »

Datacenter industry calls for investment after EU issues water consumption warning

CISPE’s response to the European Commission’s report warns that the resulting regulatory uncertainty could hurt the region’s economy. “Imposing new, standalone water regulations could increase costs, create regulatory fragmentation, and deter investment. This risks shifting infrastructure outside the EU, undermining both sustainability and sovereignty goals,” CISPE said in its latest policy recommendation, Advancing water resilience through digital innovation and responsible stewardship. “Such regulatory uncertainty could also reduce Europe’s attractiveness for climate-neutral infrastructure investment at a time when other regions offer clear and stable frameworks for green data growth,” it added. CISPE’s recommendations are a mix of regulatory harmonization, increased investment, and technological improvement. Currently, water reuse regulation is directed towards agriculture. Updated regulation across the bloc would encourage more efficient use of water in industrial settings such as datacenters, the asosciation said. At the same time, countries struggling with limited public sector budgets are not investing enough in water infrastructure. This could only be addressed by tapping new investment by encouraging formal public-private partnerships (PPPs), it suggested: “Such a framework would enable the development of sustainable financing models that harness private sector innovation and capital, while ensuring robust public oversight and accountability.” Nevertheless, better water management would also require real-time data gathered through networks of IoT sensors coupled to AI analytics and prediction systems. To that end, cloud datacenters were less a drain on water resources than part of the answer: “A cloud-based approach would allow water utilities and industrial users to centralize data collection, automate operational processes, and leverage machine learning algorithms for improved decision-making,” argued CISPE.

Read More »

HPE-Juniper deal clears DOJ hurdle, but settlement requires divestitures

In HPE’s press release following the court’s decision, the vendor wrote that “After close, HPE will facilitate limited access to Juniper’s advanced Mist AIOps technology.” In addition, the DOJ stated that the settlement requires HPE to divest its Instant On business and mandates that the merged firm license critical Juniper software to independent competitors. Specifically, HPE must divest its global Instant On campus and branch WLAN business, including all assets, intellectual property, R&D personnel, and customer relationships, to a DOJ-approved buyer within 180 days. Instant On is aimed primarily at the SMB arena and offers a cloud-based package of wired and wireless networking gear that’s designed for so-called out-of-the-box installation and minimal IT involvement, according to HPE. HPE and Juniper focused on the positive in reacting to the settlement. “Our agreement with the DOJ paves the way to close HPE’s acquisition of Juniper Networks and preserves the intended benefits of this deal for our customers and shareholders, while creating greater competition in the global networking market,” HPE CEO Antonio Neri said in a statement. “For the first time, customers will now have a modern network architecture alternative that can best support the demands of AI workloads. The combination of HPE Aruba Networking and Juniper Networks will provide customers with a comprehensive portfolio of secure, AI-native networking solutions, and accelerate HPE’s ability to grow in the AI data center, service provider and cloud segments.” “This marks an exciting step forward in delivering on a critical customer need – a complete portfolio of modern, secure networking solutions to connect their organizations and provide essential foundations for hybrid cloud and AI,” said Juniper Networks CEO Rami Rahim. “We look forward to closing this transaction and turning our shared vision into reality for enterprise, service provider and cloud customers.”

Read More »

Data center costs surge up to 18% as enterprises face two-year capacity drought

“AI workloads, especially training and archival, can absorb 10-20ms latency variance if offset by 30-40% cost savings and assured uptime,” said Gogia. “Des Moines and Richmond offer better interconnection diversity today than some saturated Tier-1 hubs.” Contract flexibility is also crucial. Rather than traditional long-term leases, enterprises are negotiating shorter agreements with renewal options and exploring revenue-sharing arrangements tied to business performance. Maximizing what you have With expansion becoming more costly, enterprises are getting serious about efficiency through aggressive server consolidation, sophisticated virtualization and AI-driven optimization tools that squeeze more performance from existing space. The companies performing best in this constrained market are focusing on optimization rather than expansion. Some embrace hybrid strategies blending existing on-premises infrastructure with strategic cloud partnerships, reducing dependence on traditional colocation while maintaining control over critical workloads. The long wait When might relief arrive? CBRE’s analysis shows primary markets had a record 6,350 MW under construction at year-end 2024, more than double 2023 levels. However, power capacity constraints are forcing aggressive pre-leasing and extending construction timelines to 2027 and beyond. The implications for enterprises are stark: with construction timelines extending years due to power constraints, companies are essentially locked into current infrastructure for at least the next few years. Those adapting their strategies now will be better positioned when capacity eventually returns.

Read More »

Cisco backs quantum networking startup Qunnect

In partnership with Deutsche Telekom’s T-Labs, Qunnect has set up quantum networking testbeds in New York City and Berlin. “Qunnect understands that quantum networking has to work in the real world, not just in pristine lab conditions,” Vijoy Pandey, general manager and senior vice president of Outshift by Cisco, stated in a blog about the investment. “Their room-temperature approach aligns with our quantum data center vision.” Cisco recently announced it is developing a quantum entanglement chip that could ultimately become part of the gear that will populate future quantum data centers. The chip operates at room temperature, uses minimal power, and functions using existing telecom frequencies, according to Pandey.

Read More »

Microsoft will invest $80B in AI data centers in fiscal 2025

And Microsoft isn’t the only one that is ramping up its investments into AI-enabled data centers. Rival cloud service providers are all investing in either upgrading or opening new data centers to capture a larger chunk of business from developers and users of large language models (LLMs).  In a report published in October 2024, Bloomberg Intelligence estimated that demand for generative AI would push Microsoft, AWS, Google, Oracle, Meta, and Apple would between them devote $200 billion to capex in 2025, up from $110 billion in 2023. Microsoft is one of the biggest spenders, followed closely by Google and AWS, Bloomberg Intelligence said. Its estimate of Microsoft’s capital spending on AI, at $62.4 billion for calendar 2025, is lower than Smith’s claim that the company will invest $80 billion in the fiscal year to June 30, 2025. Both figures, though, are way higher than Microsoft’s 2020 capital expenditure of “just” $17.6 billion. The majority of the increased spending is tied to cloud services and the expansion of AI infrastructure needed to provide compute capacity for OpenAI workloads. Separately, last October Amazon CEO Andy Jassy said his company planned total capex spend of $75 billion in 2024 and even more in 2025, with much of it going to AWS, its cloud computing division.

Read More »

John Deere unveils more autonomous farm machines to address skill labor shortage

Join our daily and weekly newsletters for the latest updates and exclusive content on industry-leading AI coverage. Learn More Self-driving tractors might be the path to self-driving cars. John Deere has revealed a new line of autonomous machines and tech across agriculture, construction and commercial landscaping. The Moline, Illinois-based John Deere has been in business for 187 years, yet it’s been a regular as a non-tech company showing off technology at the big tech trade show in Las Vegas and is back at CES 2025 with more autonomous tractors and other vehicles. This is not something we usually cover, but John Deere has a lot of data that is interesting in the big picture of tech. The message from the company is that there aren’t enough skilled farm laborers to do the work that its customers need. It’s been a challenge for most of the last two decades, said Jahmy Hindman, CTO at John Deere, in a briefing. Much of the tech will come this fall and after that. He noted that the average farmer in the U.S. is over 58 and works 12 to 18 hours a day to grow food for us. And he said the American Farm Bureau Federation estimates there are roughly 2.4 million farm jobs that need to be filled annually; and the agricultural work force continues to shrink. (This is my hint to the anti-immigration crowd). John Deere’s autonomous 9RX Tractor. Farmers can oversee it using an app. While each of these industries experiences their own set of challenges, a commonality across all is skilled labor availability. In construction, about 80% percent of contractors struggle to find skilled labor. And in commercial landscaping, 86% of landscaping business owners can’t find labor to fill open positions, he said. “They have to figure out how to do

Read More »

2025 playbook for enterprise AI success, from agents to evals

Join our daily and weekly newsletters for the latest updates and exclusive content on industry-leading AI coverage. Learn More 2025 is poised to be a pivotal year for enterprise AI. The past year has seen rapid innovation, and this year will see the same. This has made it more critical than ever to revisit your AI strategy to stay competitive and create value for your customers. From scaling AI agents to optimizing costs, here are the five critical areas enterprises should prioritize for their AI strategy this year. 1. Agents: the next generation of automation AI agents are no longer theoretical. In 2025, they’re indispensable tools for enterprises looking to streamline operations and enhance customer interactions. Unlike traditional software, agents powered by large language models (LLMs) can make nuanced decisions, navigate complex multi-step tasks, and integrate seamlessly with tools and APIs. At the start of 2024, agents were not ready for prime time, making frustrating mistakes like hallucinating URLs. They started getting better as frontier large language models themselves improved. “Let me put it this way,” said Sam Witteveen, cofounder of Red Dragon, a company that develops agents for companies, and that recently reviewed the 48 agents it built last year. “Interestingly, the ones that we built at the start of the year, a lot of those worked way better at the end of the year just because the models got better.” Witteveen shared this in the video podcast we filmed to discuss these five big trends in detail. Models are getting better and hallucinating less, and they’re also being trained to do agentic tasks. Another feature that the model providers are researching is a way to use the LLM as a judge, and as models get cheaper (something we’ll cover below), companies can use three or more models to

Read More »

OpenAI’s red teaming innovations define new essentials for security leaders in the AI era

Join our daily and weekly newsletters for the latest updates and exclusive content on industry-leading AI coverage. Learn More OpenAI has taken a more aggressive approach to red teaming than its AI competitors, demonstrating its security teams’ advanced capabilities in two areas: multi-step reinforcement and external red teaming. OpenAI recently released two papers that set a new competitive standard for improving the quality, reliability and safety of AI models in these two techniques and more. The first paper, “OpenAI’s Approach to External Red Teaming for AI Models and Systems,” reports that specialized teams outside the company have proven effective in uncovering vulnerabilities that might otherwise have made it into a released model because in-house testing techniques may have missed them. In the second paper, “Diverse and Effective Red Teaming with Auto-Generated Rewards and Multi-Step Reinforcement Learning,” OpenAI introduces an automated framework that relies on iterative reinforcement learning to generate a broad spectrum of novel, wide-ranging attacks. Going all-in on red teaming pays practical, competitive dividends It’s encouraging to see competitive intensity in red teaming growing among AI companies. When Anthropic released its AI red team guidelines in June of last year, it joined AI providers including Google, Microsoft, Nvidia, OpenAI, and even the U.S.’s National Institute of Standards and Technology (NIST), which all had released red teaming frameworks. Investing heavily in red teaming yields tangible benefits for security leaders in any organization. OpenAI’s paper on external red teaming provides a detailed analysis of how the company strives to create specialized external teams that include cybersecurity and subject matter experts. The goal is to see if knowledgeable external teams can defeat models’ security perimeters and find gaps in their security, biases and controls that prompt-based testing couldn’t find. What makes OpenAI’s recent papers noteworthy is how well they define using human-in-the-middle

Read More »