Stay Ahead, Stay ONMINE

One-Tailed Vs. Two-Tailed Tests

Introduction If you’ve ever analyzed data using built-in t-test functions, such as those in R or SciPy, here’s a question for you: have you ever adjusted the default setting for the alternative hypothesis? If your answer is no—or if you’re not even sure what this means—then this blog post is for you! The alternative hypothesis parameter, commonly referred to as “one-tailed” versus “two-tailed” in statistics, defines the expected direction of the difference between control and treatment groups. In a two-tailed test, we assess whether there is any difference in mean values between the groups, without specifying a direction. A one-tailed test, on the other hand, posits a specific direction—whether the control group’s mean is either less than or greater than that of the treatment group. Choosing between one- and two-tailed hypotheses might seem like a minor detail, but it affects every stage of A/B testing: from test planning to Data Analysis and results interpretation. This article builds a theoretical foundation on why the hypothesis direction matters and explores the pros and cons of each approach. One-tailed vs. two-tailed hypothesis testing: Understanding the difference To understand the importance of choosing between one-tailed and two-tailed hypotheses, let’s briefly review the basics of the t-test, the commonly used method in A/B testing. Like other Hypothesis Testing methods, the t-test begins with a conservative assumption: there is no difference between the two groups (the null hypothesis). Only if we find strong evidence against this assumption can we reject the null hypothesis and conclude that the treatment has had an effect. But what qualifies as “strong evidence”? To that end, a rejection region is determined under the null hypothesis and all results that fall within this region are deemed so unlikely that we take them as evidence against the feasibility of the null hypothesis. The size of this rejection region is based on a predetermined probability, known as alpha (α), which represents the likelihood of incorrectly rejecting the null hypothesis.  What does this have to do with the direction of the alternative hypothesis? Quite a bit, actually. While the alpha level determines the size of the rejection region, the alternative hypothesis dictates its placement. In a one-tailed test, where we hypothesize a specific direction of difference, the rejection region is situated in only one tail of the distribution. For a hypothesized positive effect (e..g., that the treatment group mean is higher than the control group mean), the rejection region would lie in the right tail, creating a right-tailed test. Conversely, if we hypothesize a negative effect (e.g., that the treatment group mean is less than the control group mean), the rejection region would be placed in the left tail, resulting in a left-tailed test. In contrast, a two-tailed test allows for the detection of a difference in either direction, so the rejection region is split between both tails of the distribution. This accommodates the possibility of observing extreme values in either direction, whether the effect is positive or negative. To build intuition, let’s visualize how the rejection regions appear under the different hypotheses. Recall that according to the null hypothesis, the difference between the two groups should center around zero. Thanks to the central limit theorem, we also know this distribution approximates a normal distribution. Consequently, the rejection areas corresponding to the different alternative hypothesis look like that: Why does it make a difference? The choice of direction for the alternative hypothesis impacts the entire A/B testing process, starting with the planning phase—specifically, in determining the sample size. Sample size is calculated based on the desired power of the test, which is the probability of detecting a true difference between the two groups when one exists. To compute power, we examine the area under the alternative hypothesis that corresponds to the rejection region (since power reflects the ability to reject the null hypothesis when the alternative hypothesis is true). Since the direction of the hypothesis affects the size of this rejection region, power is generally lower for a two-tailed hypothesis. This is due to the rejection region being divided across both tails, making it more challenging to detect an effect in any one direction. The following graph illustrates the comparison between the two types of hypotheses. Note that the purple area is larger for the one-tailed hypothesis, compared to the two-tailed hypothesis: In practice, to maintain the desired power level, we compensate for the reduced power of a two-tailed hypothesis by increasing the sample size (Increasing sample size raises power, though the mechanics of this can be a topic for a separate article). Thus, the choice between one- and two-tailed hypotheses directly influences the required sample size for your test.  Beyond the planning phase, the choice of alternative hypothesis directly impacts the analysis and interpretation of results. There are cases where a test may reach significance with a one-tailed approach but not with a two-tailed one, and vice versa. Reviewing the previous graph can help illustrate this: for example, a result in the left tail might be significant under a two-tailed hypothesis but not under a right one-tailed hypothesis. Conversely, certain results might fall within the rejection region of a right one-tailed test but lie outside the rejection area in a two-tailed test. How to decide between a one-tailed and two-tailed hypothesis Let’s start with the bottom line: there’s no absolute right or wrong choice here. Both approaches are valid, and the primary consideration should be your specific business needs. To help you decide which option best suits your company, we’ll outline the key pros and cons of each. At first glance, a one-tailed alternative may appear to be the clear choice, as it often aligns better with business objectives. In industry applications, the focus is typically on improving specific metrics rather than exploring a treatment’s impact in both directions. This is especially relevant in A/B testing, where the goal is often to optimize conversion rates or enhance revenue. If the treatment doesn’t lead to a significant improvement the examined change won’t be implemented. Beyond this conceptual advantage, we have already mentioned one key benefit of a one-tailed hypothesis: it requires a smaller sample size. Thus, choosing a one-tailed alternative can save both time and resources. To illustrate this advantage, the following graphs show the required sample sizes for one- and two-tailed hypotheses with different power levels (alpha is set at 5%). In this context, the decision between one- and two-tailed hypotheses becomes particularly important in sequential testing—a method that allows for ongoing data analysis without inflating the alpha level. Here, selecting a one-tailed test can significantly reduce the duration of the test, enabling faster decision-making, which is especially valuable in dynamic business environments where prompt responses are essential. However, don’t be too quick to dismiss the two-tailed hypothesis! It has its own advantages. In some business contexts, the ability to detect “negative significant results” is a major benefit. As one client once shared, he preferred negative significant results over inconclusive ones because they offer valuable learning opportunities. Even if the outcome wasn’t as expected, he could conclude that the treatment had a negative effect and gain insights into the product. Another benefit of two-tailed tests is their straightforward interpretation using confidence intervals (CIs). In two-tailed tests, a CI that doesn’t include zero directly indicates significance, making it easier for practitioners to interpret results at a glance. This clarity is particularly appealing since CIs are widely used in A/B testing platforms. Conversely, with one-tailed tests, a significant result might still include zero in the CI, potentially leading to confusion or mistrust in the findings. Although one-sided confidence intervals can be employed with one-tailed tests, this practice is less common. Conclusions By adjusting a single parameter, you can significantly impact your A/B testing: specifically, the sample size you need to collect and the interpretation of the results. When deciding between one- and two-tailed hypotheses, consider factors such as the available sample size, the advantages of detecting negative effects, and the convenience of aligning confidence intervals (CIs) with hypothesis testing. Ultimately, this decision should be made thoughtfully, taking into account what best fits your business needs. (Note: all the images in this post were created by the author)

Introduction

If you’ve ever analyzed data using built-in t-test functions, such as those in R or SciPy, here’s a question for you: have you ever adjusted the default setting for the alternative hypothesis? If your answer is no—or if you’re not even sure what this means—then this blog post is for you!

The alternative hypothesis parameter, commonly referred to as “one-tailed” versus “two-tailed” in statistics, defines the expected direction of the difference between control and treatment groups. In a two-tailed test, we assess whether there is any difference in mean values between the groups, without specifying a direction. A one-tailed test, on the other hand, posits a specific direction—whether the control group’s mean is either less than or greater than that of the treatment group.

Choosing between one- and two-tailed hypotheses might seem like a minor detail, but it affects every stage of A/B testing: from test planning to Data Analysis and results interpretation. This article builds a theoretical foundation on why the hypothesis direction matters and explores the pros and cons of each approach.

One-tailed vs. two-tailed hypothesis testing: Understanding the difference

To understand the importance of choosing between one-tailed and two-tailed hypotheses, let’s briefly review the basics of the t-test, the commonly used method in A/B testing. Like other Hypothesis Testing methods, the t-test begins with a conservative assumption: there is no difference between the two groups (the null hypothesis). Only if we find strong evidence against this assumption can we reject the null hypothesis and conclude that the treatment has had an effect.

But what qualifies as “strong evidence”? To that end, a rejection region is determined under the null hypothesis and all results that fall within this region are deemed so unlikely that we take them as evidence against the feasibility of the null hypothesis. The size of this rejection region is based on a predetermined probability, known as alpha (α), which represents the likelihood of incorrectly rejecting the null hypothesis. 

What does this have to do with the direction of the alternative hypothesis? Quite a bit, actually. While the alpha level determines the size of the rejection region, the alternative hypothesis dictates its placement. In a one-tailed test, where we hypothesize a specific direction of difference, the rejection region is situated in only one tail of the distribution. For a hypothesized positive effect (e..g., that the treatment group mean is higher than the control group mean), the rejection region would lie in the right tail, creating a right-tailed test. Conversely, if we hypothesize a negative effect (e.g., that the treatment group mean is less than the control group mean), the rejection region would be placed in the left tail, resulting in a left-tailed test.

In contrast, a two-tailed test allows for the detection of a difference in either direction, so the rejection region is split between both tails of the distribution. This accommodates the possibility of observing extreme values in either direction, whether the effect is positive or negative.

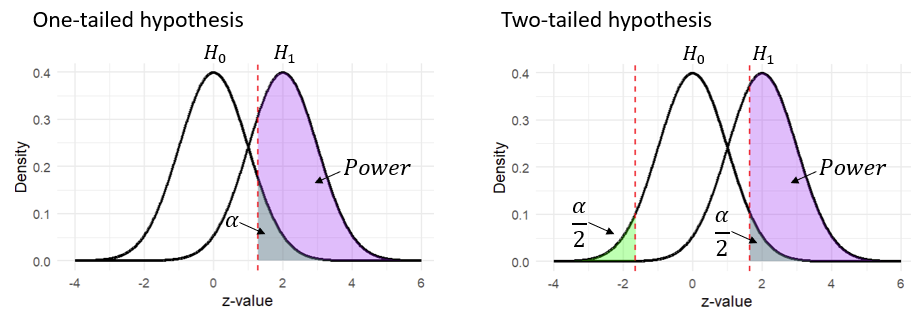
To build intuition, let’s visualize how the rejection regions appear under the different hypotheses. Recall that according to the null hypothesis, the difference between the two groups should center around zero. Thanks to the central limit theorem, we also know this distribution approximates a normal distribution. Consequently, the rejection areas corresponding to the different alternative hypothesis look like that:

Why does it make a difference?

The choice of direction for the alternative hypothesis impacts the entire A/B testing process, starting with the planning phase—specifically, in determining the sample size. Sample size is calculated based on the desired power of the test, which is the probability of detecting a true difference between the two groups when one exists. To compute power, we examine the area under the alternative hypothesis that corresponds to the rejection region (since power reflects the ability to reject the null hypothesis when the alternative hypothesis is true).

Since the direction of the hypothesis affects the size of this rejection region, power is generally lower for a two-tailed hypothesis. This is due to the rejection region being divided across both tails, making it more challenging to detect an effect in any one direction. The following graph illustrates the comparison between the two types of hypotheses. Note that the purple area is larger for the one-tailed hypothesis, compared to the two-tailed hypothesis:
In practice, to maintain the desired power level, we compensate for the reduced power of a two-tailed hypothesis by increasing the sample size (Increasing sample size raises power, though the mechanics of this can be a topic for a separate article). Thus, the choice between one- and two-tailed hypotheses directly influences the required sample size for your test. 

Beyond the planning phase, the choice of alternative hypothesis directly impacts the analysis and interpretation of results. There are cases where a test may reach significance with a one-tailed approach but not with a two-tailed one, and vice versa. Reviewing the previous graph can help illustrate this: for example, a result in the left tail might be significant under a two-tailed hypothesis but not under a right one-tailed hypothesis. Conversely, certain results might fall within the rejection region of a right one-tailed test but lie outside the rejection area in a two-tailed test.

How to decide between a one-tailed and two-tailed hypothesis

Let’s start with the bottom line: there’s no absolute right or wrong choice here. Both approaches are valid, and the primary consideration should be your specific business needs. To help you decide which option best suits your company, we’ll outline the key pros and cons of each.

At first glance, a one-tailed alternative may appear to be the clear choice, as it often aligns better with business objectives. In industry applications, the focus is typically on improving specific metrics rather than exploring a treatment’s impact in both directions. This is especially relevant in A/B testing, where the goal is often to optimize conversion rates or enhance revenue. If the treatment doesn’t lead to a significant improvement the examined change won’t be implemented.

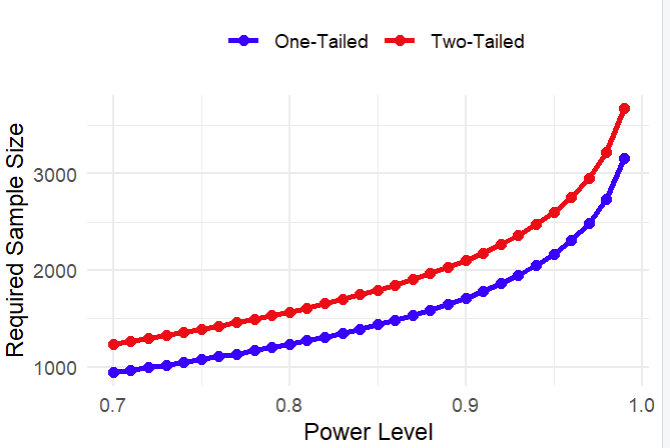
Beyond this conceptual advantage, we have already mentioned one key benefit of a one-tailed hypothesis: it requires a smaller sample size. Thus, choosing a one-tailed alternative can save both time and resources. To illustrate this advantage, the following graphs show the required sample sizes for one- and two-tailed hypotheses with different power levels (alpha is set at 5%).
In this context, the decision between one- and two-tailed hypotheses becomes particularly important in sequential testing—a method that allows for ongoing data analysis without inflating the alpha level. Here, selecting a one-tailed test can significantly reduce the duration of the test, enabling faster decision-making, which is especially valuable in dynamic business environments where prompt responses are essential.

However, don’t be too quick to dismiss the two-tailed hypothesis! It has its own advantages. In some business contexts, the ability to detect “negative significant results” is a major benefit. As one client once shared, he preferred negative significant results over inconclusive ones because they offer valuable learning opportunities. Even if the outcome wasn’t as expected, he could conclude that the treatment had a negative effect and gain insights into the product.

Another benefit of two-tailed tests is their straightforward interpretation using confidence intervals (CIs). In two-tailed tests, a CI that doesn’t include zero directly indicates significance, making it easier for practitioners to interpret results at a glance. This clarity is particularly appealing since CIs are widely used in A/B testing platforms. Conversely, with one-tailed tests, a significant result might still include zero in the CI, potentially leading to confusion or mistrust in the findings. Although one-sided confidence intervals can be employed with one-tailed tests, this practice is less common.

Conclusions

By adjusting a single parameter, you can significantly impact your A/B testing: specifically, the sample size you need to collect and the interpretation of the results. When deciding between one- and two-tailed hypotheses, consider factors such as the available sample size, the advantages of detecting negative effects, and the convenience of aligning confidence intervals (CIs) with hypothesis testing. Ultimately, this decision should be made thoughtfully, taking into account what best fits your business needs.

(Note: all the images in this post were created by the author)

Shape
Shape
Stay Ahead

Explore More Insights

Stay ahead with more perspectives on cutting-edge power, infrastructure, energy,  bitcoin and AI solutions. Explore these articles to uncover strategies and insights shaping the future of industries.

Shape

HPE Aruba boosts NAC security, adds GreenLake ‘kill switch’

In addition, HPE Aruba tightened the integration between HPE Aruba Networking Central and HPE OpsRamp, the technology HPE bought in 2023 to manage hybrid and multicloud environments. OpsRamp monitors elements such as third-party switches, access points, firewalls, and routers. Tighter integration expands the ability to natively monitor third-party devices from vendors such as Cisco, Arista,

Read More »

ADNOC Sells $1.5B in Debut Sukuk

Abu Dhabi National Oil Co. sold debt compliant with Islamic rules for the first time as the state producer works to diversify funding. Adnoc raised $1.5 billion with its debut 10-year, Shariah-compliant notes at an annual profit rate of 4.75 percent, it said Monday. The firm had set the spread on the sukuk, as the securities are known, at 60 basis points over US Treasuries. The company didn’t say what it will use for funds for. It is raising cash amid markets that have become increasingly volatile in recent months as uncertainty over the scale of US tariffs sparks economic-growth concerns and caution around planned investments. Adnoc has been expanding globally with deals for chemical producers and stakes in US LNG export projects. The United Arab Emirates, a member of the Organization of the Petroleum Exporting Countries, is seeking international investors as it looks to reduce reliance on its own oil revenue. Hedge funds, lawyers and traders have increasingly moved to Dubai and Abu Dhabi to capture new growth opportunities and tap into finance from private and sovereign investors. Standard Chartered Bank was the global coordinator and joint sukuk structuring bank for the debt. Other regional and international lenders also participated. Adnoc sold the notes through Adnoc Murban, its dedicated vehicle for issuing debt. The deal follows a $4 billion debut bond sale last year and a $3 billion green loan signed with Japan Bank for International Cooperation. Two banks in the UAE – Mashreq Bank and Ajman Bank – have tapped dollar sukuk markets since President Donald Trump imposed the steepest US tariffs in a century on April 2. Dubai’s developers are also looking to tap fixed-income investors despite the turmoil. Central banks from the European Union, the UK, Canada and Australia have all cut interest rates recently amid threats of

Read More »

Equinor sees first-quarter profit grow year-on-year

Equinor saw its first-quarter profit grow, making an adjusted operating income of $8.65bn compared to the $7.53bn seen in the first quarter of 2024. According to its results, the Norwegian energy major also beat the $8.51bn previously predicted in a poll of 20 analysts Equinor compiled. Equinor president and CEO Anders Opedal said: “Equinor delivers strong financial results in the first quarter. I am pleased to see the good operational performance and solid production capturing higher gas prices. With the current market uncertainties, Equinor’s core objective is safe, stable and cost efficient operations and resilience through a strong balance sheet.” “We maintain a competitive capital distribution and expect to deliver a total of $9bn in 2025.” However, Equinor’s total equity production was down, coming in at 2.123 million boe per day in the first quarter compared to 2.164 million boe in the same quarter of last year. The company said that it experienced a strong operational performance for most of the fields on Norwegian continental shelf, with Johan Sverdrup and Troll fields helping offset the impact of the shut-in at Sleipner B after the fire in fourth quarter 2024 and planned and unplanned maintenance at Hammerfest LNG. In addition, its total power generation from its renewable portfolio was 0.76 TWh, on par with the same period last year. Opedal added: “The production start-up of the Johan Castberg field strengthens Norway’s role as a reliable energy exporter to Europe. The field opens a new region in the Barents Sea and is expected to contribute to energy supply, value creation and ripple effects for at least 30 years to come.” However, he criticised the recent halt work order issued by the US government on the offshore construction of the company’s Empire Wind project. Having obtained the lease in 2017, the project was

Read More »

Wood receives FEED contract for Belgian green plastics plant

Aberdeen-based Wood has received a multi-million dollar FEED contract from Belgian group Vioneo to deliver the design for a plant to create fossil-free plastics from green methanol. Based in Antwerp, Belgium, the plant will have the capacity to produce 300 kilotonnes per year of high-quality, virgin polyethylene and polypropylene plastics made from green methanol and free of fossil feedstock. Wood said the renewably powered and energy efficient plant will be the first facility in the world capable of achieving this at industrial scale. These plastics will be fully traceable, segregated and carbon negative, enabling customers to reduce Scope 3 emissions. In addition, the production of these plastics does not affect the feedstock supply for food production, ensuring the project is sustainable. Wood president of eastern hemisphere projects Gerry Traynor said: “Demand for fossil-free plastics in Europe is growing and Vioneo is developing an exciting project that will accelerate the decarbonisation of Europe’s plastics sector. “Wood’s strong track record of delivering world-first projects of this size and scale will support Vioneo’s ambitions of becoming the leading producer of fossil-free plastics in Europe.” Wood will apply its extensive experience in delivering sustainable and innovative engineering solutions to large-scale energy transition projects. Vioneo is owned by AP Moller Holding, the investment arm of AP Moller Group and was launched as part of its commitment to advancing green methanol production and promoting sustainable practices in the plastics industry. Vioneo CEO Alex Hogan said: “Vioneo is driving the transition of the plastics industry by demonstrating the economic viability of large-scale, cleaner production using green methanol instead of fossil fuels. “This initiative offers Europe the opportunity to lead the €5 trillion chemicals and materials sector’s defossilisation. Our collaboration with Wood is a crucial step in realising this vision.” Wood group has been under a renewed takeover

Read More »

Marula-1X Well offshore Namibia Turns Up Dry

The Marula-1X well in Block 2913B (Petroleum Exploration License 56) offshore Namibia has turned up dry after a drilling campaign that reached a total depth of 6,460 meters (21,195 feet). Africa Oil Corp. said that the well targeted Albian-aged sandstones within the Marula fan complex, some 47 kilometers (29.2 miles) south of the Venus-1X well. The well was drilled by the Deepsea Mira semi-submersible drilling rig, Africa Oil said in a media release. A comprehensive analysis of the well results is now underway. The well will now be demobilized. Impact Oil & Gas Ltd. has a 9.5 percent interest in Blocks 2912 and 2913B in Namibia’s Orange Basin. Africa Oil, through its 39.5 percent interest in Impact, has an effective interest of approximately 3.8 percent in these blocks. Block 2913B contains the Venus light oil discovery. Block 2913B spans about 8,215 square kilometers (3171 square miles) with water depths reaching 3,000 meters (9842 feet). Impact became the Operator of the license in 2014, initially acquiring 2D seismic data followed by 3D seismic data, which delineated the Venus prospect. In 2017, TotalEnergies joined Impact and Namcor, contributing deep-water drilling expertise to the joint venture. In 2019, QatarEnergy became part of the joint venture. “The farm-down agreement between Impact and TotalEnergies that was completed last year provides full carry of Impact’s exploration and development costs on Blocks 2912 and 2913B through to first commercial production from these blocks. This presents us with an attractive opportunity set to test different geological plays on these blocks at no upfront cost”, Africa Oil President and CEO Roger Tucker said. “The initial data from the Marula-1X well confirms a disappointing outcome for the Marula prospect. However, the full suite of well data acquired will be integrated into the evaluation to realize the block’s full potential”, Siraj

Read More »

No 10 defends net-zero policies after Tony Blair brands them ‘irrational’

No 10 has defended the government’s net-zero policies after Tony Blair attacked any strategy that limits fossil fuels in the short term as “doomed to fail”. The Labour former prime minister argued that the current climate approach “isn’t working,” with the debate having “become irrational” and people “turning away from the politics of the issue because they believe the proposed solutions are not founded on good policy”. “In developed countries, voters feel they’re being asked to make financial sacrifices and changes in lifestyle when they know that their impact on global emissions is minimal,” Blair wrote in the foreword for a report from the Tony Blair Institute (TBI). But Downing Street insisted that Sir Keir Starmer’s government’s approach has a minimal impact on people’s lives. A No 10 spokesman told reporters: “We will reach net zero in a way that treads lightly on people’s lives, not by telling them how to live or behave. “Clearly there’s going to be a range of views but we are of the view that this is an enormous economic opportunity and as the Prime Minister has made clear, we’re already seeing the benefit.” The official highlighted the economic opportunities in the push towards renewables. “Our position remains unchanged. “This is about the net-zero sector growing three times faster than the economy as a whole,” the spokesman said. “We’re seizing these opportunities to drive growth, lower bills and boost living standards.” Addressing Blair’s criticism of plans based on quickly curtailing fossil fuels, the official said: “We’ve always said that oil and gas have a role to play in the future of energy supply.” In his intervention, Blair wrote that global trends including the expected rise in fossil fuel use and the doubling of airline travel over the next 20 years undermine current climate policies. “These

Read More »

U.S. companies sign deal to help bring nuclear energy to Poland

Dive Brief: A consortium of U.S. companies Westinghouse Electric Co. and Bechtel signed an engineering development agreement with a state-owned Polish company on Monday, committing to partner on the design and construction of Poland’s first nuclear power plant. “This initiative originally started during the first Trump Administration and could ultimately accommodate a total of six [Westinghouse AP1000 nuclear power plants] across two sites,” the Department of Energy said in a release.  Energy Secretary Chris Wright oversaw the signing of the agreement. In a keynote speech the same day at the Three Seas Business Forum in Poland, he criticized the climate policies of the U.S. and Europe, saying, “The two biggest ‘climate solutions’ in the coming decades are the same as they were in the last two decades, natural gas and nuclear, for the simple reason that they work.” Dive Insight: Wright said Friday at the World Economy Summit that the current Trump administration is aiming for a nuclear “renaissance,” Semafor reported. Before his appointment as energy secretary, Wright served as the chairman and CEO of oil and gas services company Liberty Energy and as a board member of the small modular nuclear reactor company Oklo. Under Wright’s leadership, Liberty invested $10 million in geothermal company Fervo Energy.  The secretary’s nomination drew controversy due in part to a video he posted on LinkedIn in 2023 which begins with him stating, “There is no climate crisis, and we’re not in the midst of an energy transition, either.” But during Wright’s confirmation hearing in the Senate, he said, “Climate change is a real and global phenomenon.” In February, Wright said that DOE under his leadership will focus on expanding baseload generation and supporting the development of next-generation nuclear technology, along with fossil fuels, geothermal and hydropower.  During his keynote, the secretary said that “climate

Read More »

Nvidia AI supercluster targets agents, reasoning models on Oracle Cloud

Oracle has previously built an OCI Supercluster with 65,536 Nvidia H200 GPUs using the older Hopper GPU technology and no CPU that offers up to 260 exaflops of peak FP8 performance. According to the blog post announcing the availability, the Blackwell GPUs are available via Oracle’s public, government, and sovereign clouds, as well as in customer-owned data centers through its OCI Dedicated Region and Alloy offerings. Oracle joins a growing list of cloud providers that have made the GB200 NVL72 system available, including Google, CoreWeave and Lambda. In addition, Microsoft offers the GB200 GPUs, though they are not deployed as an NVL72 machine.

Read More »

Deep Data Center: Neoclouds as the ‘Picks and Shovels’ of the AI Gold Rush

In 1849, the discovery of gold in California ignited a frenzy, drawing prospectors from around the world in pursuit of quick fortune. While few struck it rich digging and sifting dirt, a different class of entrepreneurs quietly prospered: those who supplied the miners with the tools of the trade. From picks and shovels to tents and provisions, these providers became indispensable to the gold rush, profiting handsomely regardless of who found gold. Today, a new gold rush is underway, in pursuit of artificial intelligence. And just like the days of yore, the real fortunes may lie not in the gold itself, but in the infrastructure and equipment that enable its extraction. This is where neocloud players and chipmakers are positioned, representing themselves as the fundamental enablers of the AI revolution. Neoclouds: The Essential Tools and Implements of AI Innovation The AI boom has sparked a frenzy of innovation, investment, and competition. From generative AI applications like ChatGPT to autonomous systems and personalized recommendations, AI is rapidly transforming industries. Yet, behind every groundbreaking AI model lies an unsung hero: the infrastructure powering it. Enter neocloud providers—the specialized cloud platforms delivering the GPU horsepower that fuels AI’s meteoric rise. Let’s examine how neoclouds represent the “picks and shovels” of the AI gold rush, used for extracting the essential backbone of AI innovation. Neoclouds are emerging as indispensable players in the AI ecosystem, offering tailored solutions for compute-intensive workloads such as training large language models (LLMs) and performing high-speed inference. Unlike traditional hyperscalers (e.g., AWS, Azure, Google Cloud), which cater to a broad range of use cases, neoclouds focus exclusively on optimizing infrastructure for AI and machine learning applications. This specialization allows them to deliver superior performance at a lower cost, making them the go-to choice for startups, enterprises, and research institutions alike.

Read More »

Soluna Computing: Innovating Renewable Computing for Sustainable Data Centers

Dorothy 1A & 1B (Texas): These twin 25 MW facilities are powered by wind and serve Bitcoin hosting and mining workloads. Together, they consumed over 112,000 MWh of curtailed energy in 2024, demonstrating the impact of Soluna’s model. Dorothy 2 (Texas): Currently under construction and scheduled for energization in Q4 2025, this 48 MW site will increase Soluna’s hosting and mining capacity by 64%. Sophie (Kentucky): A 25 MW grid- and hydro-powered hosting center with a strong cost profile and consistent output. Project Grace (Texas): A 2 MW AI pilot project in development, part of Soluna’s transition into HPC and machine learning. Project Kati (Texas): With 166 MW split between Bitcoin and AI hosting, this project recently exited the Electric Reliability Council of Texas, Inc. planning phase and is expected to energize between 2025 and 2027. Project Rosa (Texas): A 187 MW flagship project co-located with wind assets, aimed at both Bitcoin and AI workloads. Land and power agreements were secured by the company in early 2025. These developments are part of the company’s broader effort to tackle both energy waste and infrastructure bottlenecks. Soluna’s behind-the-meter design enables flexibility to draw from the grid or directly from renewable sources, maximizing energy value while minimizing emissions. Competition is Fierce and a Narrower Focus Better Serves the Business In 2024, Soluna tested the waters of providing AI services via a  GPU-as-a-Service through a partnership with HPE, branded as Project Ada. The pilot aimed to rent out cloud GPUs for AI developers and LLM training. However, due to oversupply in the GPU market, delayed product rollouts (like NVIDIA’s H200), and poor demand economics, Soluna terminated the contract in March 2025. The cancellation of the contract with HPE frees up resources for Soluna to focus on what it believes the company does best: designing

Read More »

Quiet Genius at the Neutral Line: How Onics Filters Are Reshaping the Future of Data Center Power Efficiency

Why Harmonics Matter In a typical data center, nonlinear loads—like servers, UPS systems, and switch-mode power supplies—introduce harmonic distortion into the electrical system. These harmonics travel along the neutral and ground conductors, where they can increase current flow, cause overheating in transformers, and shorten the lifespan of critical power infrastructure. More subtly, they waste power through reactive losses that don’t show up on a basic utility bill, but do show up in heat, inefficiency, and increased infrastructure stress. Traditional mitigation approaches—like active harmonic filters or isolation transformers—are complex, expensive, and often require custom integration and ongoing maintenance. That’s where Onics’ solution stands out. It’s engineered as a shunt-style, low-pass filter: a passive device that sits in parallel with the circuit, quietly siphoning off problematic harmonics without interrupting operations.  The result? Lower apparent power demand, reduced electrical losses, and a quieter, more stable current environment—especially on the neutral line, where cumulative harmonic effects often peak. Behind the Numbers: Real-World Impact While the Onics filters offer a passive complement to traditional mitigation strategies, they aren’t intended to replace active harmonic filters or isolation transformers in systems that require them—they work best as a low-complexity enhancement to existing power quality designs. LoPilato says Onics has deployed its filters in mission-critical environments ranging from enterprise edge to large colos, and the data is consistent. In one example, a 6 MW data center saw a verified 9.2% reduction in energy consumption after deploying Onics filters at key electrical junctures. Another facility clocked in at 17.8% savings across its lighting and support loads, thanks in part to improved power factor and reduced transformer strain. The filters work by targeting high-frequency distortion—typically above the 3rd harmonic and up through the 35th. By passively attenuating this range, the system reduces reactive current on the neutral and helps stabilize

Read More »

New IEA Report Contrasts Energy Bottlenecks with Opportunities for AI and Data Center Growth

Artificial intelligence has, without question, crossed the threshold—from a speculative academic pursuit into the defining infrastructure of 21st-century commerce, governance, and innovation. What began in the realm of research labs and open-source models is now embedded in the capital stack of every major hyperscaler, semiconductor roadmap, and national industrial strategy. But as AI scales, so does its energy footprint. From Nvidia-powered GPU clusters to exascale training farms, the conversation across boardrooms and site selection teams has fundamentally shifted. It’s no longer just about compute density, thermal loads, or software frameworks. It’s about power—how to find it, finance it, future-proof it, and increasingly, how to generate it onsite. That refrain—“It’s all about power now”—has moved from a whisper to a full-throated consensus across the data center industry. The latest report from the International Energy Agency (IEA) gives this refrain global context and hard numbers, affirming what developers, utilities, and infrastructure operators have already sensed on the ground: the AI revolution will be throttled or propelled by the availability of scalable, sustainable, and dispatchable electricity. Why Energy Is the Real Bottleneck to Intelligence at Scale The major new IEA report puts it plainly: The transformative promise of AI will be throttled—or unleashed—by the world’s ability to deliver scalable, reliable, and sustainable electricity. The stakes are enormous. Countries that can supply the power AI craves will shape the future. Those that can’t may find themselves sidelined. Importantly, while AI poses clear challenges, the report emphasizes how it also offers solutions: from optimizing energy grids and reducing emissions in industrial sectors to enhancing energy security by supporting infrastructure defenses against cyberattacks. The report calls for immediate investments in both energy generation and grid capabilities, as well as stronger collaboration between the tech and energy sectors to avoid critical bottlenecks. The IEA advises that, for countries

Read More »

Colorado Eyes the AI Data Center Boom with Bold Incentive Push

Even as states work on legislation to limit data center development, it is clear that some locations are looking to get a bigger piece of the huge data center spending that the AI wave has created. It appears that politicians in Colorado took a look around and thought to themselves “Why is all that data center building going to Texas and Arizona? What’s wrong with the Rocky Mountain State?” Taking a page from the proven playbook that has gotten data centers built all over the country, Colorado is trying to jump on the financial incentives for data center development bandwagon. SB 24-085: A Statewide Strategy to Attract Data Center Investment Looking to significantly boost its appeal as a data center hub, Colorado is now considering Senate Bill 24-085, currently making its way through the state legislature. Sponsored by Senators Priola and Buckner and Representatives Parenti and Weinberg, this legislation promises substantial economic incentives in the form of state sales and use tax rebates for new data centers established within the state from fiscal year 2026 through 2033. Colorado hopes to position itself strategically to compete with neighboring states in attracting lucrative tech investments and high-skilled jobs. According to DataCenterMap.com, there are currently 53 data centers in the state, almost all located in the Denver area, but they are predominantly smaller facilities. In today’s era of massive AI-driven hyperscale expansion, Colorado is rarely mentioned in the same breath as major AI data center markets.  Some local communities have passed their own incentive packages, but SB 24-085 aims to offer a unified, statewide framework that can also help mitigate growing NIMBY (Not In My Backyard) sentiment around new developments. The Details: How SB 24-085 Works The bill, titled “Concerning a rebate of the state sales and use tax paid on new digital infrastructure

Read More »

Microsoft will invest $80B in AI data centers in fiscal 2025

And Microsoft isn’t the only one that is ramping up its investments into AI-enabled data centers. Rival cloud service providers are all investing in either upgrading or opening new data centers to capture a larger chunk of business from developers and users of large language models (LLMs).  In a report published in October 2024, Bloomberg Intelligence estimated that demand for generative AI would push Microsoft, AWS, Google, Oracle, Meta, and Apple would between them devote $200 billion to capex in 2025, up from $110 billion in 2023. Microsoft is one of the biggest spenders, followed closely by Google and AWS, Bloomberg Intelligence said. Its estimate of Microsoft’s capital spending on AI, at $62.4 billion for calendar 2025, is lower than Smith’s claim that the company will invest $80 billion in the fiscal year to June 30, 2025. Both figures, though, are way higher than Microsoft’s 2020 capital expenditure of “just” $17.6 billion. The majority of the increased spending is tied to cloud services and the expansion of AI infrastructure needed to provide compute capacity for OpenAI workloads. Separately, last October Amazon CEO Andy Jassy said his company planned total capex spend of $75 billion in 2024 and even more in 2025, with much of it going to AWS, its cloud computing division.

Read More »

John Deere unveils more autonomous farm machines to address skill labor shortage

Join our daily and weekly newsletters for the latest updates and exclusive content on industry-leading AI coverage. Learn More Self-driving tractors might be the path to self-driving cars. John Deere has revealed a new line of autonomous machines and tech across agriculture, construction and commercial landscaping. The Moline, Illinois-based John Deere has been in business for 187 years, yet it’s been a regular as a non-tech company showing off technology at the big tech trade show in Las Vegas and is back at CES 2025 with more autonomous tractors and other vehicles. This is not something we usually cover, but John Deere has a lot of data that is interesting in the big picture of tech. The message from the company is that there aren’t enough skilled farm laborers to do the work that its customers need. It’s been a challenge for most of the last two decades, said Jahmy Hindman, CTO at John Deere, in a briefing. Much of the tech will come this fall and after that. He noted that the average farmer in the U.S. is over 58 and works 12 to 18 hours a day to grow food for us. And he said the American Farm Bureau Federation estimates there are roughly 2.4 million farm jobs that need to be filled annually; and the agricultural work force continues to shrink. (This is my hint to the anti-immigration crowd). John Deere’s autonomous 9RX Tractor. Farmers can oversee it using an app. While each of these industries experiences their own set of challenges, a commonality across all is skilled labor availability. In construction, about 80% percent of contractors struggle to find skilled labor. And in commercial landscaping, 86% of landscaping business owners can’t find labor to fill open positions, he said. “They have to figure out how to do

Read More »

2025 playbook for enterprise AI success, from agents to evals

Join our daily and weekly newsletters for the latest updates and exclusive content on industry-leading AI coverage. Learn More 2025 is poised to be a pivotal year for enterprise AI. The past year has seen rapid innovation, and this year will see the same. This has made it more critical than ever to revisit your AI strategy to stay competitive and create value for your customers. From scaling AI agents to optimizing costs, here are the five critical areas enterprises should prioritize for their AI strategy this year. 1. Agents: the next generation of automation AI agents are no longer theoretical. In 2025, they’re indispensable tools for enterprises looking to streamline operations and enhance customer interactions. Unlike traditional software, agents powered by large language models (LLMs) can make nuanced decisions, navigate complex multi-step tasks, and integrate seamlessly with tools and APIs. At the start of 2024, agents were not ready for prime time, making frustrating mistakes like hallucinating URLs. They started getting better as frontier large language models themselves improved. “Let me put it this way,” said Sam Witteveen, cofounder of Red Dragon, a company that develops agents for companies, and that recently reviewed the 48 agents it built last year. “Interestingly, the ones that we built at the start of the year, a lot of those worked way better at the end of the year just because the models got better.” Witteveen shared this in the video podcast we filmed to discuss these five big trends in detail. Models are getting better and hallucinating less, and they’re also being trained to do agentic tasks. Another feature that the model providers are researching is a way to use the LLM as a judge, and as models get cheaper (something we’ll cover below), companies can use three or more models to

Read More »

OpenAI’s red teaming innovations define new essentials for security leaders in the AI era

Join our daily and weekly newsletters for the latest updates and exclusive content on industry-leading AI coverage. Learn More OpenAI has taken a more aggressive approach to red teaming than its AI competitors, demonstrating its security teams’ advanced capabilities in two areas: multi-step reinforcement and external red teaming. OpenAI recently released two papers that set a new competitive standard for improving the quality, reliability and safety of AI models in these two techniques and more. The first paper, “OpenAI’s Approach to External Red Teaming for AI Models and Systems,” reports that specialized teams outside the company have proven effective in uncovering vulnerabilities that might otherwise have made it into a released model because in-house testing techniques may have missed them. In the second paper, “Diverse and Effective Red Teaming with Auto-Generated Rewards and Multi-Step Reinforcement Learning,” OpenAI introduces an automated framework that relies on iterative reinforcement learning to generate a broad spectrum of novel, wide-ranging attacks. Going all-in on red teaming pays practical, competitive dividends It’s encouraging to see competitive intensity in red teaming growing among AI companies. When Anthropic released its AI red team guidelines in June of last year, it joined AI providers including Google, Microsoft, Nvidia, OpenAI, and even the U.S.’s National Institute of Standards and Technology (NIST), which all had released red teaming frameworks. Investing heavily in red teaming yields tangible benefits for security leaders in any organization. OpenAI’s paper on external red teaming provides a detailed analysis of how the company strives to create specialized external teams that include cybersecurity and subject matter experts. The goal is to see if knowledgeable external teams can defeat models’ security perimeters and find gaps in their security, biases and controls that prompt-based testing couldn’t find. What makes OpenAI’s recent papers noteworthy is how well they define using human-in-the-middle

Read More »