Stay Ahead, Stay ONMINE

Mastering the Poisson Distribution: Intuition and Foundations

You’ve probably used the normal distribution one or two times too many. We all have — It’s a true workhorse. But sometimes, we run into problems. For instance, when predicting or forecasting values, simulating data given a particular data-generating process, or when we try to visualise model output and explain them intuitively to non-technical stakeholders. Suddenly, things don’t make much sense: can a user really have made -8 clicks on the banner? Or even 4.3 clicks? Both are examples of how count data doesn’t behave. I’ve found that better encapsulating the data generating process into my modelling has been key to having sensible model output. Using the Poisson distribution when it was appropriate has not only helped me convey more meaningful insights to stakeholders, but it has also enabled me to produce more accurate error estimates, better Inference, and sound decision-making. In this post, my aim is to help you get a deep intuitive feel for the Poisson distribution by walking through example applications, and taking a dive into the foundations — the maths. I hope you learn not just how it works, but also why it works, and when to apply the distribution. If you know of a resource that has helped you grasp the concepts in this blog particularly well, you’re invited to share it in the comments! Outline Examples and use cases: Let’s walk through some use cases and sharpen the intuition I just mentioned. Along the way, the relevance of the Poisson Distribution will become clear. The foundations: Next, let’s break down the equation into its individual components. By studying each part, we’ll uncover why the distribution works the way it does. The assumptions: Equipped with some formality, it will be easier to understand the assumptions that power the distribution, and at the same time set the boundaries for when it works, and when not. When real life deviates from the model: Finally, let’s explore the special links that the Poisson distribution has with the Negative Binomial distribution. Understanding these relationships can deepen our understanding, and provide alternatives when the Poisson distribution is not suited for the job. Example in an online marketplace I chose to deep dive into the Poisson distribution because it frequently appears in my day-to-day work. Online marketplaces rely on binary user choices from two sides: a seller deciding to list an item and a buyer deciding to make a purchase. These micro-behaviours drive supply and demand, both in the short and long term. A marketplace is born. Binary choices aggregate into counts — the sum of many such decisions as they occur. Attach a timeframe to this counting process, and you’ll start seeing Poisson distributions everywhere. Let’s explore a concrete example next. Consider a seller on a platform. In a given month, the seller may or may not list an item for sale (a binary choice). We would only know if she did because then we’d have a measurable count of the event. Nothing stops her from listing another item in the same month. If she does, we count those events. The total could be zero for an inactive seller or, say, 120 for a highly engaged seller. Over several months, we would observe a varying number of listed items by this seller — sometimes fewer, sometimes more — hovering around an average monthly listing rate. That is essentially a Poisson process. When we get to the assumptions section, you’ll see what we had to assume away to make this example work. Other examples Other phenomena that can be modelled with a Poisson distribution include: Sports analytics: The number of goals scored in a match between two teams. Queuing: Customers arriving at a help desk or customer support calls. Insurance: The number of claims made within a given period. Each of these examples warrants further inspection, but for the remainder of this post, we’ll use the marketplace example to illustrate the inner workings of the distribution. The mathy bit … or foundations. I find opening up the probability mass function (PMF) of distributions helpful to understanding why things work as they do. The PMF of the Poisson distribution goes like: Where λ is the rate parameter, and 𝑘 is the manifested count of the random variable (𝑘 = 0, 1, 2, 3, … events). Very neat and compact. The probability mass function of the Poisson distribution, for a few different lambdas. Contextualising λ and k: the marketplace example In the context of our earlier example — a seller listing items on our platform — λ represents the seller’s average monthly listings. As the expected monthly value for this seller, λ orchestrates the number of items she would list in a month. Note that λ is a Greek letter, so read: λ is a parameter that we can estimate from data. On the other hand, 𝑘 does not hold any information about the seller’s idiosyncratic behaviour. It’s the target value we set for the number of events that may happen to learn about its probability. The dual role of λ as the mean and variance When I said that λ orchestrates the number of monthly listings for the seller, I meant it quite literally. Namely, λ is both the expected value and variance of the distribution, indifferently, for all values of λ. This means that the mean-to-variance ratio (index of dispersion) is always 1. To put this into perspective, the normal distribution requires two parameters — 𝜇 and 𝜎², the average and variance respectively — to fully describe it. The Poisson distribution achieves the same with just one. Having to estimate only one parameter can be beneficial for parametric inference. Specifically, by reducing the variance of the model and increasing the statistical power. On the other hand, it can be too limiting of an assumption. Alternatives like the Negative Binomial distribution can alleviate this limitation. We’ll explore that later. Breaking down the probability mass function Now that we know the smallest building blocks, let’s zoom out one step: what is λᵏ, 𝑒^⁻λ, and 𝑘!, and more importantly, what is each of these components’ function in the whole? λᵏ is a weight that expresses how likely it is for 𝑘 events to happen, given that the expectation is λ. Note that “likely” here does not mean a probability, yet. It’s merely a signal strength. 𝑘! is a combinatorial correction so that we can say that the order of the events is irrelevant. The events are interchangeable. 𝑒^⁻λ normalises the integral of the PMF function to sum up to 1. It’s called the partition function of exponential-family distributions. In more detail, λᵏ relates the observed value 𝑘 to the expected value of the random variable, λ. Intuitively, more probability mass lies around the expected value. Hence, if the observed value lies close to the expectation, the probability of occurring is larger than the probability of an observation far removed from the expectation. Before we can cross-check our intuition with the numerical behaviour of λᵏ, we need to consider what 𝑘! does. Interchangeable events Had we cared about the order of events, then each unique event could be ordered in 𝑘! ways. But because we don’t, and we deem each event interchangeable, we “divide out” 𝑘! from λᵏ to correct for the overcounting. Since λᵏ is an exponential term, the output will always be larger as 𝑘 grows, holding λ constant. That is the opposite of our intuition that there is maximum probability when λ = 𝑘, as the output is larger when 𝑘 = λ + 1. But now that we know about the interchangeable events assumption — and the overcounting issue — we know that we have to factor in 𝑘! like so: λᵏ 𝑒^⁻λ / 𝑘!, to see the behaviour we expect. Now let’s check the intuition of the relationship between λ and 𝑘 through λᵏ, corrected for 𝑘!. For the same λ, say λ = 4, we should see λᵏ 𝑒^⁻λ / 𝑘! to be smaller for values of 𝑘 that are far removed from 4, compared to values of 𝑘 that lie close to 4. Like so: inline code: 4²/2 = 8 is smaller than 4⁴/24 = 10.7. This is consistent with the intuition of a higher likelihood of 𝑘 when it’s near the expectation. The image below shows this relationship more generally, where you see that the output is larger as 𝑘 approaches λ. The probability mass function without the normalising component e^-lambda. The assumptions First, let’s get one thing off the table: the difference between a Poisson process, and the Poisson distribution. The process is a stochastic continuous-time model of points happening in given interval: 1D, a line; 2D, an area, or higher dimensions. We, data scientists, most often deal with the one-dimensional case, where the “line” is time, and the points are the events of interest — I dare to say. These are the assumptions of the Poisson process: The occurrence of one event does not affect the probability of a second event. Think of our seller going on to list another item tomorrow indifferently of having done so already today, or the one from five days ago for that matter. The point here is that there is no memory between events. The average rate at which events occur, is independent of any occurrence. In other words, no event that happened (or will happen) alters λ, which remains constant throughout the observed timeframe. In our seller example, this means that listing an item today does not increase or decrease the seller’s motivation or likelihood of listing another item tomorrow. Two events cannot occur at exactly the same instant. If we were to zoom at an infinite granular level on the timescale, no two listings could have been placed simultaneously; always sequentially. From these assumptions — no memory, constant rate, events happening alone — it follows that 1) any interval’s number of events is Poisson-distributed with parameter λₜ and 2) that disjoint intervals are independent — two key properties of a Poisson process. A Note on the distribution:The distribution simply describes probabilities for various numbers of counts in an interval. Strictly speaking, one can use the distribution pragmatically whenever the data is nonnegative, can be unbounded on the right, has mean λ, and reasonably models the data. It would be just convenient if the underlying process is a Poisson one, and actually justifies using the distribution. The marketplace example: Implications So, can we justify using the Poisson distribution for our marketplace example? Let’s open up the assumptions of a Poisson process and take the test. Constant λ Why it may fail: The seller has patterned online activity; holidays; promotions; listings are seasonal goods. Consequence: λ is not constant, leading to overdispersion (mean-to-variance ratio is larger than 1, or to temporal patterns. Independence and memorylessness Why it may fail: The propensity to list again is higher after a successful listing, or conversely, listing once depletes the stock and intervenes with the propensity of listing again. Consequence: Two events are no longer independent, as the occurrence of one informs the occurrence of the other. Simultaneous events Why it may fail: Batch-listing, a new feature, was introduced to help the sellers. Consequence: Multiple listings would come online at the same time, clumped together, and they would be counted simultaneously. Balancing rigour and pragmatism As Data Scientists on the job, we may feel trapped between rigour and pragmatism. The three steps below should give you a sound foundation to decide on which side to err, when the Poisson distribution falls short: Pinpoint your goal: is it inference, simulation or prediction, and is it about high-stakes output? List the worst thing that can happen, and the cost of it for the business. Identify the problem and solution: why does the Poisson distribution not fit, and what can you do about it? list 2-3 solutions, including changing nothing. Balance gains and costs: Will your workaround improve things, or make it worse? and at what cost: interpretability, new assumptions introduced and resources used. Does it help you in achieving your goal? That said, here are some counters I use when needed. When real life deviates from your model Everything described so far pertains to the standard, or homogenous, Poisson process. But what if reality begs for something different? In the next section, we’ll cover two extensions of the Poisson distribution when the constant λ assumption does not hold. These are not mutually exclusive, but neither they are the same: Time-varying λ: a single seller whose listing rate ramps up before holidays and slows down afterward Mixed Poisson distribution: multiple sellers listing items, each with their own λ can be seen as a mixture of various Poisson processes Time-varying λ The first extension allows λ to have its own value for each time t. The PMF then becomes Where the number of events 𝐾(𝑇) in an interval 𝑇 follows the Poisson distribution with a rate no longer equal to a fixed λ, but one equal to: More intuitively, integrating over the interval 𝑡 to 𝑡 + 𝑖 gives us a single number: the expected value of events over that interval. The integral will vary by each arbitrary interval, and that’s what makes λ change over time. To understand how that integration works, it was helpful for me to think of it like this: if the interval 𝑡 to 𝑡₁ integrates to 3, and 𝑡₁ to 𝑡₂ integrates to 5, then the interval 𝑡 to 𝑡₂ integrates to 8 = 3 + 5. That’s the two expectations summed up, and now the expectation of the entire interval. Practical implication One may want to modeling the expected value of the Poisson distribution as a function of time. For instance, to model an overall change in trend, or seasonality. In generative model notation: Time may be a continuous variable, or an arbitrary function of it. Process-varying λ: Mixed Poisson distribution But then there’s a gotcha. Remember when I said that λ has a dual role as the mean and variance? That still applies here. Looking at the “relaxed” PMF*, the only thing that changes is that λ can vary freely with time. But it’s still the one and only λ that orchestrates both the expected value and the dispersion of the PMF*. More precisely, 𝔼[𝑋] = Var(𝑋) still holds. There are various reasons for this constraint not to hold in reality. Model misspecification, event interdependence and unaccounted for heterogeneity could be the issues at hand. I’d like to focus on the latter case, as it justifies the Negative Binomial distribution — one of the topics I promised to open up. Heterogeneity and overdispersionImagine we are not dealing with one seller, but with 10 of them listing at different intensity levels, λᵢ, where 𝑖 = 1, 2, 3, …, 10 sellers. Then, essentially, we have 10 Poisson processes going on. If we unify the processes and estimate the grand λ, we simplify the mixture away. Meaning, we get a correct estimate of all sellers on average, but the resulting grand λ is naive and does not know about the original spread of λᵢ. It still assumes that the variance and mean are equal, as per the axioms of the distribution. This will lead to overdispersion and, in turn, to underestimated errors. Ultimately, it inflates the false positive rate and drives poor decision-making. We need a way to embrace the heterogeneity amongst sellers’ λᵢ. Negative binomial: Extending the Poisson distributionAmong the few ways one can look at the Negative Binomial distribution, one way is to see it as a compound Poisson process — 10 sellers, sounds familiar yet? That means multiple independent Poisson processes are summed up to a single one. Mathematically, first we draw λ from a Gamma distribution: λ ~ Γ(r, θ), then we draw the count 𝑋 | λ ~ Poisson(λ). In one image, it is as if we would sample from plenty Poisson distributions, corresponding to each seller. A negative Binomial distribution arises from many Poisson distributions. The more exposing alias of the Negative binomial distribution is Gamma-Poisson mixture distribution, and now we know why: the dictating λ comes from a continuous mixture. That’s what we needed to explain the heterogeneity amongst sellers. Let’s simulate this scenario to gain more intuition. Gamma mixture of lambda. First, we draw λᵢ from a Gamma distribution: λᵢ ~ Γ(r, θ). Intuitively, the Gamma distribution tells us about the variety in the intensity — listing rate — amongst the sellers. On a practical note, one can instill their assumptions about the degree of heterogeneity in this step of the model: how different are sellers? By varying the levels of heterogeneity, one can observe the impact on the final Poisson-like distribution. Doing this type of checks (i.e., posterior predictive check), is common in Bayesian modeling, where the assumptions are set explicitly. Gamma-Poisson mixture distribution versus homogenous Poisson distribution. Τhe dashed line reflects λ, which is 4 for both distributions. In the second step, we plug the obtained λ into the Poisson distribution: 𝑋 | λ ~ Poisson(λ), and obtain a Poisson-like distribution that represents the summed subprocesses. Notably, this unified process has a larger dispersion than expected from a homogeneous Poisson distribution, but it is in line with the Gamma mixture of λ. Heterogeneous λ and inference A practical consequence of introducing flexibility into your assumed distribution is that inference becomes more challenging. More parameters (i.e., the Gamma parameters) need to be estimated. Parameters act as flexible explainers of the data, tending to overfit and explain away variance in your variable. The more parameters you have, the better the explanation may seem, but the model also becomes more susceptible to noise in the data. Higher variance reduces the power to identify a difference in means, if one exists, because — well — it gets lost in the variance. Countering the loss of power Confirm whether you indeed need to extend the standard Poisson distribution. If not, simplify to the simplest, most fit model. A quick check on overdispersion may suffice for this. Pin down the estimates of the Gamma mixture distribution parameters using regularising, informative priors (think: Bayes). During my research process for writing this blog, I learned a great deal about the connective tissue underlying all of this: how the binomial distribution plays a fundamental role in the processes we’ve discussed. And while I’d love to ramble on about this, I’ll save it for another post, perhaps. In the meantime, feel free to share your understanding in the comments section below 👍. Conclusion The Poisson distribution is a simple distribution that can be highly suitable for modelling count data. However, when the assumptions do not hold, one can extend the distribution by allowing the rate parameter to vary as a function of time or other factors, or by assuming subprocesses that collectively make up the count data. This added flexibility can address the limitations, but it comes at a cost: increased flexibility in your modelling raises the variance and, consequently, undermines the statistical power of your model. If your end goal is inference, you may want to think twice and consider exploring simpler models for the data. Alternatively, switch to the Bayesian paradigm and leverage its built-in solution to regularise estimates: informative priors. I hope this has given you what you came for — a better intuition about the Poisson distribution. I’d love to hear your thoughts about this in the comments! Unless otherwise noted, all images are by the author.Originally published at https://aalvarezperez.github.io on January 5, 2025.

You’ve probably used the normal distribution one or two times too many. We all have — It’s a true workhorse. But sometimes, we run into problems. For instance, when predicting or forecasting values, simulating data given a particular data-generating process, or when we try to visualise model output and explain them intuitively to non-technical stakeholders. Suddenly, things don’t make much sense: can a user really have made -8 clicks on the banner? Or even 4.3 clicks? Both are examples of how count data doesn’t behave.

I’ve found that better encapsulating the data generating process into my modelling has been key to having sensible model output. Using the Poisson distribution when it was appropriate has not only helped me convey more meaningful insights to stakeholders, but it has also enabled me to produce more accurate error estimates, better Inference, and sound decision-making.

In this post, my aim is to help you get a deep intuitive feel for the Poisson distribution by walking through example applications, and taking a dive into the foundations — the maths. I hope you learn not just how it works, but also why it works, and when to apply the distribution.

If you know of a resource that has helped you grasp the concepts in this blog particularly well, you’re invited to share it in the comments!

Outline

  1. Examples and use cases: Let’s walk through some use cases and sharpen the intuition I just mentioned. Along the way, the relevance of the Poisson Distribution will become clear.
  2. The foundations: Next, let’s break down the equation into its individual components. By studying each part, we’ll uncover why the distribution works the way it does.
  3. The assumptions: Equipped with some formality, it will be easier to understand the assumptions that power the distribution, and at the same time set the boundaries for when it works, and when not.
  4. When real life deviates from the model: Finally, let’s explore the special links that the Poisson distribution has with the Negative Binomial distribution. Understanding these relationships can deepen our understanding, and provide alternatives when the Poisson distribution is not suited for the job.

Example in an online marketplace

I chose to deep dive into the Poisson distribution because it frequently appears in my day-to-day work. Online marketplaces rely on binary user choices from two sides: a seller deciding to list an item and a buyer deciding to make a purchase. These micro-behaviours drive supply and demand, both in the short and long term. A marketplace is born.

Binary choices aggregate into counts — the sum of many such decisions as they occur. Attach a timeframe to this counting process, and you’ll start seeing Poisson distributions everywhere. Let’s explore a concrete example next.

Consider a seller on a platform. In a given month, the seller may or may not list an item for sale (a binary choice). We would only know if she did because then we’d have a measurable count of the event. Nothing stops her from listing another item in the same month. If she does, we count those events. The total could be zero for an inactive seller or, say, 120 for a highly engaged seller.

Over several months, we would observe a varying number of listed items by this seller — sometimes fewer, sometimes more — hovering around an average monthly listing rate. That is essentially a Poisson process. When we get to the assumptions section, you’ll see what we had to assume away to make this example work.

Other examples

Other phenomena that can be modelled with a Poisson distribution include:

  • Sports analytics: The number of goals scored in a match between two teams.
  • Queuing: Customers arriving at a help desk or customer support calls.
  • Insurance: The number of claims made within a given period.

Each of these examples warrants further inspection, but for the remainder of this post, we’ll use the marketplace example to illustrate the inner workings of the distribution.

The mathy bit

… or foundations.

I find opening up the probability mass function (PMF) of distributions helpful to understanding why things work as they do. The PMF of the Poisson distribution goes like:

Where λ is the rate parameter, and 𝑘 is the manifested count of the random variable (𝑘 = 0, 1, 2, 3, … events). Very neat and compact.
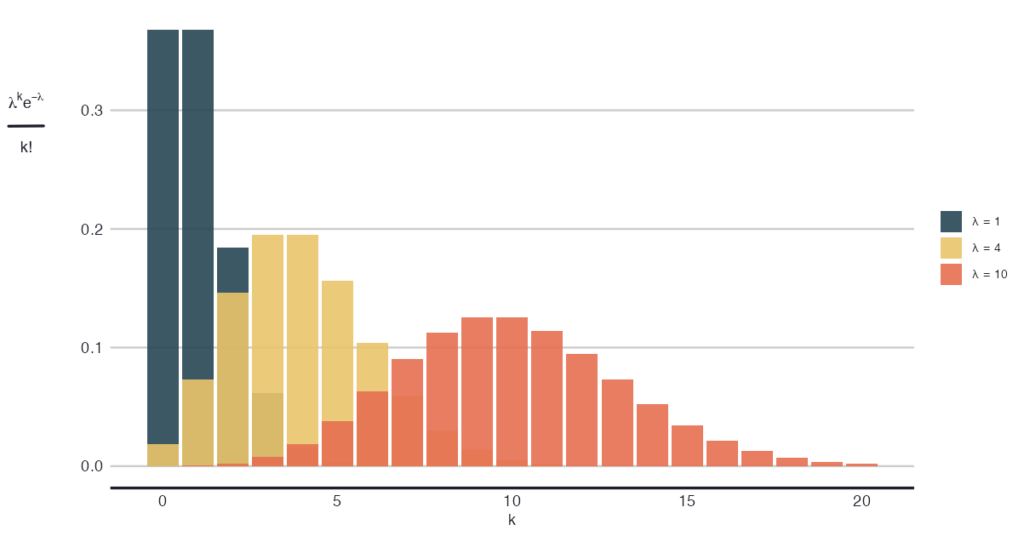
Graph: The probability mass function of the Poisson distribution, for a few different lambdas.
The probability mass function of the Poisson distribution, for a few different lambdas.

Contextualising λ and k: the marketplace example

In the context of our earlier example — a seller listing items on our platform — λ represents the seller’s average monthly listings. As the expected monthly value for this seller, λ orchestrates the number of items she would list in a month. Note that λ is a Greek letter, so read: λ is a parameter that we can estimate from data. On the other hand, 𝑘 does not hold any information about the seller’s idiosyncratic behaviour. It’s the target value we set for the number of events that may happen to learn about its probability.

The dual role of λ as the mean and variance

When I said that λ orchestrates the number of monthly listings for the seller, I meant it quite literally. Namely, λ is both the expected value and variance of the distribution, indifferently, for all values of λ. This means that the mean-to-variance ratio (index of dispersion) is always 1.

To put this into perspective, the normal distribution requires two parameters — 𝜇 and 𝜎², the average and variance respectively — to fully describe it. The Poisson distribution achieves the same with just one.

Having to estimate only one parameter can be beneficial for parametric inference. Specifically, by reducing the variance of the model and increasing the statistical power. On the other hand, it can be too limiting of an assumption. Alternatives like the Negative Binomial distribution can alleviate this limitation. We’ll explore that later.

Breaking down the probability mass function

Now that we know the smallest building blocks, let’s zoom out one step: what is λᵏ, 𝑒^⁻λ, and 𝑘!, and more importantly, what is each of these components’ function in the whole?

  • λᵏ is a weight that expresses how likely it is for 𝑘 events to happen, given that the expectation is λ. Note that “likely” here does not mean a probability, yet. It’s merely a signal strength.
  • 𝑘! is a combinatorial correction so that we can say that the order of the events is irrelevant. The events are interchangeable.
  • 𝑒^⁻λ normalises the integral of the PMF function to sum up to 1. It’s called the partition function of exponential-family distributions.

In more detail, λᵏ relates the observed value 𝑘 to the expected value of the random variable, λ. Intuitively, more probability mass lies around the expected value. Hence, if the observed value lies close to the expectation, the probability of occurring is larger than the probability of an observation far removed from the expectation. Before we can cross-check our intuition with the numerical behaviour of λᵏ, we need to consider what 𝑘! does.

Interchangeable events

Had we cared about the order of events, then each unique event could be ordered in 𝑘! ways. But because we don’t, and we deem each event interchangeable, we “divide out” 𝑘! from λᵏ to correct for the overcounting.

Since λᵏ is an exponential term, the output will always be larger as 𝑘 grows, holding λ constant. That is the opposite of our intuition that there is maximum probability when λ = 𝑘, as the output is larger when 𝑘 = λ + 1. But now that we know about the interchangeable events assumption — and the overcounting issue — we know that we have to factor in 𝑘! like so: λᵏ 𝑒^⁻λ / 𝑘!, to see the behaviour we expect.

Now let’s check the intuition of the relationship between λ and 𝑘 through λᵏ, corrected for 𝑘!. For the same λ, say λ = 4, we should see λᵏ 𝑒^⁻λ / 𝑘! to be smaller for values of 𝑘 that are far removed from 4, compared to values of 𝑘 that lie close to 4. Like so: inline code: 4²/2 = 8 is smaller than 4⁴/24 = 10.7. This is consistent with the intuition of a higher likelihood of 𝑘 when it’s near the expectation. The image below shows this relationship more generally, where you see that the output is larger as 𝑘 approaches λ.
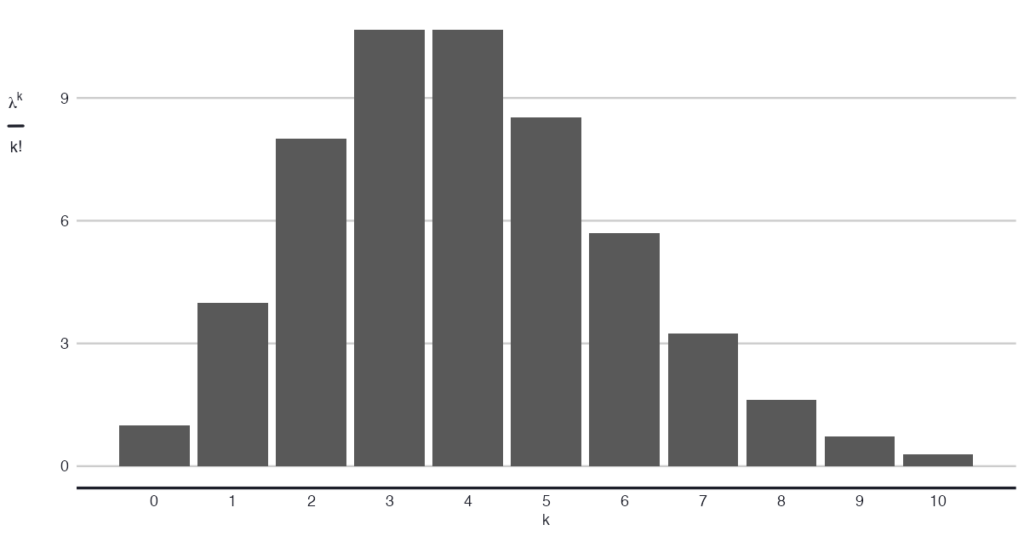
Graph: The probability mass function without the normalising component e^-lambda.
The probability mass function without the normalising component e^-lambda.

The assumptions

First, let’s get one thing off the table: the difference between a Poisson process, and the Poisson distribution. The process is a stochastic continuous-time model of points happening in given interval: 1D, a line; 2D, an area, or higher dimensions. We, data scientists, most often deal with the one-dimensional case, where the “line” is time, and the points are the events of interest — I dare to say.

These are the assumptions of the Poisson process:

  1. The occurrence of one event does not affect the probability of a second event. Think of our seller going on to list another item tomorrow indifferently of having done so already today, or the one from five days ago for that matter. The point here is that there is no memory between events.
  2. The average rate at which events occur, is independent of any occurrence. In other words, no event that happened (or will happen) alters λ, which remains constant throughout the observed timeframe. In our seller example, this means that listing an item today does not increase or decrease the seller’s motivation or likelihood of listing another item tomorrow.
  3. Two events cannot occur at exactly the same instant. If we were to zoom at an infinite granular level on the timescale, no two listings could have been placed simultaneously; always sequentially.

From these assumptions — no memory, constant rate, events happening alone — it follows that 1) any interval’s number of events is Poisson-distributed with parameter λₜ and 2) that disjoint intervals are independent — two key properties of a Poisson process.

A Note on the distribution:
The distribution simply describes probabilities for various numbers of counts in an interval. Strictly speaking, one can use the distribution pragmatically whenever the data is nonnegative, can be unbounded on the right, has mean λ, and reasonably models the data. It would be just convenient if the underlying process is a Poisson one, and actually justifies using the distribution.

The marketplace example: Implications

So, can we justify using the Poisson distribution for our marketplace example? Let’s open up the assumptions of a Poisson process and take the test.

Constant λ

  • Why it may fail: The seller has patterned online activity; holidays; promotions; listings are seasonal goods.
  • Consequence: λ is not constant, leading to overdispersion (mean-to-variance ratio is larger than 1, or to temporal patterns.

Independence and memorylessness

  • Why it may fail: The propensity to list again is higher after a successful listing, or conversely, listing once depletes the stock and intervenes with the propensity of listing again.
  • Consequence: Two events are no longer independent, as the occurrence of one informs the occurrence of the other.

Simultaneous events

  • Why it may fail: Batch-listing, a new feature, was introduced to help the sellers.
  • Consequence: Multiple listings would come online at the same time, clumped together, and they would be counted simultaneously.

Balancing rigour and pragmatism

As Data Scientists on the job, we may feel trapped between rigour and pragmatism. The three steps below should give you a sound foundation to decide on which side to err, when the Poisson distribution falls short:

  1. Pinpoint your goal: is it inference, simulation or prediction, and is it about high-stakes output? List the worst thing that can happen, and the cost of it for the business.
  2. Identify the problem and solution: why does the Poisson distribution not fit, and what can you do about it? list 2-3 solutions, including changing nothing.
  3. Balance gains and costs: Will your workaround improve things, or make it worse? and at what cost: interpretability, new assumptions introduced and resources used. Does it help you in achieving your goal?

That said, here are some counters I use when needed.

When real life deviates from your model

Everything described so far pertains to the standard, or homogenous, Poisson process. But what if reality begs for something different?

In the next section, we’ll cover two extensions of the Poisson distribution when the constant λ assumption does not hold. These are not mutually exclusive, but neither they are the same:

  1. Time-varying λ: a single seller whose listing rate ramps up before holidays and slows down afterward
  2. Mixed Poisson distribution: multiple sellers listing items, each with their own λ can be seen as a mixture of various Poisson processes

Time-varying λ

The first extension allows λ to have its own value for each time t. The PMF then becomes

Where the number of events 𝐾(𝑇) in an interval 𝑇 follows the Poisson distribution with a rate no longer equal to a fixed λ, but one equal to:

More intuitively, integrating over the interval 𝑡 to 𝑡 + 𝑖 gives us a single number: the expected value of events over that interval. The integral will vary by each arbitrary interval, and that’s what makes λ change over time. To understand how that integration works, it was helpful for me to think of it like this: if the interval 𝑡 to 𝑡₁ integrates to 3, and 𝑡₁ to 𝑡₂ integrates to 5, then the interval 𝑡 to 𝑡₂ integrates to 8 = 3 + 5. That’s the two expectations summed up, and now the expectation of the entire interval.

Practical implication 
One may want to modeling the expected value of the Poisson distribution as a function of time. For instance, to model an overall change in trend, or seasonality. In generative model notation:

Time may be a continuous variable, or an arbitrary function of it.

Process-varying λ: Mixed Poisson distribution

But then there’s a gotcha. Remember when I said that λ has a dual role as the mean and variance? That still applies here. Looking at the “relaxed” PMF*, the only thing that changes is that λ can vary freely with time. But it’s still the one and only λ that orchestrates both the expected value and the dispersion of the PMF*. More precisely, 𝔼[𝑋] = Var(𝑋) still holds.

There are various reasons for this constraint not to hold in reality. Model misspecification, event interdependence and unaccounted for heterogeneity could be the issues at hand. I’d like to focus on the latter case, as it justifies the Negative Binomial distribution — one of the topics I promised to open up.

Heterogeneity and overdispersion
Imagine we are not dealing with one seller, but with 10 of them listing at different intensity levels, λᵢ, where 𝑖 = 1, 2, 3, …, 10 sellers. Then, essentially, we have 10 Poisson processes going on. If we unify the processes and estimate the grand λ, we simplify the mixture away. Meaning, we get a correct estimate of all sellers on average, but the resulting grand λ is naive and does not know about the original spread of λᵢ. It still assumes that the variance and mean are equal, as per the axioms of the distribution. This will lead to overdispersion and, in turn, to underestimated errors. Ultimately, it inflates the false positive rate and drives poor decision-making. We need a way to embrace the heterogeneity amongst sellers’ λᵢ.

Negative binomial: Extending the Poisson distribution
Among the few ways one can look at the Negative Binomial distribution, one way is to see it as a compound Poisson process — 10 sellers, sounds familiar yet? That means multiple independent Poisson processes are summed up to a single one. Mathematically, first we draw λ from a Gamma distribution: λ ~ Γ(r, θ), then we draw the count 𝑋 | λ ~ Poisson(λ).

In one image, it is as if we would sample from plenty Poisson distributions, corresponding to each seller.
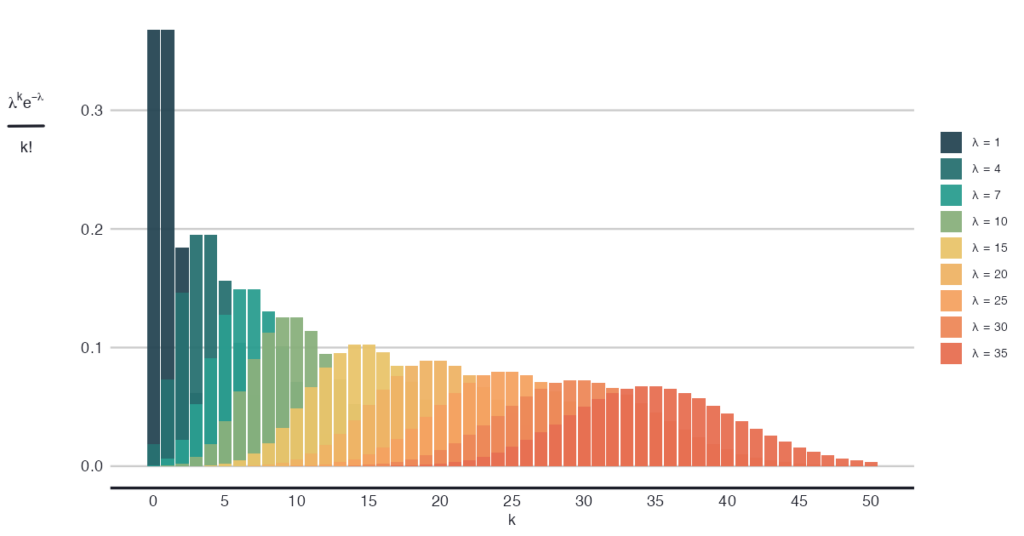
A negative Binomial distribution arises from many Poisson distributions.

The more exposing alias of the Negative binomial distribution is Gamma-Poisson mixture distribution, and now we know why: the dictating λ comes from a continuous mixture. That’s what we needed to explain the heterogeneity amongst sellers.

Let’s simulate this scenario to gain more intuition.
Gamma mixture of lambda.

First, we draw λᵢ from a Gamma distribution: λᵢ ~ Γ(r, θ). Intuitively, the Gamma distribution tells us about the variety in the intensity — listing rate — amongst the sellers.

On a practical note, one can instill their assumptions about the degree of heterogeneity in this step of the model: how different are sellers? By varying the levels of heterogeneity, one can observe the impact on the final Poisson-like distribution. Doing this type of checks (i.e., posterior predictive check), is common in Bayesian modeling, where the assumptions are set explicitly.
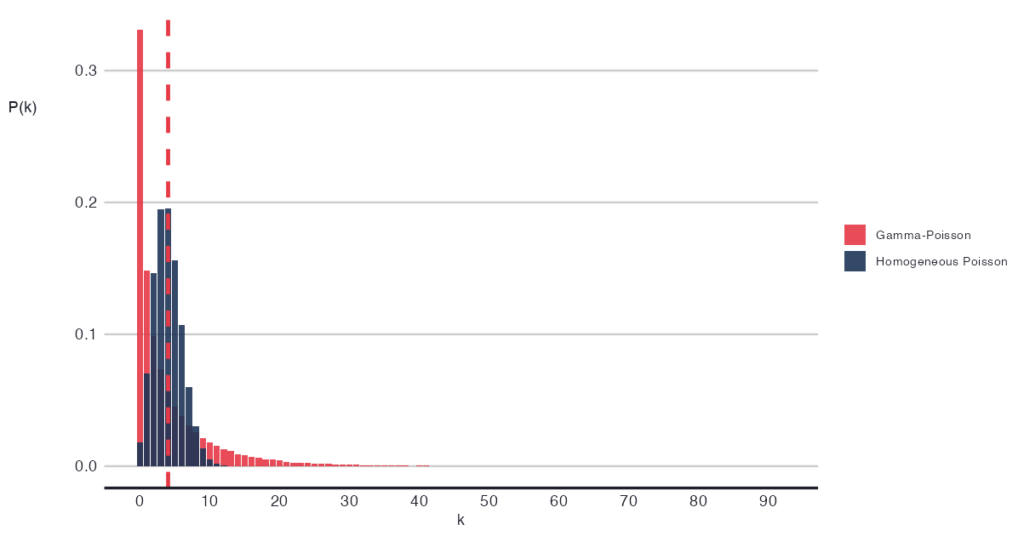
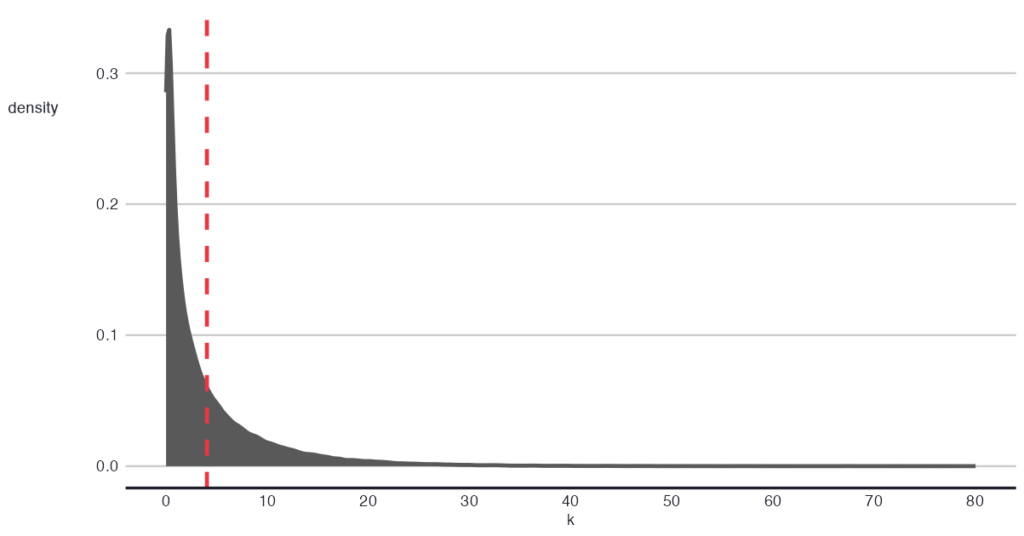
Gamma-Poisson mixture distribution versus homogenous Poisson distribution. Τhe dashed line reflects λ, which is 4 for both distributions.

In the second step, we plug the obtained λ into the Poisson distribution: 𝑋 | λ ~ Poisson(λ), and obtain a Poisson-like distribution that represents the summed subprocesses. Notably, this unified process has a larger dispersion than expected from a homogeneous Poisson distribution, but it is in line with the Gamma mixture of λ.

Heterogeneous λ and inference

A practical consequence of introducing flexibility into your assumed distribution is that inference becomes more challenging. More parameters (i.e., the Gamma parameters) need to be estimated. Parameters act as flexible explainers of the data, tending to overfit and explain away variance in your variable. The more parameters you have, the better the explanation may seem, but the model also becomes more susceptible to noise in the data. Higher variance reduces the power to identify a difference in means, if one exists, because — well — it gets lost in the variance.

Countering the loss of power

  1. Confirm whether you indeed need to extend the standard Poisson distribution. If not, simplify to the simplest, most fit model. A quick check on overdispersion may suffice for this.
  2. Pin down the estimates of the Gamma mixture distribution parameters using regularising, informative priors (think: Bayes).

During my research process for writing this blog, I learned a great deal about the connective tissue underlying all of this: how the binomial distribution plays a fundamental role in the processes we’ve discussed. And while I’d love to ramble on about this, I’ll save it for another post, perhaps. In the meantime, feel free to share your understanding in the comments section below 👍.

Conclusion

The Poisson distribution is a simple distribution that can be highly suitable for modelling count data. However, when the assumptions do not hold, one can extend the distribution by allowing the rate parameter to vary as a function of time or other factors, or by assuming subprocesses that collectively make up the count data. This added flexibility can address the limitations, but it comes at a cost: increased flexibility in your modelling raises the variance and, consequently, undermines the statistical power of your model.

If your end goal is inference, you may want to think twice and consider exploring simpler models for the data. Alternatively, switch to the Bayesian paradigm and leverage its built-in solution to regularise estimates: informative priors.

I hope this has given you what you came for — a better intuition about the Poisson distribution. I’d love to hear your thoughts about this in the comments!

Unless otherwise noted, all images are by the author.
Originally published at 
https://aalvarezperez.github.io on January 5, 2025.

Shape
Shape
Stay Ahead

Explore More Insights

Stay ahead with more perspectives on cutting-edge power, infrastructure, energy,  bitcoin and AI solutions. Explore these articles to uncover strategies and insights shaping the future of industries.

Shape

Ubuntu namespace vulnerability should be addressed quickly: Expert

Thus, “there is little impact of not ‘patching’ the vulnerability,” he said. “Organizations using centralized configuration tools like Ansible may deploy these changes with regularly scheduled maintenance or reboot windows.”  Features supposed to improve security Ironically, last October Ubuntu introduced AppArmor-based features to improve security by reducing the attack surface

Read More »

Google Cloud partners with mLogica to offer mainframe modernization

Other than the partnership with mLogica, Google Cloud also offers a variety of other mainframe migration tools, including Radis and G4 that can be employed to modernize specific applications. Enterprises can also use a combination of migration tools to modernize their mainframe applications. Some of these tools include the Gemini-powered

Read More »

Repsol Brings Schoders Greencoat as Partner in 400 MW Renewables Portfolio

Spanish energy company Repsol S.A. is partnering with Schroders Greencoat in a 400-megawatt (MW) wind and solar portfolio, valued at EUR 580 million ($626.4 million). Repsol said in a media release that Schroders Greencoat has acquired a 49 percent share in a portfolio of eight wind farms, with a total capacity of 300 MW, located in the northern Spanish provinces of Huesca, Zaragoza, and Teruel. The agreement also encompasses two solar facilities, amounting to 100 MW, in the province of Palencia. All of these assets are anticipated to become operational in the first half of 2025, Repsol said. Repsol said it will maintain control of the assets. In December 2024, Repsol arranged a long-term syndicated loan financing of EUR348 million ($375.8 million) with BBVA, Crédit Agricole CIB, Banco Sabadell, and the Official Spanish Credit Institute (ICO). “The alliance with a partner like Schroders Greencoat, one of the world’s leading renewable infrastructure managers, at a time when there is a wide offer of renewable assets for sale, highlights the quality and attractiveness of our portfolio in the market”, João Costeira, Repsol’s Executive Managing Director of Low Carbon Generation, said. This is the first investment by Schroders Greencoat Europe SCSp Fund, which secured over EUR 220 million ($237.6 million) in its initial November 2024 funding. The fund, aimed at a diverse European energy transition portfolio, will prioritize renewable energy infrastructure while also investing in grid upgrades, storage, hydrogen, efficiency, mobility, and renewable heat. “We are delighted to have made the Fund’s first acquisition following the first close. Our partnership with Repsol signifies a first step in our investment strategy and we look forward to working together to deliver long-term value for our clients with high quality of assets all supported by long-term offtake agreements”, Adam Basnett, Portfolio Manager for Schroders Greencoat, said.

Read More »

Shell Traders Haven’t Lost Money Over Last Decade

Shell Plc’s sprawling in-house trading operation — which includes oil, natural gas and electricity — hasn’t lost money during a single quarter over the last decade, said Chief Executive Officer Wael Sawan. The London-based energy giant keeps a tight lid on information about its trading business for competition reasons, but Sawan provided a peek during the company’s investor day presentation on Tuesday.  Over the last decade, Shell traders have delivered an average uplift on return on average capital employed of 2%, Sawan said at the New York Stock Exchange. They are expected to contribute 2% to 4% going forward, he said. Trading is core to Shell and will remain at the heart of the company’s future. Sawan outlined plans on Tuesday to boost investor returns for the rest of this decade by reinforcing the company’s position as the world’s top marketer of liquefied natural gas. The head of trading was recently elevated to the executive committee, giving trading a seat at the firm’s decision-making table.  WHAT DO YOU THINK? Generated by readers, the comments included herein do not reflect the views and opinions of Rigzone. All comments are subject to editorial review. Off-topic, inappropriate or insulting comments will be removed. MORE FROM THIS AUTHOR Bloomberg

Read More »

Rubio Warns Venezuela Against Attacking Guyana, Exxon

US Secretary of State Marco Rubio warned Venezuela that any attempt to invade Guyana or threaten Exxon Mobil Corp.’s operations in the country would be a “very bad move.”  Rubio spoke less than a month after a Venezuelan patrol ship entered Guyanese waters and positioned itself near a vessel contracted by Exxon, which is operating the world’s fastest-growing major oil field off the coast of the South American country.  “It would be a very bad day for the Venezuelan regime if they were to attack Guyana or attack Exxon Mobil,” Rubio said in the capital city of Georgetown on Thursday. “Suffice it to say that if that regime were to do something such as that, it would be a very bad move. It would be a big mistake. For them.” Venezuelan leader Nicolas Maduro reopened a border dispute more than a century after it was settled by international arbitration as he sought to galvanize supporters for last year’s presidential election. Maduro’s military and naval arsenal dwarfs Guyana’s, which was one of the continent’s poorest countries prior to Exxon’s 2015 discovery of oil.   Guyana’s President Irfaan Ali has been successful in rallying the international community behind the country’s dispute with Venezuela, with the UK, France and the US pledging support.  “We have a big Navy,” Rubio said. “It can get anywhere in the world.”  Rubio also said the US would bolster ties with Guyana, without getting into specifics. “We have commitments that exist today with Guyana,” he said. “We want to build on those, expand on those.”  Rubio also was scheduled to visit Suriname, which has sought to encourage oil exploration in offshore territory close to the Guyanese discoveries. WHAT DO YOU THINK? Generated by readers, the comments included herein do not reflect the views and opinions of Rigzone. All

Read More »

Oil Slips Despite Weekly Gain

Oil fell on concerns that the Trump administration’s tariff onslaught will reduce energy demand. West Texas Intermediate slid 0.8% to settle above $69 a barrel, retreating along with equity markets. Crude still notched its third straight weekly advance amid waning expectations of a near-term oversupply. The US is planning to impose tariffs on auto imports and so-called reciprocal levies next week, widening the global trade war. Oil traders face an uncertain outlook as they grapple with President Donald Trump’s policies and an OPEC+ plan to revive idled output. WTI futures have been rangebound for the past eight months, trading in a band of about $15 between the high $60s and low $80s. “US stocks are struggling, and longer-term demand fears are on the minds of most traders as tariffs begin to kick in on cars not manufactured in the US,” said Dennis Kissler, senior vice president for trading at BOK Financial Securities.   Earlier this week, Vitol’s chief executive officer said while there are some threats to supply, it’s generally adequate for the next couple of years. Meanwhile, Venezuela is boosting oil exports to China as the Trump administration deploys sanctions and secondary tariffs to squeeze the Latin American nation. Oil Prices: WTI for May delivery fell 0.8% to settle at $69.36 a barrel in New York. Futures gained 1.6% for the week. Brent for May settlement dipped 0.5% to settle at $73.63 a barrel. What do you think? We’d love to hear from you, join the conversation on the Rigzone Energy Network. The Rigzone Energy Network is a new social experience created for you and all energy professionals to Speak Up about our industry, share knowledge, connect with peers and industry insiders and engage in a professional community that will empower your career in energy. MORE FROM THIS AUTHOR

Read More »

Solong North Sea disaster ship pulls into Aberdeen

The Solong, a burned-out container ship badly damaged in a collision with a US oil tanker, has finally reached Aberdeen Friday morning. It arrived at South Harbour for “safe berthing” following days of intense salvage operations. The Portuguese-flagged vessel was towed to the Port of Aberdeen after crashing into the anchored Stena Immaculate off the East Yorkshire coast on March 10, triggering an explosion and fires. It has been the focus of ongoing salvage efforts after enduring extensive damage and a week-long fire. The Solong was accompanied by another vessel equipped with counter-pollution measures to prevent further environmental damage on its pas The Solong, a burned-out container ship badly damaged in a collision with a US oil tanker, has finally reached Aberdeen Friday morning. It arrived at South Harbour for “safe berthing” following days of intense salvage operations. The Portuguese-flagged vessel was towed to the Port of Aberdeen after crashing into the anchored Stena Immaculate off the East Yorkshire coast on March 10, triggering an explosion and fires. It has been the focus of ongoing salvage efforts after enduring extensive damage and a week-long fire. The Solong was accompanied by another vessel equipped with counter-pollution measures to prevent further environmental damage on its passage to Aberdeen. Solong sailor presumed dead The crash resulted in a tragic loss: one sailor from the Solong, 38-year-old Filipino national Mark Angelo Pernia, remains missing and is presumed dead. In total, rescuers saved 36 crew members from both ships. Meanwhile, the Solong’s captain, 59-year-old Vladimir Motin from St. Petersburg, Russia, has been arrested and charged with gross negligence manslaughter. © DC ThomsonCrew on board the burnt out Solong container ship being tugged into Aberdeen’s south harbour. Image: Kenny Elrick/DC Thomson © DC ThomsonImage: Kenny Elrick/DC Thomson © DC ThomsonImage: Kenny Elrick/DC Thomson. Drone / DJI

Read More »

USA Crude Oil Inventories Down 3.3MM Barrels WoW

U.S. commercial crude oil inventories, excluding those in the Strategic Petroleum Reserve (SPR), decreased by 3.3 million barrels from the week ending March 14 to the week ending March 21, the U.S. Energy Information Administration (EIA) highlighted in its latest weekly petroleum status report. This report was published on March 26 and included data for the week ending March 21. The EIA report showed that crude oil stocks, not including the SPR, stood at 433.6 million barrels on March 21, 437.0 million barrels on March 14, and 448.2 million barrels on March 22, 2024. Crude oil in the SPR stood at 396.1 million barrels on March 21, 395.9 million barrels on March 14, and 363.1 million barrels on March 22, 2024, the report outlined. The EIA report highlighted that data may not add up to totals due to independent rounding. Total petroleum stocks – including crude oil, total motor gasoline, fuel ethanol, kerosene type jet fuel, distillate fuel oil, residual fuel oil, propane/propylene, and other oils – stood at 1.600 billion barrels on March 21, the report showed. Total petroleum stocks were up 3.5 million barrels week on week and up 19.9 million barrels year on year, the report revealed. “At 433.6 million barrels, U.S. crude oil inventories are about five percent below the five year average for this time of year,” the EIA said in its latest weekly petroleum status report. “Total motor gasoline inventories decreased by 1.4 million barrels from last week and are two percent above the five year average for this time of year. Finished gasoline inventories increased and blending components inventories decreased last week,” it added. “Distillate fuel inventories decreased by 0.4 million barrels last week and are about seven percent below the five year average for this time of year. Propane/propylene inventories decreased by

Read More »

Airtel connects India with 100Tbps submarine cable

“Businesses are becoming increasingly global and digital-first, with industries such as financial services, data centers, and social media platforms relying heavily on real-time, uninterrupted data flow,” Sinha added. The 2Africa Pearls submarine cable system spans 45,000 kilometers, involving a consortium of global telecommunications leaders including Bayobab, China Mobile International, Meta, Orange, Telecom Egypt, Vodafone Group, and WIOCC. Alcatel Submarine Networks is responsible for the cable’s manufacturing and installation, the statement added. This cable system is part of a broader global effort to enhance international digital connectivity. Unlike traditional telecommunications infrastructure, the 2Africa Pearls project represents a collaborative approach to solving complex global communication challenges. “The 100 Tbps capacity of the 2Africa Pearls cable significantly surpasses most existing submarine cable systems, positioning India as a key hub for high-speed connectivity between Africa, Europe, and Asia,” said Prabhu Ram, VP for Industry Research Group at CyberMedia Research. According to Sinha, Airtel’s infrastructure now spans “over 400,000 route kilometers across 34+ cables, connecting 50 countries across five continents. This expansive infrastructure ensures businesses and individuals stay seamlessly connected, wherever they are.” Gogia further emphasizes the broader implications, noting, “What also stands out is the partnership behind this — Airtel working with Meta and center3 signals a broader shift. India is no longer just a consumer of global connectivity. We’re finally shaping the routes, not just using them.”

Read More »

Former Arista COO launches NextHop AI for customized networking infrastructure

Sadana argued that unlike traditional networking where an IT person can just plug a cable into a port and it works, AI networking requires intricate, custom solutions. The core challenge is creating highly optimized, efficient networking infrastructure that can support massive AI compute clusters with minimal inefficiencies. How NextHop is looking to change the game for hyperscale networking NextHop AI is working directly alongside its hyperscaler customers to develop and build customized networking solutions. “We are here to build the most efficient AI networking solutions that are out there,” Sadana said. More specifically, Sadana said that NextHop is looking to help hyperscalers in several ways including: Compressing product development cycles: “Companies that are doing things on their own can compress their product development cycle by six to 12 months when they partner with us,” he said. Exploring multiple technological alternatives: Sadana noted that hyperscalers might try and build on their own and will often only be able to explore one or two alternative approaches. With NextHop, Sadana said his company will enable them to explore four to six different alternatives. Achieving incremental efficiency gains: At the massive cloud scale that hyperscalers operate, even an incremental one percent improvement can have an oversized outcome. “You have to make AI clusters as efficient as possible for the world to use all the AI applications at the right cost structure, at the right economics, for this to be successful,” Sadana said. “So we are participating by making that infrastructure layer a lot more efficient for cloud customers, or the hyperscalers, which, in turn, of course, gives the benefits to all of these software companies trying to run AI applications in these cloud companies.” Technical innovations: Beyond traditional networking In terms of what the company is actually building now, NextHop is developing specialized network switches

Read More »

Microsoft abandons data center projects as OpenAI considers its own, hinting at a market shift

A potential ‘oversupply position’ In a new research note, TD Cowan analysts reportedly said that Microsoft has walked away from new data center projects in the US and Europe, purportedly due to an oversupply of compute clusters that power AI. This follows reports from TD Cowen in February that Microsoft had “cancelled leases in the US totaling a couple of hundred megawatts” of data center capacity. The researchers noted that the company’s pullback was a sign of it “potentially being in an oversupply position,” with demand forecasts lowered. OpenAI, for its part, has reportedly discussed purchasing billions of dollars’ worth of data storage hardware and software to increase its computing power and decrease its reliance on hyperscalers. This fits with its planned Stargate Project, a $500 billion, US President Donald Trump-endorsed initiative to build out its AI infrastructure in the US over the next four years. Based on the easing of exclusivity between the two companies, analysts say these moves aren’t surprising. “When looking at storage in the cloud — especially as it relates to use in AI — it is incredibly expensive,” said Matt Kimball, VP and principal analyst for data center compute and storage at Moor Insights & Strategy. “Those expenses climb even higher as the volume of storage and movement of data grows,” he pointed out. “It is only smart for any business to perform a cost analysis of whether storage is better managed in the cloud or on-prem, and moving forward in a direction that delivers the best performance, best security, and best operational efficiency at the lowest cost.”

Read More »

PEAK:AIO adds power, density to AI storage server

There is also the fact that many people working with AI are not IT professionals, such as professors, biochemists, scientists, doctors, clinicians, and they don’t have a traditional enterprise department or a data center. “It’s run by people that wouldn’t really know, nor want to know, what storage is,” he said. While the new AI Data Server is a Dell design, PEAK:AIO has worked with Lenovo, Supermicro, and HPE as well as Dell over the past four years, offering to convert their off the shelf storage servers into hyper fast, very AI-specific, cheap, specific storage servers that work with all the protocols at Nvidia, like NVLink, along with NFS and NVMe over Fabric. It also greatly increased storage capacity by going with 61TB drives from Solidigm. SSDs from the major server vendors typically maxed out at 15TB, according to the vendor. PEAK:AIO competes with VAST, WekaIO, NetApp, Pure Storage and many others in the growing AI workload storage arena. PEAK:AIO’s AI Data Server is available now.

Read More »

SoftBank to buy Ampere for $6.5B, fueling Arm-based server market competition

SoftBank’s announcement suggests Ampere will collaborate with other SBG companies, potentially creating a powerful ecosystem of Arm-based computing solutions. This collaboration could extend to SoftBank’s numerous portfolio companies, including Korean/Japanese web giant LY Corp, ByteDance (TikTok’s parent company), and various AI startups. If SoftBank successfully steers its portfolio companies toward Ampere processors, it could accelerate the shift away from x86 architecture in data centers worldwide. Questions remain about Arm’s server strategy The acquisition, however, raises questions about how SoftBank will balance its investments in both Arm and Ampere, given their potentially competing server CPU strategies. Arm’s recent move to design and sell its own server processors to Meta signaled a major strategic shift that already put it in direct competition with its own customers, including Qualcomm and Nvidia. “In technology licensing where an entity is both provider and competitor, boundaries are typically well-defined without special preferences beyond potential first-mover advantages,” Kawoosa explained. “Arm will likely continue making independent licensing decisions that serve its broader interests rather than favoring Ampere, as the company can’t risk alienating its established high-volume customers.” Industry analysts speculate that SoftBank might position Arm to focus on custom designs for hyperscale customers while allowing Ampere to dominate the market for more standardized server processors. Alternatively, the two companies could be merged or realigned to present a unified strategy against incumbents Intel and AMD. “While Arm currently dominates processor architecture, particularly for energy-efficient designs, the landscape isn’t static,” Kawoosa added. “The semiconductor industry is approaching a potential inflection point, and we may witness fundamental disruptions in the next 3-5 years — similar to how OpenAI transformed the AI landscape. SoftBank appears to be maximizing its Arm investments while preparing for this coming paradigm shift in processor architecture.”

Read More »

Nvidia, xAI and two energy giants join genAI infrastructure initiative

The new AIP members will “further strengthen the partnership’s technology leadership as the platform seeks to invest in new and expanded AI infrastructure. Nvidia will also continue in its role as a technical advisor to AIP, leveraging its expertise in accelerated computing and AI factories to inform the deployment of next-generation AI data center infrastructure,” the group’s statement said. “Additionally, GE Vernova and NextEra Energy have agreed to collaborate with AIP to accelerate the scaling of critical and diverse energy solutions for AI data centers. GE Vernova will also work with AIP and its partners on supply chain planning and in delivering innovative and high efficiency energy solutions.” The group claimed, without offering any specifics, that it “has attracted significant capital and partner interest since its inception in September 2024, highlighting the growing demand for AI-ready data centers and power solutions.” The statement said the group will try to raise “$30 billion in capital from investors, asset owners, and corporations, which in turn will mobilize up to $100 billion in total investment potential when including debt financing.” Forrester’s Nguyen also noted that the influence of two of the new members — xAI, owned by Elon Musk, along with Nvidia — could easily help with fundraising. Musk “with his connections, he does not make small quiet moves,” Nguyen said. “As for Nvidia, they are the face of AI. Everything they do attracts attention.” Info-Tech’s Bickley said that the astronomical dollars involved in genAI investments is mind-boggling. And yet even more investment is needed — a lot more.

Read More »

Microsoft will invest $80B in AI data centers in fiscal 2025

And Microsoft isn’t the only one that is ramping up its investments into AI-enabled data centers. Rival cloud service providers are all investing in either upgrading or opening new data centers to capture a larger chunk of business from developers and users of large language models (LLMs).  In a report published in October 2024, Bloomberg Intelligence estimated that demand for generative AI would push Microsoft, AWS, Google, Oracle, Meta, and Apple would between them devote $200 billion to capex in 2025, up from $110 billion in 2023. Microsoft is one of the biggest spenders, followed closely by Google and AWS, Bloomberg Intelligence said. Its estimate of Microsoft’s capital spending on AI, at $62.4 billion for calendar 2025, is lower than Smith’s claim that the company will invest $80 billion in the fiscal year to June 30, 2025. Both figures, though, are way higher than Microsoft’s 2020 capital expenditure of “just” $17.6 billion. The majority of the increased spending is tied to cloud services and the expansion of AI infrastructure needed to provide compute capacity for OpenAI workloads. Separately, last October Amazon CEO Andy Jassy said his company planned total capex spend of $75 billion in 2024 and even more in 2025, with much of it going to AWS, its cloud computing division.

Read More »

John Deere unveils more autonomous farm machines to address skill labor shortage

Join our daily and weekly newsletters for the latest updates and exclusive content on industry-leading AI coverage. Learn More Self-driving tractors might be the path to self-driving cars. John Deere has revealed a new line of autonomous machines and tech across agriculture, construction and commercial landscaping. The Moline, Illinois-based John Deere has been in business for 187 years, yet it’s been a regular as a non-tech company showing off technology at the big tech trade show in Las Vegas and is back at CES 2025 with more autonomous tractors and other vehicles. This is not something we usually cover, but John Deere has a lot of data that is interesting in the big picture of tech. The message from the company is that there aren’t enough skilled farm laborers to do the work that its customers need. It’s been a challenge for most of the last two decades, said Jahmy Hindman, CTO at John Deere, in a briefing. Much of the tech will come this fall and after that. He noted that the average farmer in the U.S. is over 58 and works 12 to 18 hours a day to grow food for us. And he said the American Farm Bureau Federation estimates there are roughly 2.4 million farm jobs that need to be filled annually; and the agricultural work force continues to shrink. (This is my hint to the anti-immigration crowd). John Deere’s autonomous 9RX Tractor. Farmers can oversee it using an app. While each of these industries experiences their own set of challenges, a commonality across all is skilled labor availability. In construction, about 80% percent of contractors struggle to find skilled labor. And in commercial landscaping, 86% of landscaping business owners can’t find labor to fill open positions, he said. “They have to figure out how to do

Read More »

2025 playbook for enterprise AI success, from agents to evals

Join our daily and weekly newsletters for the latest updates and exclusive content on industry-leading AI coverage. Learn More 2025 is poised to be a pivotal year for enterprise AI. The past year has seen rapid innovation, and this year will see the same. This has made it more critical than ever to revisit your AI strategy to stay competitive and create value for your customers. From scaling AI agents to optimizing costs, here are the five critical areas enterprises should prioritize for their AI strategy this year. 1. Agents: the next generation of automation AI agents are no longer theoretical. In 2025, they’re indispensable tools for enterprises looking to streamline operations and enhance customer interactions. Unlike traditional software, agents powered by large language models (LLMs) can make nuanced decisions, navigate complex multi-step tasks, and integrate seamlessly with tools and APIs. At the start of 2024, agents were not ready for prime time, making frustrating mistakes like hallucinating URLs. They started getting better as frontier large language models themselves improved. “Let me put it this way,” said Sam Witteveen, cofounder of Red Dragon, a company that develops agents for companies, and that recently reviewed the 48 agents it built last year. “Interestingly, the ones that we built at the start of the year, a lot of those worked way better at the end of the year just because the models got better.” Witteveen shared this in the video podcast we filmed to discuss these five big trends in detail. Models are getting better and hallucinating less, and they’re also being trained to do agentic tasks. Another feature that the model providers are researching is a way to use the LLM as a judge, and as models get cheaper (something we’ll cover below), companies can use three or more models to

Read More »

OpenAI’s red teaming innovations define new essentials for security leaders in the AI era

Join our daily and weekly newsletters for the latest updates and exclusive content on industry-leading AI coverage. Learn More OpenAI has taken a more aggressive approach to red teaming than its AI competitors, demonstrating its security teams’ advanced capabilities in two areas: multi-step reinforcement and external red teaming. OpenAI recently released two papers that set a new competitive standard for improving the quality, reliability and safety of AI models in these two techniques and more. The first paper, “OpenAI’s Approach to External Red Teaming for AI Models and Systems,” reports that specialized teams outside the company have proven effective in uncovering vulnerabilities that might otherwise have made it into a released model because in-house testing techniques may have missed them. In the second paper, “Diverse and Effective Red Teaming with Auto-Generated Rewards and Multi-Step Reinforcement Learning,” OpenAI introduces an automated framework that relies on iterative reinforcement learning to generate a broad spectrum of novel, wide-ranging attacks. Going all-in on red teaming pays practical, competitive dividends It’s encouraging to see competitive intensity in red teaming growing among AI companies. When Anthropic released its AI red team guidelines in June of last year, it joined AI providers including Google, Microsoft, Nvidia, OpenAI, and even the U.S.’s National Institute of Standards and Technology (NIST), which all had released red teaming frameworks. Investing heavily in red teaming yields tangible benefits for security leaders in any organization. OpenAI’s paper on external red teaming provides a detailed analysis of how the company strives to create specialized external teams that include cybersecurity and subject matter experts. The goal is to see if knowledgeable external teams can defeat models’ security perimeters and find gaps in their security, biases and controls that prompt-based testing couldn’t find. What makes OpenAI’s recent papers noteworthy is how well they define using human-in-the-middle

Read More »