Stay Ahead, Stay ONMINE

Do European M&Ms Actually Taste Better than American M&Ms?

(Oh, I am the only one who’s been asking this question…? Hm. Well, if you have a minute, please enjoy this exploratory Data Analysis — featuring experimental design, statistics, and interactive visualization — applied a bit too earnestly to resolve an international debate.) 1. Introduction 1.1 Background and motivation Chocolate is enjoyed around the world. […]

(Oh, I am the only one who’s been asking this question…? Hm. Well, if you have a minute, please enjoy this exploratory Data Analysis — featuring experimental design, statistics, and interactive visualization — applied a bit too earnestly to resolve an international debate.)

1. Introduction

1.1 Background and motivation

Chocolate is enjoyed around the world. From ancient practices harvesting organic cacao in the Amazon basin, to chocolatiers sculpting edible art in the mountains of Switzerland, and enormous factories in Hershey, Pennsylvania churning out 70 million kisses per day, the nuanced forms and flavors of chocolate have been integrated into many cultures and their customs. While quality can greatly vary across chocolate products, a well-known, shelf-stable, easily shareable form of chocolate are M&Ms. Readily found by convenience store check-out counters and in hotel vending machines, the brightly colored pellets are a popular treat whose packaging is re-branded to fit nearly any commercializable American holiday.

While living in Denmark in 2022, I heard a concerning claim: M&Ms manufactured in Europe taste different, and arguably “better,” than M&Ms produced in the United States. While I recognized that fancy European chocolate is indeed quite tasty and often superior to American chocolate, it was unclear to me if the same claim should hold for M&Ms. I learned that many Europeans perceive an “unpleasant” or “tangy” taste in American chocolate, which is largely attributed to butyric acid, a compound resulting from differences in how milk is treated before incorporation into milk chocolate.

But honestly, how much of a difference could this make for M&Ms? M&Ms!? I imagined M&Ms would retain a relatively processed/mass-produced/cheap candy flavor wherever they were manufactured. As the lone American visiting a diverse lab of international scientists pursuing cutting-edge research in biosustainability, I was inspired to break out my data science toolbox and investigate this M&M flavor phenomenon.

1.2 Previous work

To quote a European woman, who shall remain anonymous, after she tasted an American M&M while traveling in New York:

“They taste so gross. Like vomit. I don’t understand how people can eat this. I threw the rest of the bag away.”

Vomit? Really? In my experience, children raised in the United States had no qualms about eating M&Ms. Growing up, I was accustomed to bowls of M&Ms strategically placed in high traffic areas around my house to provide readily available sugar. Clearly American M&Ms are edible. But are they significantly different and/or inferior to their European equivalent?

In response to the anonymous European woman’s scathing report, myself and two other Americans visiting Denmark sampled M&Ms purchased locally in the Lyngby Storcenter Føtex. We hoped to experience the incredible improvement in M&M flavor that was apparently hidden from us throughout our youths. But curiously, we detected no obvious flavor improvements.

Unfortunately, neither preliminary study was able to conduct a side-by-side taste test with proper controls and randomized M&M sampling. Thus, we turn to science.

1.3 Study Goals

This study seeks to remedy the previous lack of thoroughness and investigate the following questions:

  1. Is there a global consensus that European M&Ms are in fact better than American M&Ms?
  2. Can Europeans actually detect a difference between M&Ms purchased in the US vs in Europe when they don’t know which one they are eating? Or is this a grand, coordinated lie amongst Europeans to make Americans feel embarrassed?
  3. Are Americans actually taste-blind to American vs European M&Ms? Or can they taste a difference but simply don’t describe this difference as “an improvement” in flavor?
  4. Can these alleged taste differences be perceived by citizens of other continents? If so, do they find one flavor obviously superior?

2. Methods

2.1 Experimental design and data collection

Participants were recruited by luring — er, inviting them to a social gathering (with the promise of free food) that was conveniently co-located with the testing site. Once a participant agreed to pause socializing and join the study, they were positioned at a testing station with a trained experimenter who guided them through the following steps:

  • Participants sat at a table and received two cups: 1 empty and 1 full of water. With one cup in each hand, the participant was asked to close their eyes, and keep them closed through the remainder of the experiment.
  • The experimenter randomly extracted one M&M with a spoon, delivered it to the participant’s empty cup, and the participant was asked to eat the M&M (eyes still closed).
  • After eating each M&M, the experimenter collected the taste response by asking the participant to report if they thought the M&M tasted: Especially Good, Especially Bad, or Normal.
  • Each participant received a total of 10 M&Ms (5 European, 5 American), one at a time, in a random sequence determined by random.org.
  • Between eating each M&M, the participant was asked to take a sip of water to help “cleanse their palate.”
  • Data collected: for each participant, the experimenter recorded the participant’s continent of origin (if this was ambiguous, the participant was asked to list the continent on which they have the strongest memories of eating candy as a child). For each of the 10 M&Ms delivered, the experimenter recorded the M&M origin (“Denmark” or “USA”), the M&M color, and the participant’s taste response. Experimenters were also encouraged to jot down any amusing phrases uttered by the participant during the test, recorded under notes (data available here).

2.2 Sourcing materials and recruiting participants

Two bags of M&Ms were purchased for this study. The American-sourced M&Ms (“USA M&M”) were acquired at the SFO airport and delivered by the author’s parents, who visited her in Denmark. The European-sourced M&Ms (“Denmark M&M”) were purchased at a local Føtex grocery store in Lyngby, a little north of Copenhagen.

Experiments were conducted at two main time points. The first 14 participants were tested in Lyngby, Denmark in August 2022. They mostly consisted of friends and housemates the author met at the Novo Nordisk Foundation Center for Biosustainability at the Technical University of Denmark (DTU) who came to a “going away party” into which the experimental procedure was inserted. A few additional friends and family who visited Denmark were also tested during their travels (e.g. on the train).

The remaining 37 participants were tested in Seattle, WA, USA in October 2022, primarily during a “TGIF happy hour” hosted by graduate students in the computer science PhD program at the University of Washington. This second batch mostly consisted of students and staff of the Paul. G. Allen School of Computer Science & Engineering (UW CSE) who responded to the weekly Friday summoning to the Allen Center atrium for free snacks and drinks.
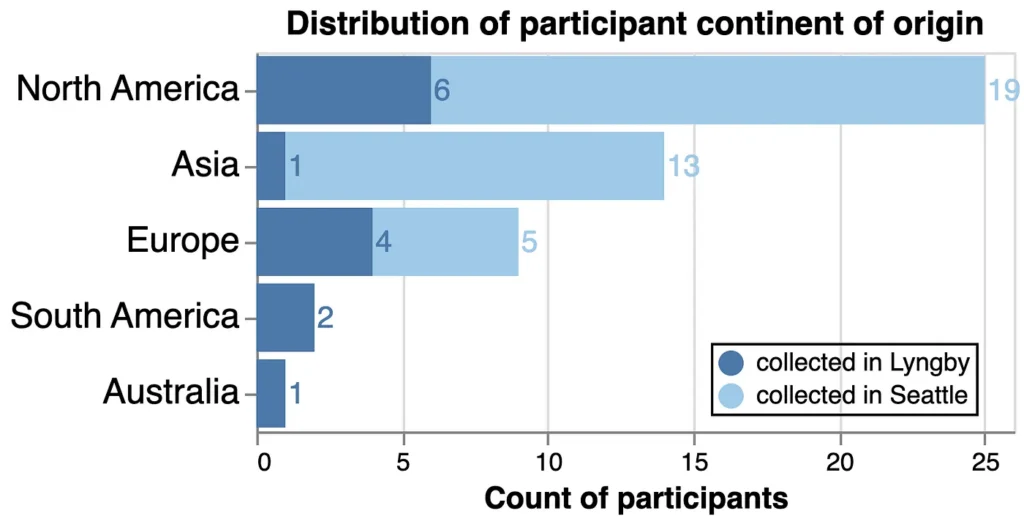
Figure 1. Distribution of participants recruited to the study. In the first sampling event in Lyngby, participants primarily hailed from North America and Europe, and a few additionally came from Asia, South America, or Australia. Our second sampling event in Seattle greatly increased participants, primarily from North America and Asia, and a few more from Europe. Neither event recruited participants from Africa. Figure made with Altair.

While this study set out to analyze global trends, unfortunately data was only collected from 51 participants the author was able to lure to the study sites and is not well-balanced nor representative of the 6 inhabited continents of Earth (Figure 1). We hope to improve our recruitment tactics in future work. For now, our analytical power with this dataset is limited to response trends for individuals from North America, Europe, and Asia, highly biased by subcommunities the author happened to engage with in late 2022.

2.3 Risks

While we did not acquire formal approval for experimentation with human test subjects, there were minor risks associated with this experiment: participants were warned that they may be subjected to increased levels of sugar and possible “unpleasant flavors” as a result of participating in this study. No other risks were anticipated.

After the experiment however, we unfortunately observed several cases of deflated pride when a participant learned their taste response was skewed more positively towards the M&M type they were not expecting. This pride deflation seemed most severe among European participants who learned their own or their fiancé’s preference skewed towards USA M&Ms, though this was not quantitatively measured and cannot be confirmed beyond anecdotal evidence.

3. Results & Discussion

3.1 Overall response to “USA M&Ms” vs “Denmark M&Ms”

3.1.1 Categorical response analysis — entire dataset

In our first analysis, we count the total number of “Bad”, “Normal”, and “Good” taste responses and report the percentage of each response received by each M&M type. M&Ms from Denmark more frequently received “Good” responses than USA M&Ms but also more frequently received “Bad” responses. M&Ms from the USA were most frequently reported to taste “Normal” (Figure 2). This may result from the elevated number of participants hailing from North America, where the USA M&M is the default and thus more “Normal,” while the Denmark M&M was more often perceived as better or worse than the baseline.

Figure 2. Qualitative taste response distribution across the whole dataset. The percentage of taste responses for “Bad”, “Normal” or “Good” was calculated for each type of M&M. Figure made with Altair.

Now let’s break out some Statistics, such as a chi-squared (X2) test to compare our observed distributions of categorical taste responses. Using the scipy.stats chi2_contingency function, we built contingency tables of the observed counts of “Good,” “Normal,” and “Bad” responses to each M&M type. Using the X2 test to evaluate the null hypothesis that there is no difference between the two M&Ms, we found the p-value for the test statistic to be 0.0185, which is significant at the common p-value cut off of 0.05, but not at 0.01. So a solid “maybe,” depending on whether you’d like this result to be significant or not.

3.1.2 Quantitative response analysis — entire dataset.

The X2 test helps evaluate if there is a difference in categorical responses, but next, we want to determine a relative taste ranking between the two M&M types. To do this, we converted taste responses to a quantitative distribution and calculated a taste score. Briefly, “Bad” = 1, “Normal” = 2, “Good” = 3. For each participant, we averaged the taste scores across the 5 M&Ms they tasted of each type, maintaining separate taste scores for each M&M type.
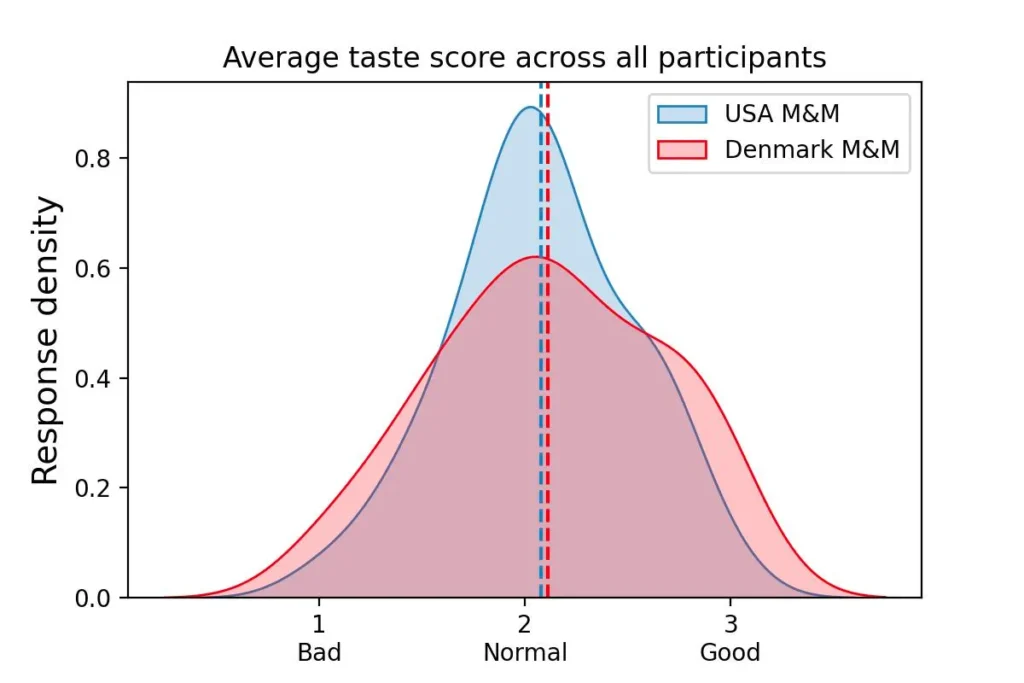
Figure 3. Quantitative taste score distributions across the whole dataset. Kernel density estimation of the average taste score calculated for each participant for each M&M type. Figure made with Seaborn.

With the average taste score for each M&M type in hand, we turn to scipy.stats ttest_ind (“T-test”) to evaluate if the means of the USA and Denmark M&M taste scores are different (the null hypothesis being that the means are identical). If the means are significantly different, it would provide evidence that one M&M is perceived as significantly tastier than the other.

We found the average taste scores for USA M&Ms and Denmark M&Ms to be quite close (Figure 3), and not significantly different (T-test: = 0.721). Thus, across all participants, we do not observe a difference between the perceived taste of the two M&M types (or if you enjoy parsing triple negatives: “we cannot reject the null hypothesis that there is not a difference”).

But does this change if we separate participants by continent of origin?

3.2 Continent-specific responses to “USA M&Ms” vs “Denmark M&Ms”

We repeated the above X2 and T-test analyses after grouping participants by their continents of origin. The Australia and South America groups were combined as a minimal attempt to preserve data privacy. Due to the relatively small sample size of even the combined Australia/South America group (n=3), we will refrain from analyzing trends for this group but include the data in several figures for completeness and enjoyment of the participants who may eventually read this.

3.2.1 Categorical response analysis — by continent

In Figure 4, we display both the taste response counts (upper panel, note the interactive legend) and the response percentages (lower panel) for each continent group. Both North America and Asia follow a similar trend to the whole population dataset: participants report Denmark M&Ms as “Good” more frequently than USA M&Ms, but also report Denmark M&Ms as “Bad” more frequently. USA M&Ms were most frequently reported as “Normal” (Figure 4).

On the contrary, European participants report USA M&Ms as “Bad” nearly 50% of the time and “Good” only 18% of the time, which is the most negative and least positive response pattern, respectively (when excluding the under-sampled Australia/South America group).

Figure 4. Qualitative taste response distribution by continent. Upper panel: counts of taste responses — click the legend to interactively filter! Lower panel: percentage of taste responses for each type of M&M. Figure made with Altair.

This appeared striking in bar chart form, however only North America had a significant X2 p-value (p = 0.0058) when evaluating each continent’s difference in taste response profile between the two M&M types. The European p-value is perhaps “approaching significance” in some circles, but we’re about to accumulate several more hypothesis tests and should be mindful of multiple hypothesis testing (Table 1). A false positive result here would be devastating.

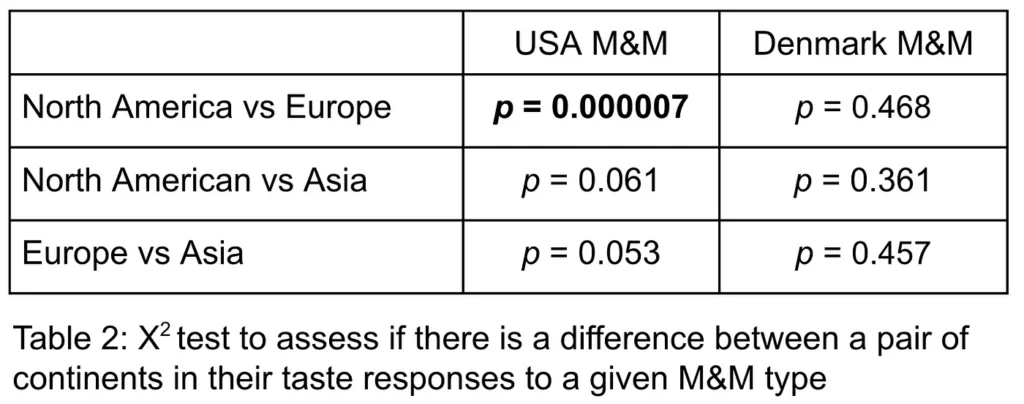
When comparing the taste response profiles between two continents for the same M&M type, there are a couple interesting notes. First, we observed no major taste discrepancies between all pairs of continents when evaluating Denmark M&Ms — the world seems generally consistent in their range of feelings about M&Ms sourced from Europe (right column X2 p-values, Table 2). To visualize this comparison more easily, we reorganize the bars in Figure 4 to group them by M&M type (Figure 5).

Figure 5. Qualitative taste response distribution by M&M type, reported as percentages. (Same data as Figure 4 but re-arranged). Figure made with Altair.

However, when comparing continents to each other in response to USA M&Ms, we see larger discrepancies. We found one pairing to be significantly different: European and North American participants evaluated USA M&Ms very differently (p = 0.000007) (Table 2). It seems very unlikely that this observed difference is by random chance (left column, Table 2).
3.2.2 Quantitative response analysis — by continent

We again convert the categorical profiles to quantitative distributions to assess continents’ relative preference of M&M types. For North America, we see that the taste score means of the two M&M types are actually quite similar, but there is a higher density around “Normal” scores for USA M&Ms (Figure 6A). The European distributions maintain a bit more of a separation in their means (though not quite significantly so), with USA M&Ms scoring lower (Figure 6B). The taste score distributions of Asian participants is most similar (Figure 6C).

Reorienting to compare the quantitative means between continents’ taste scores for the same M&M type, only the comparison between North American and European participants on USA M&Ms is significantly different based on a T-test (p = 0.001) (Figure 6D), though now we really are in danger of multiple hypothesis testing! Be cautious if you are taking this analysis at all seriously.
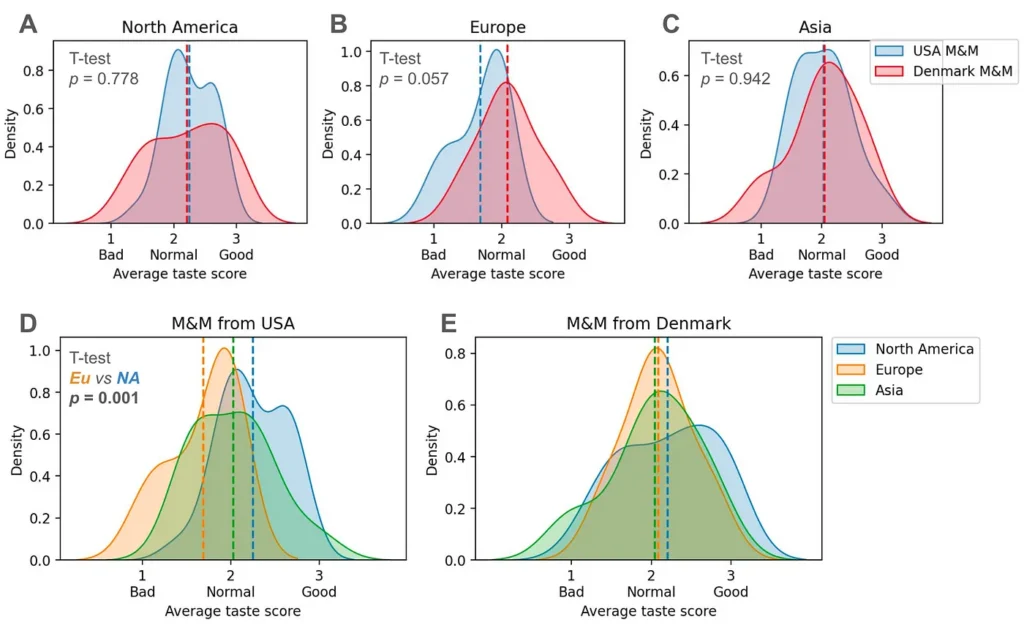
Figure 6. Quantitative taste score distributions by continent. Kernel density estimation of the average taste score calculated for each each continent for each M&M type. A. Comparison of North America responses to each M&M. B. Comparison of Europe responses to each M&M. C. Comparison of Asia responses to each M&M. D. Comparison of continents for USA M&Ms. E. Comparison of continents for Denmark M&Ms. Figure made with Seaborn.

At this point, I feel myself considering that maybe Europeans are not just making this up. I’m not saying it’s as dramatic as some of them claim, but perhaps a difference does indeed exist… To some degree, North American participants also perceive a difference, but the evaluation of Europe-sourced M&Ms is not consistently positive or negative.

3.3 M&M taste alignment chart

In our analyses thus far, we did not account for the baseline differences in M&M appreciation between participants. For example, say Person 1 scored all Denmark M&Ms as “Good” and all USA M&Ms as “Normal”, while Person 2 scored all Denmark M&Ms as “Normal” and all USA M&Ms as “Bad.” They would have the same relative preference for Denmark M&Ms over USA M&Ms, but Person 2 perhaps just does not enjoy M&Ms as much as Person 1, and the relative preference signal is muddled by averaging the raw scores.

Inspired by the Lawful/Chaotic x Good/Evil alignment chart used in tabletop role playing games like Dungeons & Dragons©™, in Figure 7, we establish an M&M alignment chart to help determine the distribution of participants across M&M enjoyment classes.
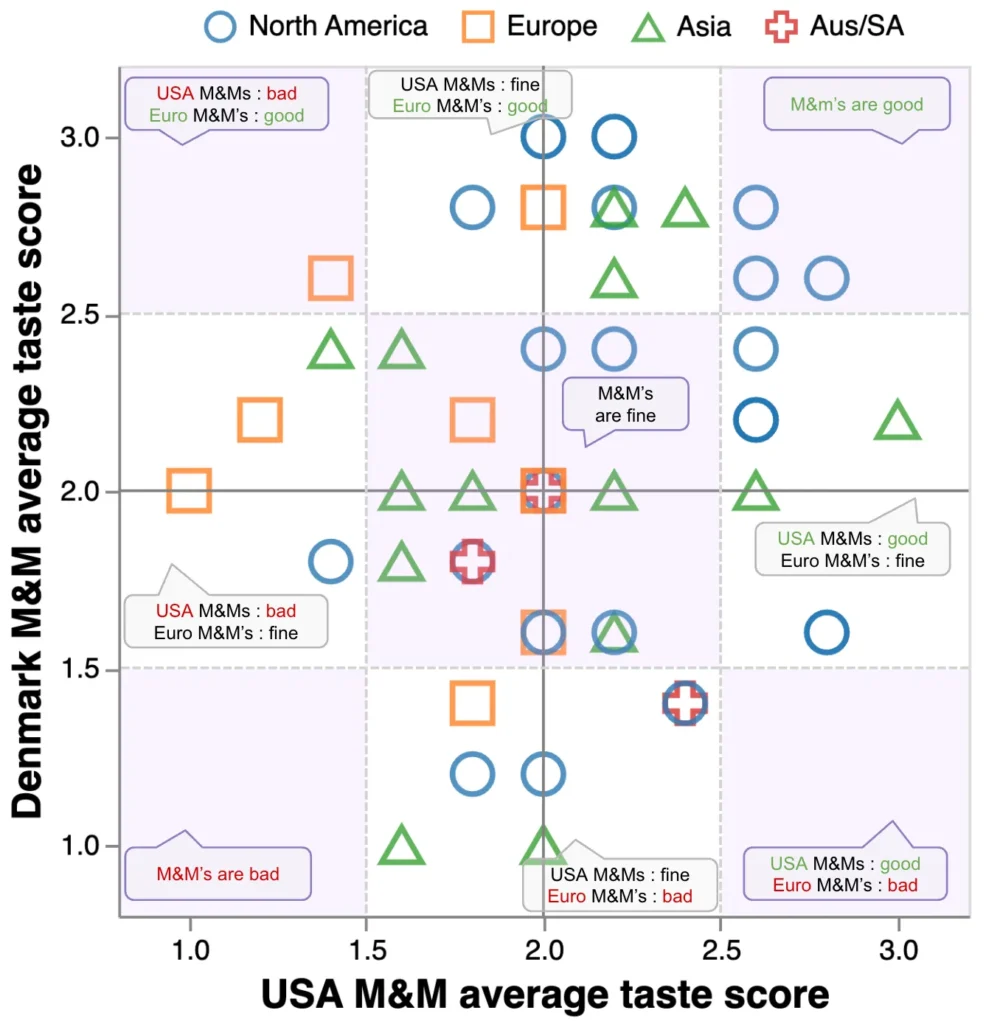
Figure 7. M&M enjoyment alignment chart. The x-axis represents a participant’s average taste score for USA M&Ms; the y-axis is a participant’s average taste score for Denmark M&Ms. Figure made with Altair.

Notably, the upper right quadrant where both M&M types are perceived as “Good” to “Normal” is mostly occupied by North American participants and a few Asian participants. All European participants land in the left half of the figure where USA M&Ms are “Normal” to “Bad”, but Europeans are somewhat split between the upper and lower halves, where perceptions of Denmark M&Ms range from “Good” to “Bad.”

An interactive version of Figure 7 is provided below for the reader to explore the counts of various M&M alignment regions.

Figure 7 (interactive): click and brush your mouse over the scatter plot to see the counts of continents in different M&M enjoyment regions. Figure made with Altair.

3.4 Participant taste response ratio

Next, to factor out baseline M&M enjoyment and focus on participants’ relative preference between the two M&M types, we took the log ratio of each person’s USA M&M taste score average divided by their Denmark M&M taste score average.
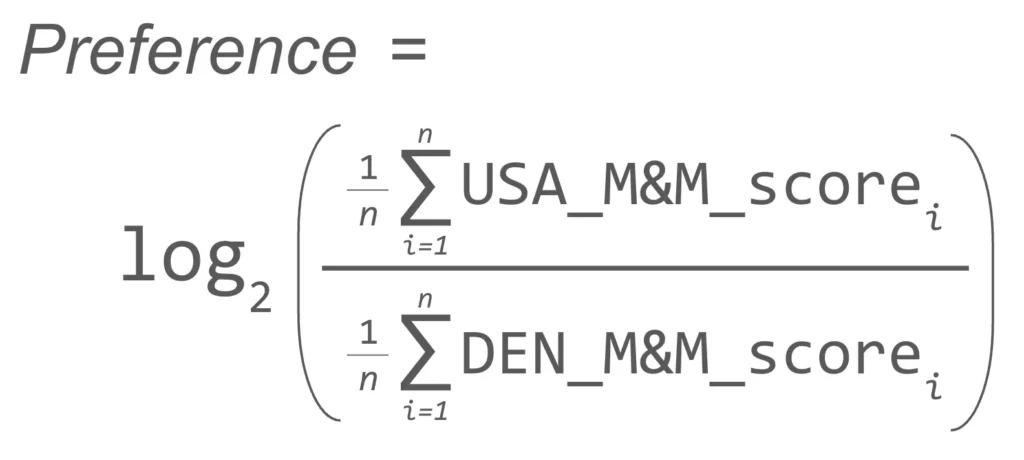
Equation 1: Equation to calculate each participant’s overall M&M preference ratio.

As such, positive scores indicate a preference towards USA M&Ms while negative scores indicate a preference towards Denmark M&Ms.

On average, European participants had the strongest preference towards Denmark M&Ms, with Asians also exhibiting a slight preference towards Denmark M&Ms (Figure 8). To the two Europeans who exhibited deflated pride upon learning their slight preference towards USA M&Ms, fear not: you did not think USA M&Ms were “Good,” but simply ranked them as less bad than Denmark M&Ms (see participant_id 4 and 17 in the interactive version of Figure 7). If you assert that M&Ms are a bad American invention not worth replicating and return to consuming artisanal European chocolate, your honor can likely be restored.
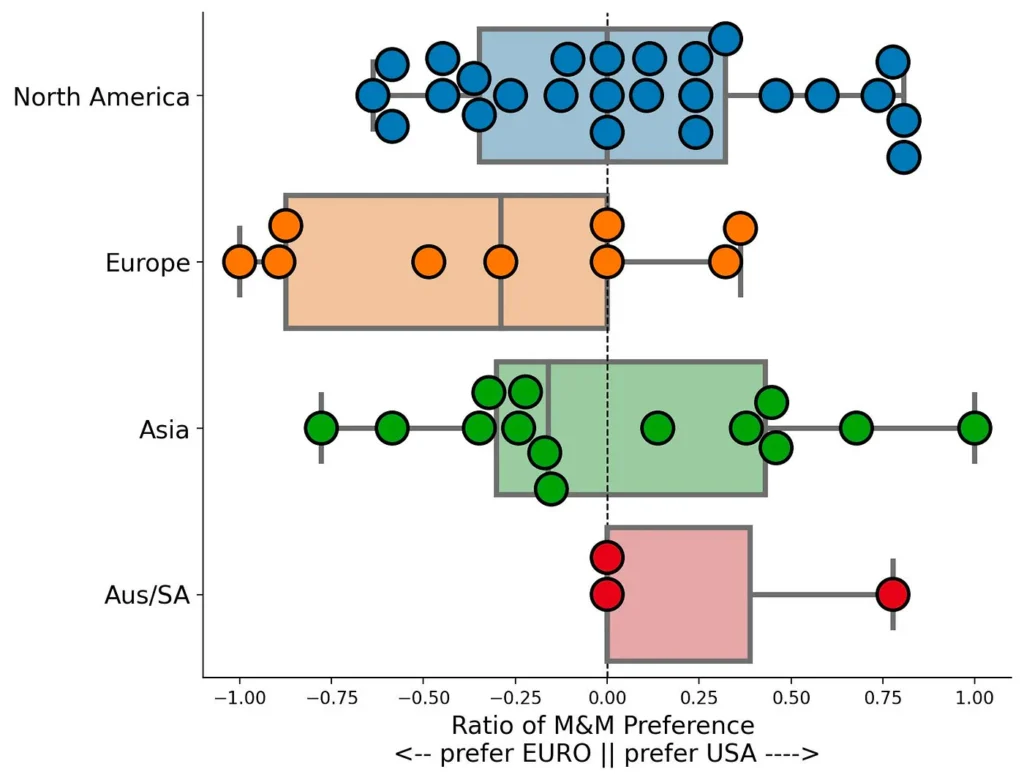
Figure 8. Distribution of participant M&M preference ratios by continent. Preference ratios are calculated as in Equation 1. Positive numbers indicate a relative preference for USA M&Ms, while negative indicate a relative preference for Denmark M&Ms. Figure made with Seaborn.

North American participants are pretty split in their preference ratios: some fall quite neutrally around 0, others strongly prefer the familiar USA M&M, while a handful moderately prefer Denmark M&Ms. Anecdotally, North Americans who learned their preference skewed towards European M&Ms displayed signals of inflated pride, as if their results signaled posh refinement.

Overall, a T-test comparing the distributions of M&M preference ratios shows a possibly significant difference in the means between European and North American participants (p = 0.049), but come on, this is like the 20th p-value I’ve reported — this one is probably too close to call.

3.5 Taste inconsistency and “Perfect Classifiers”

For each participant, we assessed their taste score consistency by averaging the standard deviations of their responses to each M&M type, and plotting that against their preference ratio (Figure 9).

Figure 9. Participant taste consistency by preference ratio. The x-axis is a participant’s relative M&M preference ratio. The y-axis is the average of the standard deviation of their USA M&M scores and the standard deviation of their Denmark M&M scores. A value of 0 on the y-axis indicates perfect consistency in responses, while higher values indicate more inconsistent responses. Figure made with Altair.

Most participants were somewhat inconsistent in their ratings, ranking the same M&M type differently across the 5 samples. This would be expected if the taste difference between European-sourced and American-sourced M&Ms is not actually all that perceptible. Most inconsistent were participants who gave the same M&M type “Good”, “Normal”, and “Bad” responses (e.g., points high on the y-axis, with wider standard deviations of taste scores), indicating lower taste perception abilities.

Intriguingly, four participants — one from each continent group — were perfectly consistent: they reported the same taste response for each of the 5 M&Ms from each M&M type, resulting in an average standard deviation of 0.0 (bottom of Figure 9). Excluding the one of the four who simply rated all 10 M&Ms as “Normal”, the other three appeared to be “Perfect Classifiers” — either rating all M&Ms of one type “Good” and the other “Normal”, or rating all M&Ms of one type “Normal” and the other “Bad.” Perhaps these folks are “super tasters.”

3.6 M&M color

Another possible explanation for the inconsistency in individual taste responses is that there exists a perceptible taste difference based on the M&M color. Visually, the USA M&Ms were noticeably more smooth and vibrant than the Denmark M&Ms, which were somewhat more “splotchy” in appearance (Figure 10A). M&M color was recorded during the experiment, and although balanced sampling was not formally built into the experimental design, colors seemed to be sampled roughly evenly, with the exception of Blue USA M&Ms, which were oversampled (Figure 10B).
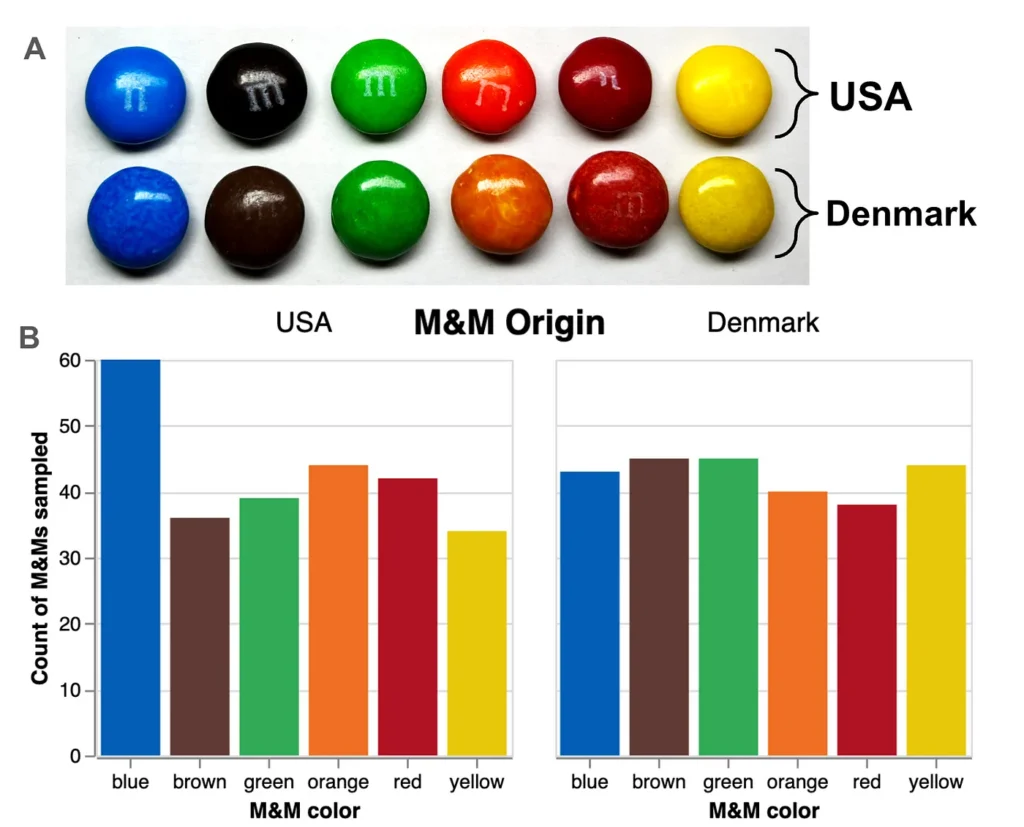
Figure 10. M&M colors. A. Photo of each M&M color of each type. It’s perhaps a bit hard to perceive on screen in my unprofessionally lit photo, but with the naked eye, USA M&Ms seemed to be brighter and more uniformly colored while Denmark M&Ms have a duller and more mottled color. Is it just me, or can you already hear the Europeans saying “They are brighter because of all those extra chemicals you put in your food that we ban here!” B. Distribution of M&Ms of each color sampled over the course of the experiment. The Blue USA M&Ms were not intentionally oversampled — they must be especially bright/tempting to experimenters. Figure made with Altair.

We briefly visualized possible differences in taste responses based on color (Figure 11), however we do not believe there are enough data to support firm conclusions. After all, on average each participant would likely only taste 5 of the 6 M&M colors once, and 1 color not at all. We leave further M&M color investigations to future work.
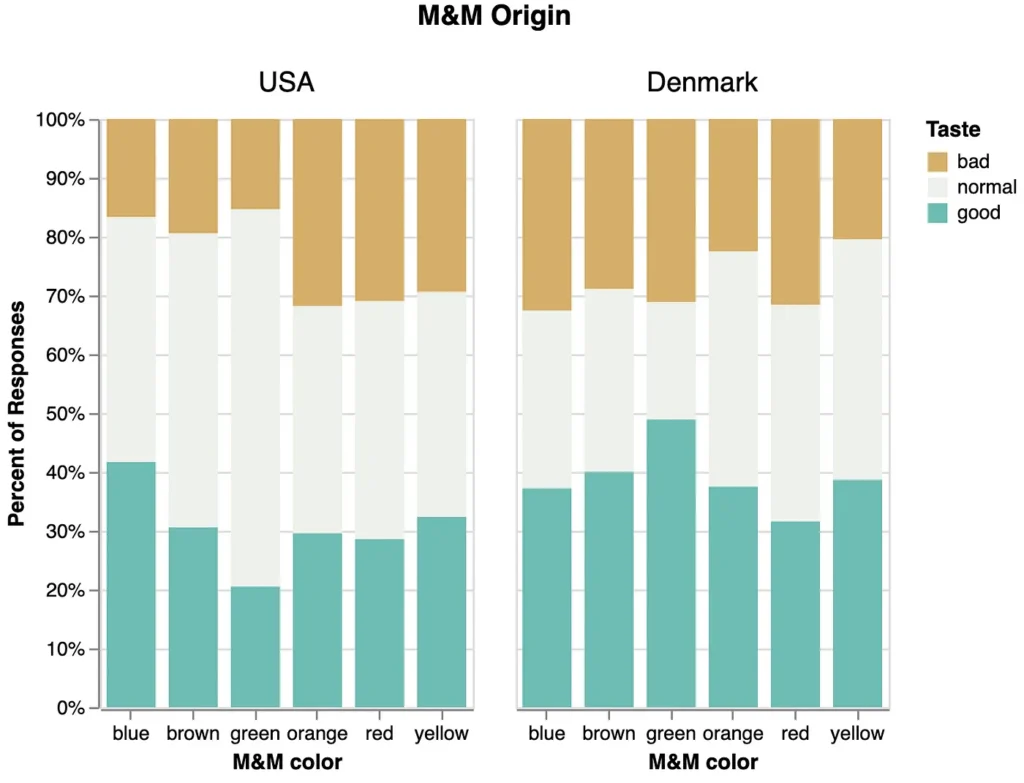
Figure 11. Taste response profiles for M&Ms of each color and type. Profiles are reported as percentages of “Bad”, “Normal”, and “Good” responses, though not all M&Ms were sampled exactly evenly. Figure made with Altair.

3.7 Colorful commentary

We assured each participant that there was no “right “answer” in this experiment and that all feelings are valid. While some participants took this to heart and occasionally spent over a minute deeply savoring each M&M and evaluating it as if they were a sommelier, many participants seemed to view the experiment as a competition (which occasionally led to deflated or inflated pride). Experimenters wrote down quotes and notes in conjunction with M&M responses, some of which were a bit “colorful.” We provide a hastily rendered word cloud for each M&M type for entertainment purposes (Figure 12) though we caution against reading too far into them without diligent sentiment analysis.

Figure 11. A simple word cloud generated from the notes column of each M&M type. Fair warning — these have not been properly analyzed for sentiment and some inappropriate language was recorded. Figure made with WordCloud.

4. Conclusion

Overall, there does not appear to be a “global consensus” that European M&Ms are better than American M&Ms. However, European participants tended to more strongly express negative reactions to USA M&Ms while North American participants seemed relatively split on whether they preferred M&Ms sourced from the USA vs from Europe. The preference trends of Asian participants often fell somewhere between the North Americans and Europeans.

Therefore, I’ll admit that it’s probable that Europeans are not engaged in a grand coordinated lie about M&Ms. The skew of most European participants towards Denmark M&Ms is compelling, especially since I was the experimenter who personally collected much of the taste response data. If they found a way to cheat, it was done well enough to exceed my own passive perception such that I didn’t notice. However, based on this study, it would appear that a strongly negative “vomit flavor” is not universally perceived and does not become apparent to non-Europeans when tasting both M&Ms types side by side.

We hope this study has been illuminating! We would look forward to extensions of this work with improved participant sampling, additional M&M types sourced from other continents, and deeper investigations into possible taste differences due to color.

Thank you to everyone who participated and ate M&Ms in the name of science!

Figures and analysis can be found on github: https://github.com/erinhwilson/mnm-taste-test

Article by Erin H. Wilson, Ph.D.[1,2,3] who decided the time between defending her dissertation and starting her next job would be best spent on this highly valuable analysis. Hopefully it is clear that this article is intended to be comedic— I do not actually harbor any negative feelings towards Europeans who don’t like American M&Ms, but enjoyed the chance to be sassy and poke fun at our lively debates with overly-enthusiastic data analysis.

Shout out to Matt, Galen, Ameya, and Gian-Marco for assisting in data collection!

[1] Former Ph.D. student in the Paul G. Allen School of Computer Science and Engineering at the University of Washington

[2] Former visiting Ph.D. student at the Novo Nordisk Foundation Center for Biosustainability at the Technical University of Denmark

[3] Future data scientist at LanzaTech

Shape
Shape
Stay Ahead

Explore More Insights

Stay ahead with more perspectives on cutting-edge power, infrastructure, energy,  bitcoin and AI solutions. Explore these articles to uncover strategies and insights shaping the future of industries.

Shape

Nutanix expands beyond HCI

The Pure Storage integration will also be supported within Cisco’s FlashStack offering, creating a “FlashStack with Nutanix” solution with storage provided by Pure, networking capabilities as well as UCS servers from Cisco, and then the common Nutanix Cloud Platform. Cloud Native AOS: Breaking free from hypervisors Another sharp departure from

Read More »

IBM introduces new generation of LinuxOne AI mainframe

In addition to generative AI applications, new multiple model AI approaches are engineered to enhance prediction and accuracy in many industry use cases like advanced fraud detection, image processing and retail automation, according to IBM. LinuxONE Emperor 5 also comes with advanced security features specifically designed for the AI threat

Read More »

Hornsea 4 cancellation puts pressure on AR7

The UK government has proposed changes to the way it procures offshore wind as it now needs to claw back capacity after the massive Hornsea 4 project ground to a halt. The Department for Energy Security and Net Zero (DESNZ) confirmed changes to the way it will run its contracts for difference (CfD) auctions, starting with the upcoming Allocation Round 7 (AR7), expected this year. Under the reforms, the government would no longer set a monetary budget for the various technologies across the auction, such as the £1.5 billion allocated for offshore wind in AR6, at the start of the auction. Instead, the government would publish a “capacity ambition,” stating instead the amount of power it aims to procure. However, it would still publish a budget for the auction after the process has run. In addition, the reforms envision allowing the secretary of state to see the anonymous bids, including price and capacity. They would use this information to determine how much capacity to procure and to set the final budget. AR7 The amendments will also end flexible bidding for fixed-bottom offshore wind applications. According to the proposals, flexible bids are no longer useful if the auction sets the budget after seeing the bids in advance. Finally, the proposed reforms also considered accelerating the offshore wind part of the auction if developers get their bids in on time and there are no appeals. However, the government said that legislation needed to make change could not be delivered before AR7 – though it did not rule it out for subsequent auctions. © Supplied by OrstedOrsted’s Hornsea One wind farm. It added that the government is exploring non-legislative routes to accelerate a fixed-bottom offshore wind auction in time for AR7. In comments to Energy Voice, Aegir Insights market analyst Signe Tellier Christensen

Read More »

Grid queue: Lay of the land for renewables developers is still unclear

Renewable energy developments can only export the electricity they produce to the grid if they have a grid connection. This has created a large queue of developers waiting for a connection date for their projects, which can extend to over a decade in the future. This backlog is causing significant uncertainty for developers and strain on some renewable projects preventing their construction from being progressed. Once they are in it, developers rarely leave the queue even if they ultimately decide that their project isn’t viable. As the queue currently operates on a “first come, first served” basis, it means that viable and ready-to-build projects can be delayed longer than necessary. To help address these lengthy delays and enable new clean energy projects to secure grid connections, a new grid queue management system is being developed by the National Energy System Operator (NESO). Expected to be introduced this summer, this new system aims to ease the current bottleneck by allocating “confirmed connection dates, connection points and queue positions” to projects which are deemed viable and ready to progress over those which don’t meet its criteria. One of the biggest changes for developers will be demonstrating they have secured land rights to keep their place in the queue when satisfying the milestones known as “gate 2”. While this new initiative will be welcomed across the renewables sector, it raises several issues for project developers to consider including how they negotiate new land agreements. NESO has been clear that nothing short of a signed option agreement will be required for projects to qualify for a grid position under gate 2 – an exclusivity agreement or heads of terms will no longer suffice. Although NESO is clear that only projects that are demonstrably viable will keep their place in the grid connection queue, how

Read More »

Business leaders and SNP call on Starmer to visit Aberdeen amid North Sea job losses

Aberdeen business leaders and the SNP are calling on the Prime Minister to visit the north-east of Scotland as they blamed Labour policies for yet more job losses in the oil and gas sector. On Wednesday, Harbour Energy announced that it would cut 250 jobs from its onshore operations, accounting for a 25% reduction in headcount. The UK’s largest producer of oil and gas has claimed that the hostile fiscal policy facing oil and gas businesses prompted the decision as it slows investment in the country, opting to allocate funds overseas. On the day of this announcement, Aberdeen South MP and SNP Westminster leader Stephen Flynn brought the news to the attention of prime minister Sir Keir Starmer. © BloombergEmissions from chimneys at the British Steel Ltd. plant in Scunthorpe, UK. He asked Starmer to “explain to my constituents why he is willing to move heaven and earth to save jobs in Scunthorpe while destroying jobs in Scotland.” The SNP leader was referring to the government’s recent move to nationalise British Steel. The UK government took control of the British steel company from its Chinese owner, Jingye Group, after losses from its steelmaking operations forced it to the brink. Now the SNP MP, alongside his colleagues in Westminster and Holyrood, has written to the Labour Party leader, inviting him to see the impacts his government’s energy policy is having on Aberdeen and its people. “We are writing to you as the local MPs and MSPs for Aberdeen, to invite you to urgently visit Aberdeen to meet with local representatives, businesses, trade unions and workers to hear about the damaging impact that Labour government policies are having on Scottish energy jobs – and to discuss the urgent investment needed to protect jobs and deliver prosperity,” the letter reads. ‘Haemorrhaging investment in

Read More »

Oil Gains 3% as Trade Hopes Rise

Oil rose as President Donald Trump announced a trade framework with the UK, spurring some optimism about deals to come. West Texas Intermediate climbed 3.2% to approach $60 a barrel. Trump said the UK would fast-track US items through its customs process and reduce barriers on billions of dollars of agricultural, chemical, energy and industrial exports, including ethanol. Notably, the terms are limited in scope and a 10% baseline tariff remains. The British deal is raising investors’ confidence that agreements can be reached in the more complicated trade talks that lie ahead, specifically negotiations between US and Chinese officials kicking off this weekend. Trump said that the 145% levy against China, the world’s largest crude-importer, could be lowered if talks go well. “The real driver of risk assets today appears to be renewed optimism around progress in the US–China trade talks,” said Rebecca Babin, a senior energy trader at CIBC Private Wealth Group. “It’s also worth noting that sentiment toward crude remains overwhelmingly bearish.” Crude has slid since Trump took office on concerns that his global trade war will dent economic growth and slow energy demand. Adding to the bearishness, OPEC+ has decided to revive idled output faster than expected. Already, the drop in oil prices is spurring American shale producers to cut spending in the Permian Basin. Still, small pockets of bullishness are visible in the options market. There was active trading of Brent $95 September call options, which profit when futures rise. The US on Thursday sanctioned a third Chinese “teapot” oil refinery and various other entities associated with Iran, days ahead of a fourth round of nuclear talks between Washington and Tehran. The failure of the negotiations could push Brent up toward $70 a barrel, Citigroup analysts including Eric Lee said in a note. In the US,

Read More »

Indian LNG Buyers Embrace USA Benchmark to Balance Volatility

Indian liquefied natural gas importers have signed a flurry of long-term purchase agreements linked to the US price benchmark, the latest effort by the nation’s buyers to protect themselves from volatile markets. State-owned companies have signed at least four contracts since December, totaling nearly 11 million tons per year, priced to the Henry Hub index, according to the executives familiar with the deals. Until now, most of India’s long-term contracts have been linked to crude oil, the traditional way to price LNG deals. Pricing the fuel to the Henry Hub index doesn’t necessarily mean that the fuel will come from the US, rather it is a move to hedge risk.  India’s consumers — from power plants to petrochemical facilities — are highly price-sensitive as gas competes head-to-head with cheaper and dirtier alternatives. Companies that relied on the spot market or oil-linked contracts have periodically been forced to cut back purchases due to price spikes. US gas futures have also been relatively less volatile and more liquid than the Asian spot benchmark, the Japan-Korea Marker. “The last ten year average shows that there have been periods during winter months JKM benchmark surged beyond imagination, while Henry Hub prices saw proportionally smaller growth,” Bharat Petroelum Corp Ltd’s Director Finance V.R.K. Gupta said. BPCL in February signed a deal with ADNOC Trading for 2.5 million tons of LNG for five years. The Mumbai-based refiner will evaluate the performance of the deal and may sign more such contracts, Gupta said.  Indian Oil Corp. last week signed a deal with Trafigura for 2.5 million tons, or 27 cargoes, spread over five years, with supplies starting the middle of this year. The recent deals have been signed at a 115% link to Henry Hub plus $5 to $6 per million British thermal units. The supply is

Read More »

PJM, utilities urge FERC to dismiss call for colocation settlement talks

The Federal Energy Regulatory Commission should reject a call for a 90-day pause in its deliberations over the PJM Interconnection’s rules for colocating data centers at power plants, according to PJM, major utilities and other organizations. “The national interest will be best served by a quick dismissal of this proceeding, and a ruling that the existing PJM Tariff remains just and reasonable,” PJM transmission owners said in a Wednesday filing urging FERC to dismiss a call for stakeholder settlement talks. “Rather than fighting about a wish list of new rules, the parties will then instead begin to focus on obtaining service under the rules in place today.” The transmission owners include utility companies such as American Electric Power, Dominion Energy, Duke Energy, Exelon, FirstEnergy and PPL Electric. “The record is clear — no matter how connected to the PJM transmission system, large loads pose both a safety and a reliability concern,” the utilities said. “It is unrealistic to ask the [transmission owners] to accede to these demands in the context of settlement procedures while those questions remain unresolved.” PJM also wants FERC to ignore the call for settlement discussions that was made in late April by the Electric Power Supply Association, the PJM Power Providers Group, Calpine, Cogentrix Energy Power Management, Constellation Energy Generation and LS Power Development. “The Commission should not pause its work on offering the industry guidance on a path forward for co-location arrangements,” PJM said in a Monday filing. The call for settlement talks lacks broad stakeholder support, PJM said, noting it is holding a workshop on “large load” issues on Friday. American Municipal Power, a wholesale power provider for public power utilities, and Northern Virginia Electric Cooperative and Northeastern Rural Electric Membership Corp. also oppose holding settlement talks. Beside the power generators and trade organizations,

Read More »

Tech CEOs warn Senate: Outdated US power grid threatens AI ambitions

The implications are clear: without dramatic improvements to the US energy infrastructure, the nation’s AI ambitions could be significantly constrained by simple physical limitations – the inability to power the massive computing clusters necessary for advanced AI development and deployment. Streamlining permitting processes The tech executives have offered specific recommendations to address these challenges, with several focusing on the need to dramatically accelerate permitting processes for both energy generation and the transmission infrastructure needed to deliver that power to AI facilities, the report added. Intrator specifically called for efforts “to streamline the permitting process to enable the addition of new sources of generation and the transmission infrastructure to deliver it,” noting that current regulatory frameworks were not designed with the urgent timelines of the AI race in mind. This acceleration would help technology companies build and power the massive data centers needed for AI training and inference, which require enormous amounts of electricity delivered reliably and consistently. Beyond the cloud: bringing AI to everyday devices While much of the testimony focused on large-scale infrastructure needs, AMD CEO Lisa Su emphasized that true AI leadership requires “rapidly building data centers at scale and powering them with reliable, affordable, and clean energy sources.” Su also highlighted the importance of democratizing access to AI technologies: “Moving faster also means moving AI beyond the cloud. To ensure every American benefits, AI must be built into the devices we use every day and made as accessible and dependable as electricity.”

Read More »

Networking errors pose threat to data center reliability

Still, IT and networking issues increased in 2024, according to Uptime Institute. The analysis attributed the rise in outages due to increased IT and network complexity, specifically, change management and misconfigurations. “Particularly with distributed services, cloud services, we find that cascading failures often occur when networking equipment is replicated across an entire network,” Lawrence explained. “Sometimes the failure of one forces traffic to move in one direction, overloading capacity at another data center.” The most common causes of major network-related outages were cited as: Configuration/change management failure: 50% Third-party network provider failure: 34% Hardware failure: 31% Firmware/software error: 26% Line breakages: 17% Malicious cyberattack: 17% Network overload/congestion failure: 13% Corrupted firewall/routing tables issues: 8% Weather-related incident: 7% Configuration/change management issues also attributed for 62% of the most common causes of major IT system-/software-related outages. Change-related disruptions consistently are responsible for software-related outages. Human error continues to be one of the “most persistent challenges in data center operations,” according to Uptime’s analysis. The report found that the biggest cause of these failures is data center staff failing to follow established procedures, which has increased by about 10 percentage points compared to 2023. “These are things that were 100% under our control. I mean, we can’t control when the UPS module fails because it was either poorly manufactured, it had a flaw, or something else. This is 100% under our control,” Brown said. The most common causes of major human error-related outages were reported as:

Read More »

Liquid cooling technologies: reducing data center environmental impact

“Highly optimized cold-plate or one-phase immersion cooling technologies can perform on par with two-phase immersion, making all three liquid-cooling technologies desirable options,” the researchers wrote. Factors to consider There are numerous factors to consider when adopting liquid cooling technologies, according to Microsoft’s researchers. First, they advise performing a full environmental, health, and safety analysis, and end-to-end life cycle impact analysis. “Analyzing the full data center ecosystem to include systems interactions across software, chip, server, rack, tank, and cooling fluids allows decision makers to understand where savings in environmental impacts can be made,” they wrote. It is also important to engage with fluid vendors and regulators early, to understand chemical composition, disposal methods, and compliance risks. And associated socioeconomic, community, and business impacts are equally critical to assess. More specific environmental considerations include ozone depletion and global warming potential; the researchers emphasized that operators should only use fluids with low to zero ozone depletion potential (ODP) values, and not hydrofluorocarbons or carbon dioxide. It is also critical to analyze a fluid’s viscosity (thickness or stickiness), flammability, and overall volatility. And operators should only use fluids with minimal bioaccumulation (the buildup of chemicals in lifeforms, typically in fish) and terrestrial and aquatic toxicity. Finally, once up and running, data center operators should monitor server lifespan and failure rates, tracking performance uptime and adjusting IT refresh rates accordingly.

Read More »

Cisco unveils prototype quantum networking chip

Clock synchronization allows for coordinated time-dependent communications between end points that might be cloud databases or in large global databases that could be sitting across the country or across the world, he said. “We saw recently when we were visiting Lawrence Berkeley Labs where they have all of these data sources such as radio telescopes, optical telescopes, satellites, the James Webb platform. All of these end points are taking snapshots of a piece of space, and they need to synchronize those snapshots to the picosecond level, because you want to detect things like meteorites, something that is moving faster than the rotational speed of planet Earth. So the only way you can detect that quickly is if you synchronize these snapshots at the picosecond level,” Pandey said. For security use cases, the chip can ensure that if an eavesdropper tries to intercept the quantum signals carrying the key, they will likely disturb the state of the qubits, and this disturbance can be detected by the legitimate communicating parties and the link will be dropped, protecting the sender’s data. This feature is typically implemented in a Quantum Key Distribution system. Location information can serve as a critical credential for systems to authenticate control access, Pandey said. The prototype quantum entanglement chip is just part of the research Cisco is doing to accelerate practical quantum computing and the development of future quantum data centers.  The quantum data center that Cisco envisions would have the capability to execute numerous quantum circuits, feature dynamic network interconnection, and utilize various entanglement generation protocols. The idea is to build a network connecting a large number of smaller processors in a controlled environment, the data center warehouse, and provide them as a service to a larger user base, according to Cisco.  The challenges for quantum data center network fabric

Read More »

Zyxel launches 100GbE switch for enterprise networks

Port specifications include: 48 SFP28 ports supporting dual-rate 10GbE/25GbE connectivity 8 QSFP28 ports supporting 100GbE connections Console port for direct management access Layer 3 routing capabilities include static routing with support for access control lists (ACLs) and VLAN segmentation. The switch implements IEEE 802.1Q VLAN tagging, port isolation, and port mirroring for traffic analysis. For link aggregation, the switch supports IEEE 802.3ad for increased throughput and redundancy between switches or servers. Target applications and use cases The CX4800-56F targets multiple deployment scenarios where high-capacity backbone connectivity and flexible port configurations are required. “This will be for service providers initially or large deployments where they need a high capacity backbone to deliver a primarily 10G access layer to the end point,” explains Nguyen. “Now with Wi-Fi 7, more 10G/25G capable POE switches are being powered up and need interconnectivity without the bottleneck. We see this for data centers, campus, MDU (Multi-Dwelling Unit) buildings or community deployments.” Management is handled through Zyxel’s NebulaFlex Pro technology, which supports both standalone configuration and cloud management via the Nebula Control Center (NCC). The switch includes a one-year professional pack license providing IGMP technology and network analytics features. The SFP28 ports maintain backward compatibility between 10G and 25G standards, enabling phased migration paths for organizations transitioning between these speeds.

Read More »

Engineers rush to master new skills for AI-driven data centers

According to the Uptime Institute survey, 57% of data centers are increasing salary spending. Data center job roles that saw the highest increases were in operations management – 49% of data center operators said they saw highest increases in this category – followed by junior and mid-level operations staff at 45%, and senior management and strategy at 35%. Other job categories that saw salary growth were electrical, at 32% and mechanical, at 23%. Organizations are also paying premiums on top of salaries for particular skills and certifications. Foote Partners tracks pay premiums for more than 1,300 certified and non-certified skills for IT jobs in general. The company doesn’t segment the data based on whether the jobs themselves are data center jobs, but it does track 60 skills and certifications related to data center management, including skills such as storage area networking, LAN, and AIOps, and 24 data center-related certificates from Cisco, Juniper, VMware and other organizations. “Five of the eight data center-related skills recording market value gains in cash pay premiums in the last twelve months are all AI-related skills,” says David Foote, chief analyst at Foote Partners. “In fact, they are all among the highest-paying skills for all 723 non-certified skills we report.” These skills bring in 16% to 22% of base salary, he says. AIOps, for example, saw an 11% increase in market value over the past year, now bringing in a premium of 20% over base salary, according to Foote data. MLOps now brings in a 22% premium. “Again, these AI skills have many uses of which the data center is only one,” Foote adds. The percentage increase in the specific subset of these skills in data centers jobs may vary. The Uptime Institute survey suggests that the higher pay is motivating workers to stay in the

Read More »

Microsoft will invest $80B in AI data centers in fiscal 2025

And Microsoft isn’t the only one that is ramping up its investments into AI-enabled data centers. Rival cloud service providers are all investing in either upgrading or opening new data centers to capture a larger chunk of business from developers and users of large language models (LLMs).  In a report published in October 2024, Bloomberg Intelligence estimated that demand for generative AI would push Microsoft, AWS, Google, Oracle, Meta, and Apple would between them devote $200 billion to capex in 2025, up from $110 billion in 2023. Microsoft is one of the biggest spenders, followed closely by Google and AWS, Bloomberg Intelligence said. Its estimate of Microsoft’s capital spending on AI, at $62.4 billion for calendar 2025, is lower than Smith’s claim that the company will invest $80 billion in the fiscal year to June 30, 2025. Both figures, though, are way higher than Microsoft’s 2020 capital expenditure of “just” $17.6 billion. The majority of the increased spending is tied to cloud services and the expansion of AI infrastructure needed to provide compute capacity for OpenAI workloads. Separately, last October Amazon CEO Andy Jassy said his company planned total capex spend of $75 billion in 2024 and even more in 2025, with much of it going to AWS, its cloud computing division.

Read More »

John Deere unveils more autonomous farm machines to address skill labor shortage

Join our daily and weekly newsletters for the latest updates and exclusive content on industry-leading AI coverage. Learn More Self-driving tractors might be the path to self-driving cars. John Deere has revealed a new line of autonomous machines and tech across agriculture, construction and commercial landscaping. The Moline, Illinois-based John Deere has been in business for 187 years, yet it’s been a regular as a non-tech company showing off technology at the big tech trade show in Las Vegas and is back at CES 2025 with more autonomous tractors and other vehicles. This is not something we usually cover, but John Deere has a lot of data that is interesting in the big picture of tech. The message from the company is that there aren’t enough skilled farm laborers to do the work that its customers need. It’s been a challenge for most of the last two decades, said Jahmy Hindman, CTO at John Deere, in a briefing. Much of the tech will come this fall and after that. He noted that the average farmer in the U.S. is over 58 and works 12 to 18 hours a day to grow food for us. And he said the American Farm Bureau Federation estimates there are roughly 2.4 million farm jobs that need to be filled annually; and the agricultural work force continues to shrink. (This is my hint to the anti-immigration crowd). John Deere’s autonomous 9RX Tractor. Farmers can oversee it using an app. While each of these industries experiences their own set of challenges, a commonality across all is skilled labor availability. In construction, about 80% percent of contractors struggle to find skilled labor. And in commercial landscaping, 86% of landscaping business owners can’t find labor to fill open positions, he said. “They have to figure out how to do

Read More »

2025 playbook for enterprise AI success, from agents to evals

Join our daily and weekly newsletters for the latest updates and exclusive content on industry-leading AI coverage. Learn More 2025 is poised to be a pivotal year for enterprise AI. The past year has seen rapid innovation, and this year will see the same. This has made it more critical than ever to revisit your AI strategy to stay competitive and create value for your customers. From scaling AI agents to optimizing costs, here are the five critical areas enterprises should prioritize for their AI strategy this year. 1. Agents: the next generation of automation AI agents are no longer theoretical. In 2025, they’re indispensable tools for enterprises looking to streamline operations and enhance customer interactions. Unlike traditional software, agents powered by large language models (LLMs) can make nuanced decisions, navigate complex multi-step tasks, and integrate seamlessly with tools and APIs. At the start of 2024, agents were not ready for prime time, making frustrating mistakes like hallucinating URLs. They started getting better as frontier large language models themselves improved. “Let me put it this way,” said Sam Witteveen, cofounder of Red Dragon, a company that develops agents for companies, and that recently reviewed the 48 agents it built last year. “Interestingly, the ones that we built at the start of the year, a lot of those worked way better at the end of the year just because the models got better.” Witteveen shared this in the video podcast we filmed to discuss these five big trends in detail. Models are getting better and hallucinating less, and they’re also being trained to do agentic tasks. Another feature that the model providers are researching is a way to use the LLM as a judge, and as models get cheaper (something we’ll cover below), companies can use three or more models to

Read More »

OpenAI’s red teaming innovations define new essentials for security leaders in the AI era

Join our daily and weekly newsletters for the latest updates and exclusive content on industry-leading AI coverage. Learn More OpenAI has taken a more aggressive approach to red teaming than its AI competitors, demonstrating its security teams’ advanced capabilities in two areas: multi-step reinforcement and external red teaming. OpenAI recently released two papers that set a new competitive standard for improving the quality, reliability and safety of AI models in these two techniques and more. The first paper, “OpenAI’s Approach to External Red Teaming for AI Models and Systems,” reports that specialized teams outside the company have proven effective in uncovering vulnerabilities that might otherwise have made it into a released model because in-house testing techniques may have missed them. In the second paper, “Diverse and Effective Red Teaming with Auto-Generated Rewards and Multi-Step Reinforcement Learning,” OpenAI introduces an automated framework that relies on iterative reinforcement learning to generate a broad spectrum of novel, wide-ranging attacks. Going all-in on red teaming pays practical, competitive dividends It’s encouraging to see competitive intensity in red teaming growing among AI companies. When Anthropic released its AI red team guidelines in June of last year, it joined AI providers including Google, Microsoft, Nvidia, OpenAI, and even the U.S.’s National Institute of Standards and Technology (NIST), which all had released red teaming frameworks. Investing heavily in red teaming yields tangible benefits for security leaders in any organization. OpenAI’s paper on external red teaming provides a detailed analysis of how the company strives to create specialized external teams that include cybersecurity and subject matter experts. The goal is to see if knowledgeable external teams can defeat models’ security perimeters and find gaps in their security, biases and controls that prompt-based testing couldn’t find. What makes OpenAI’s recent papers noteworthy is how well they define using human-in-the-middle

Read More »