When we set out to write a story on the best available estimates for AI’s energy and emissions burden, we knew there would be caveats and uncertainties to these numbers. But, we quickly discovered, the caveats are the story too.
Measuring the energy used by an AI model is not like evaluating a car’s fuel economy or an appliance’s energy rating. There’s no agreed-upon method or public database of values. There are no regulators who enforce standards, and consumers don’t get the chance to evaluate one model against another.
Despite the fact that billions of dollars are being poured into reshaping energy infrastructure around the needs of AI, no one has settled on a way to quantify AI’s energy usage. Worse, companies are generally unwilling to disclose their own piece of the puzzle. There are also limitations to estimating the emissions associated with that energy demand, because the grid hosts a complicated, ever-changing mix of energy sources.
It’s a big mess, basically. So, that said, here are the many variables, assumptions, and caveats that we used to calculate the consequences of an AI query. (You can see the full results of our investigation here.)
Measuring the energy a model uses
Companies like OpenAI, dealing in “closed-source” models, generally offer access to their systems through an interface where you input a question and receive an answer. What happens in between—which data center in the world processes your request, the energy it takes to do so, and the carbon intensity of the energy sources used—remains a secret, knowable only to the companies. There are few incentives for them to release this information, and so far, most have not.
That’s why, for our analysis, we looked at open-source models. They serve as a very imperfect proxy but the best one we have. (OpenAI, Microsoft, and Google declined to share specifics on how much energy their closed-source models use.)
The best resources for measuring the energy consumption of open-source AI models are AI Energy Score, ML.Energy, and MLPerf Power. The team behind ML.Energy assisted us with our text and image model calculations, and the team behind AI Energy Score helped with our video model calculations.
Text models
AI models use up energy in two phases: when they initially learn from vast amounts of data, called training, and when they respond to queries, called inference. When ChatGPT was launched a few years ago, training was the focus, as tech companies raced to keep up and build ever-bigger models. But now, inference is where the most energy is used.
The most accurate way to understand how much energy an AI model uses in the inference stage is to directly measure the amount of electricity used by the server handling the request. Servers contain all sorts of components—powerful chips called GPUs that do the bulk of the computing, other chips called CPUs, fans to keep everything cool, and more. Researchers typically measure the amount of power the GPU draws and estimate the rest (more on this shortly).
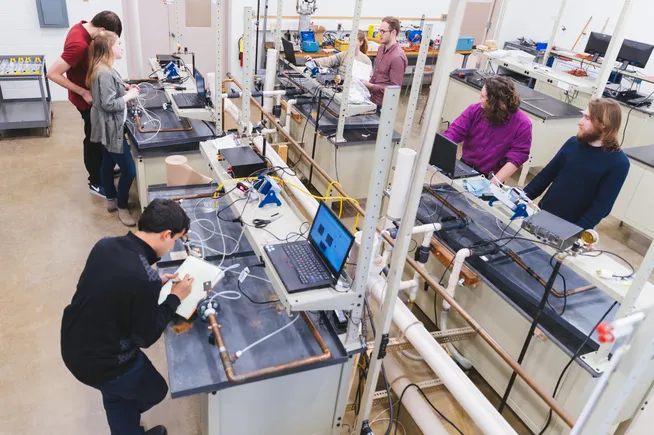
To do this, we turned to PhD candidate Jae-Won Chung and associate professor Mosharaf Chowdhury at the University of Michigan, who lead the ML.Energy project. Once we collected figures for different models’ GPU energy use from their team, we had to estimate how much energy is used for other processes, like cooling. We examined research literature, including a 2024 paper from Microsoft, to understand how much of a server’s total energy demand GPUs are responsible for. It turns out to be about half. So we took the team’s GPU energy estimate and doubled it to get a sense of total energy demands.
The ML.Energy team uses a batch of 500 prompts from a larger dataset to test models. The hardware is kept the same throughout; the GPU is a popular Nvidia chip called the H100. We decided to focus on models of three sizes from the Meta Llama family: small (8 billion parameters), medium (70 billion), and large (405 billion). We also identified a selection of prompts to test. We compared these with the averages for the entire batch of 500 prompts.
Image models
Stable Diffusion 3 from Stability AI is one of the most commonly used open-source image-generating models, so we made it our focus. Though we tested multiple sizes of the text-based Meta Llama model, we focused on one of the most popular sizes of Stable Diffusion 3, with 2 billion parameters.
The team uses a dataset of example prompts to test a model’s energy requirements. Though the energy used by large language models is determined partially by the prompt, this isn’t true for diffusion models. Diffusion models can be programmed to go through a prescribed number of “denoising steps” when they generate an image or video, with each step being an iteration of the algorithm that adds more detail to the image. For a given step count and model, all images generated have the same energy footprint.
The more steps, the higher quality the end result—but the more energy used. Numbers of steps vary by model and application, but 25 is pretty common, and that’s what we used for our standard quality. For higher quality, we used 50 steps.
We mentioned that GPUs are usually responsible for about half of the energy demands of large language model requests. There is not sufficient research to know how this changes for diffusion models that generate images and videos. In the absence of a better estimate, and after consulting with researchers, we opted to stick with this 50% rule of thumb for images and videos too.
Video models
Chung and Chowdhury do test video models, but only ones that generate short, low-quality GIFs. We don’t think the videos these models produce mirror the fidelity of the AI-generated video that many people are used to seeing.
Instead, we turned to Sasha Luccioni, the AI and climate lead at Hugging Face, who directs the AI Energy Score project. She measures the energy used by the GPU during AI requests. We chose two versions of the CogVideoX model to test: an older, lower-quality version and a newer, higher-quality one.
We asked Luccioni to use her tool, called Code Carbon, to test both and measure the results of a batch of video prompts we selected, using the same hardware as our text and image tests to keep as many variables as possible the same. She reported the GPU energy demands, which we again doubled to estimate total energy demands.
Tracing where that energy comes from
After we understand how much energy it takes to respond to a query, we can translate that into the total emissions impact. Doing so requires looking at the power grid from which data centers draw their electricity.
Nailing down the climate impact of the grid can be complicated, because it’s both interconnected and incredibly local. Imagine the grid as a system of connected canals and pools of water. Power plants add water to the canals, and electricity users, or loads, siphon it out. In the US, grid interconnections stretch all the way across the country. So, in a way, we’re all connected, but we can also break the grid up into its component pieces to get a sense for how energy sources vary across the country.
Understanding carbon intensity
The key metric to understand here is called carbon intensity, which is basically a measure of how many grams of carbon dioxide pollution are released for every kilowatt-hour of electricity that’s produced.
To get carbon intensity figures, we reached out to Electricity Maps, a Danish startup company that gathers data on grids around the world. The team collects information from sources including governments and utilities and uses them to publish historical and real-time estimates of the carbon intensity of the grid. You can find more about their methodology here.
The company shared with us historical data from 2024, both for the entire US and for a few key balancing authorities (more on this in a moment). After discussions with Electricity Maps founder Olivier Corradi and other experts, we made a few decisions about which figures we would use in our calculations.
One way to measure carbon intensity is to simply look at all the power plants that are operating on the grid, add up the pollution they’re producing at the moment, and divide that total by the electricity they’re producing. But that doesn’t account for the emissions that are associated with building and tearing down power plants, which can be significant. So we chose to use carbon intensity figures that account for the whole life cycle of a power plant.
We also chose to use the consumption-based carbon intensity of energy rather than production-based. This figure accounts for imports and exports moving between different parts of the grid and best represents the electricity that’s being used, in real time, within a given region.
For most of the calculations you see in the story, we used the average carbon intensity for the US for 2024, according to Electricity Maps, which is 402.49 grams of carbon dioxide equivalent per kilowatt-hour.
Understanding balancing authorities
While understanding the picture across the entire US can be helpful, the grid can look incredibly different in different locations.
One way we can break things up is by looking at balancing authorities. These are independent bodies responsible for grid balancing in a specific region. They operate mostly independently, though there’s a constant movement of electricity between them as well. There are 66 balancing authorities in the US, and we can calculate a carbon intensity for the part of the grid encompassed by a specific balancing authority.
Electricity Maps provided carbon intensity figures for a few key balancing authorities, and we focused on several that play the largest roles in data center operations. ERCOT (which covers most of Texas) and PJM (a cluster of states on the East Coast, including Virginia, Pennsylvania, and New Jersey) are two of the regions with the largest burden of data centers, according to research from the Harvard School of Public Health.
We added CAISO (in California) because it covers the most populated state in the US. CAISO also manages a grid with a significant number of renewable energy sources, making it a good example of how carbon intensity can change drastically depending on the time of day. (In the middle of the day, solar tends to dominate, while natural gas plays a larger role overnight, for example.)
One key caveat here is that we’re not entirely sure where companies tend to send individual AI inference requests. There are clusters of data centers in the regions we chose as examples, but when you use a tech giant’s AI model, your request could be handled by any number of data centers owned or contracted by the company. One reasonable approximation is location: It’s likely that the data center servicing a request is close to where it’s being made, so a request on the West Coast might be most likely to be routed to a data center on that side of the country.
Explaining what we found
To better contextualize our calculations, we introduced a few comparisons people might be more familiar with than kilowatt-hours and grams of carbon dioxide. In a few places, we took the amount of electricity estimated to be used by a model and calculated how long that electricity would be able to power a standard microwave, as well as how far it might take someone on an e-bike.
In the case of the e-bike, we assumed an efficiency of 25 watt-hours per mile, which falls in the range of frequently cited efficiencies for a pedal-assisted bike. For the microwave, we assumed an 800-watt model, which falls within the average range in the US.
We also introduced a comparison to contextualize greenhouse gas emissions: miles driven in a gas-powered car. For this, we used data from the US Environmental Protection Agency, which puts the weighted average fuel economy of vehicles in the US in 2022 at 393 grams of carbon dioxide equivalent per mile.
Predicting how much energy AI will use in the future
After measuring the energy demand of an individual query and the emissions it generated, it was time to estimate how all of this added up to national demand.
There are two ways to do this. In a bottom-up analysis, you estimate how many individual queries there are, calculate the energy demands of each, and add them up to determine the total. For a top-down look, you estimate how much energy all data centers are using by looking at larger trends.
Bottom-up is particularly difficult, because, once again, closed-source companies do not share such information and declined to talk specifics with us. While we can make some educated guesses to give us a picture of what might be happening right now, looking into the future is perhaps better served by taking a top-down approach.
This data is scarce as well. The most important report was published in December by the Lawrence Berkeley National Laboratory, which is funded by the Department of Energy, and the report authors noted that it’s only the third such report released in the last 20 years. Academic climate and energy researchers we spoke with said it’s a major problem that AI is not considered its own economic sector for emissions measurements, and there aren’t rigorous reporting requirements. As a result, it’s difficult to track AI’s climate toll.
Still, we examined the report’s results, compared them with other findings and estimates, and consulted independent experts about the data. While much of the report was about data centers more broadly, we drew out data points that were specific to the future of AI.
Company goals
We wanted to contrast these figures with the amounts of energy that AI companies themselves say they need. To do so, we collected reports by leading tech and AI companies about their plans for energy and data center expansions, as well as the dollar amounts they promised to invest. Where possible, we fact-checked the promises made in these claims. (Meta and Microsoft’s pledges to use more nuclear power, for example, would indeed reduce the carbon emissions of the companies, but it will take years, if not decades, for these additional nuclear plants to come online.)
Requests to companies
We submitted requests to Microsoft, Google, and OpenAI to have data-driven conversations about their models’ energy demands for AI inference. None of the companies made executives or leadership available for on-the-record interviews about their energy usage.
This story was supported by a grant from the Tarbell Center for AI Journalism.