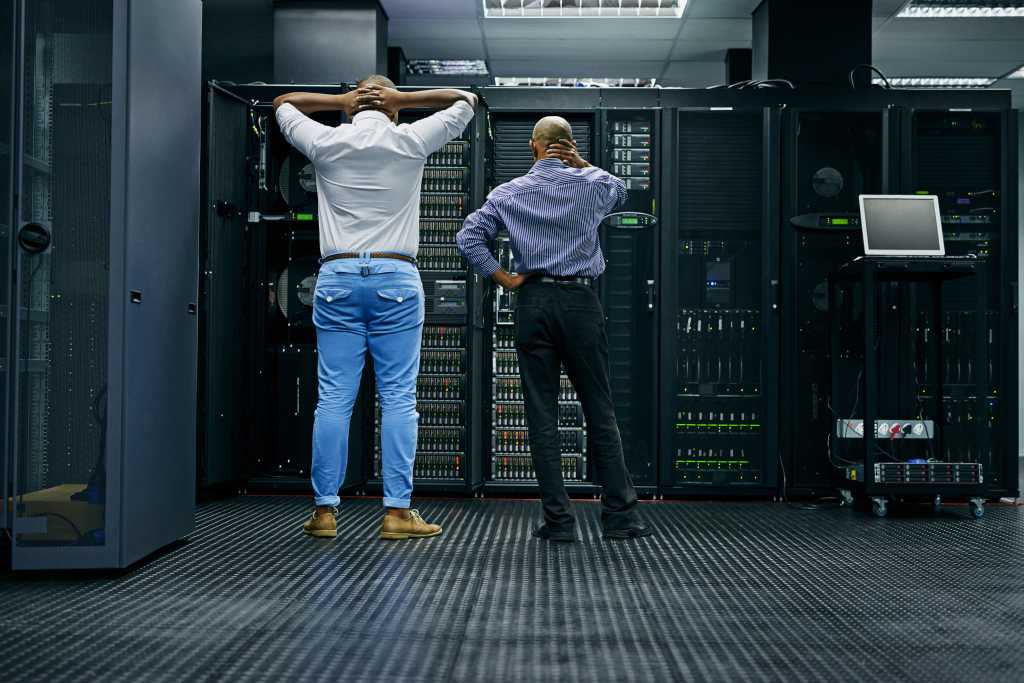
“Advisor knows how to actually do networking things and can be more like a teammate,” Freedman explained. “It will go, reason, make a plan, use the different products, go look across the domains of telemetry and awareness, and say, ‘here’s what I think is going on, and here’s what you should do about it.’” In practice, an engineer can now ask, “What might be causing this customer to be down?” and the system will autonomously check traffic volumes, review recent firewall changes, examine the timing of events, and identify whether a specific rule change correlates with the traffic drop. It presents findings with the underlying data and suggests specific remediation steps.
Data engine extensions for contextual analysis
The autonomous investigation capability required Kentik to extend its data platform beyond flow records and device metrics. The Kentik Data Engine processes approximately one trillion telemetry points daily from NetFlow, sFlow, device APIs, cloud provider APIs, and synthetic monitoring. But correlation analysis requires additional context that wasn’t previously captured.
“We needed configs, which we didn’t have,” Freedman said. “We needed graph and topology, which we had, but in places.”
The company added configuration tracking, topology modeling, and relationship mapping to the platform. This allows the system to answer questions like whether a firewall rule change affected specific customer IP addresses or whether an IGP metric adjustment could have influenced routing decisions. The context layer connects time series data with network state information.
The underlying database architecture uses a columnar store for historical data and a streaming database for real-time analysis. Both use the same query language, which allows the system to correlate events across time windows without moving data between systems.
Foundation models and workflow training
Kentik uses commercial large language models (LLMs) rather than training its own from scratch.
