Introduction
If you’ve ever analyzed data using built-in t-test functions, such as those in R or SciPy, here’s a question for you: have you ever adjusted the default setting for the alternative hypothesis? If your answer is no—or if you’re not even sure what this means—then this blog post is for you!
The alternative hypothesis parameter, commonly referred to as “one-tailed” versus “two-tailed” in statistics, defines the expected direction of the difference between control and treatment groups. In a two-tailed test, we assess whether there is any difference in mean values between the groups, without specifying a direction. A one-tailed test, on the other hand, posits a specific direction—whether the control group’s mean is either less than or greater than that of the treatment group.
Choosing between one- and two-tailed hypotheses might seem like a minor detail, but it affects every stage of A/B testing: from test planning to Data Analysis and results interpretation. This article builds a theoretical foundation on why the hypothesis direction matters and explores the pros and cons of each approach.
One-tailed vs. two-tailed hypothesis testing: Understanding the difference
To understand the importance of choosing between one-tailed and two-tailed hypotheses, let’s briefly review the basics of the t-test, the commonly used method in A/B testing. Like other Hypothesis Testing methods, the t-test begins with a conservative assumption: there is no difference between the two groups (the null hypothesis). Only if we find strong evidence against this assumption can we reject the null hypothesis and conclude that the treatment has had an effect.
But what qualifies as “strong evidence”? To that end, a rejection region is determined under the null hypothesis and all results that fall within this region are deemed so unlikely that we take them as evidence against the feasibility of the null hypothesis. The size of this rejection region is based on a predetermined probability, known as alpha (α), which represents the likelihood of incorrectly rejecting the null hypothesis.
What does this have to do with the direction of the alternative hypothesis? Quite a bit, actually. While the alpha level determines the size of the rejection region, the alternative hypothesis dictates its placement. In a one-tailed test, where we hypothesize a specific direction of difference, the rejection region is situated in only one tail of the distribution. For a hypothesized positive effect (e..g., that the treatment group mean is higher than the control group mean), the rejection region would lie in the right tail, creating a right-tailed test. Conversely, if we hypothesize a negative effect (e.g., that the treatment group mean is less than the control group mean), the rejection region would be placed in the left tail, resulting in a left-tailed test.
In contrast, a two-tailed test allows for the detection of a difference in either direction, so the rejection region is split between both tails of the distribution. This accommodates the possibility of observing extreme values in either direction, whether the effect is positive or negative.
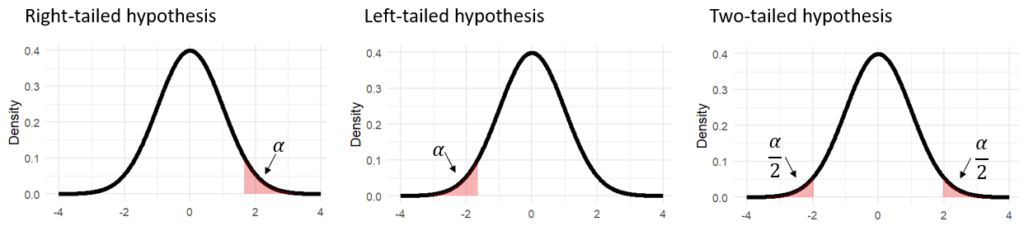
To build intuition, let’s visualize how the rejection regions appear under the different hypotheses. Recall that according to the null hypothesis, the difference between the two groups should center around zero. Thanks to the central limit theorem, we also know this distribution approximates a normal distribution. Consequently, the rejection areas corresponding to the different alternative hypothesis look like that:
Why does it make a difference?
The choice of direction for the alternative hypothesis impacts the entire A/B testing process, starting with the planning phase—specifically, in determining the sample size. Sample size is calculated based on the desired power of the test, which is the probability of detecting a true difference between the two groups when one exists. To compute power, we examine the area under the alternative hypothesis that corresponds to the rejection region (since power reflects the ability to reject the null hypothesis when the alternative hypothesis is true).
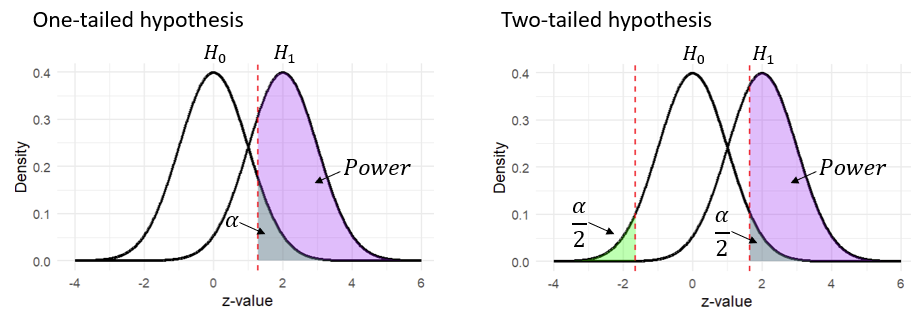
Since the direction of the hypothesis affects the size of this rejection region, power is generally lower for a two-tailed hypothesis. This is due to the rejection region being divided across both tails, making it more challenging to detect an effect in any one direction. The following graph illustrates the comparison between the two types of hypotheses. Note that the purple area is larger for the one-tailed hypothesis, compared to the two-tailed hypothesis:
In practice, to maintain the desired power level, we compensate for the reduced power of a two-tailed hypothesis by increasing the sample size (Increasing sample size raises power, though the mechanics of this can be a topic for a separate article). Thus, the choice between one- and two-tailed hypotheses directly influences the required sample size for your test.
Beyond the planning phase, the choice of alternative hypothesis directly impacts the analysis and interpretation of results. There are cases where a test may reach significance with a one-tailed approach but not with a two-tailed one, and vice versa. Reviewing the previous graph can help illustrate this: for example, a result in the left tail might be significant under a two-tailed hypothesis but not under a right one-tailed hypothesis. Conversely, certain results might fall within the rejection region of a right one-tailed test but lie outside the rejection area in a two-tailed test.
How to decide between a one-tailed and two-tailed hypothesis
Let’s start with the bottom line: there’s no absolute right or wrong choice here. Both approaches are valid, and the primary consideration should be your specific business needs. To help you decide which option best suits your company, we’ll outline the key pros and cons of each.
At first glance, a one-tailed alternative may appear to be the clear choice, as it often aligns better with business objectives. In industry applications, the focus is typically on improving specific metrics rather than exploring a treatment’s impact in both directions. This is especially relevant in A/B testing, where the goal is often to optimize conversion rates or enhance revenue. If the treatment doesn’t lead to a significant improvement the examined change won’t be implemented.
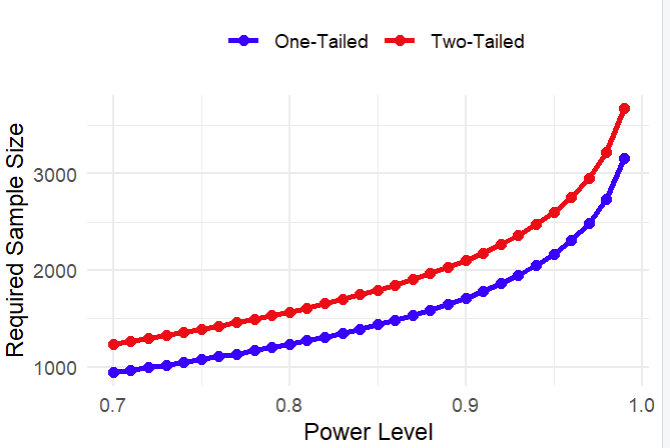
Beyond this conceptual advantage, we have already mentioned one key benefit of a one-tailed hypothesis: it requires a smaller sample size. Thus, choosing a one-tailed alternative can save both time and resources. To illustrate this advantage, the following graphs show the required sample sizes for one- and two-tailed hypotheses with different power levels (alpha is set at 5%).
In this context, the decision between one- and two-tailed hypotheses becomes particularly important in sequential testing—a method that allows for ongoing data analysis without inflating the alpha level. Here, selecting a one-tailed test can significantly reduce the duration of the test, enabling faster decision-making, which is especially valuable in dynamic business environments where prompt responses are essential.
However, don’t be too quick to dismiss the two-tailed hypothesis! It has its own advantages. In some business contexts, the ability to detect “negative significant results” is a major benefit. As one client once shared, he preferred negative significant results over inconclusive ones because they offer valuable learning opportunities. Even if the outcome wasn’t as expected, he could conclude that the treatment had a negative effect and gain insights into the product.
Another benefit of two-tailed tests is their straightforward interpretation using confidence intervals (CIs). In two-tailed tests, a CI that doesn’t include zero directly indicates significance, making it easier for practitioners to interpret results at a glance. This clarity is particularly appealing since CIs are widely used in A/B testing platforms. Conversely, with one-tailed tests, a significant result might still include zero in the CI, potentially leading to confusion or mistrust in the findings. Although one-sided confidence intervals can be employed with one-tailed tests, this practice is less common.
Conclusions
By adjusting a single parameter, you can significantly impact your A/B testing: specifically, the sample size you need to collect and the interpretation of the results. When deciding between one- and two-tailed hypotheses, consider factors such as the available sample size, the advantages of detecting negative effects, and the convenience of aligning confidence intervals (CIs) with hypothesis testing. Ultimately, this decision should be made thoughtfully, taking into account what best fits your business needs.
(Note: all the images in this post were created by the author)