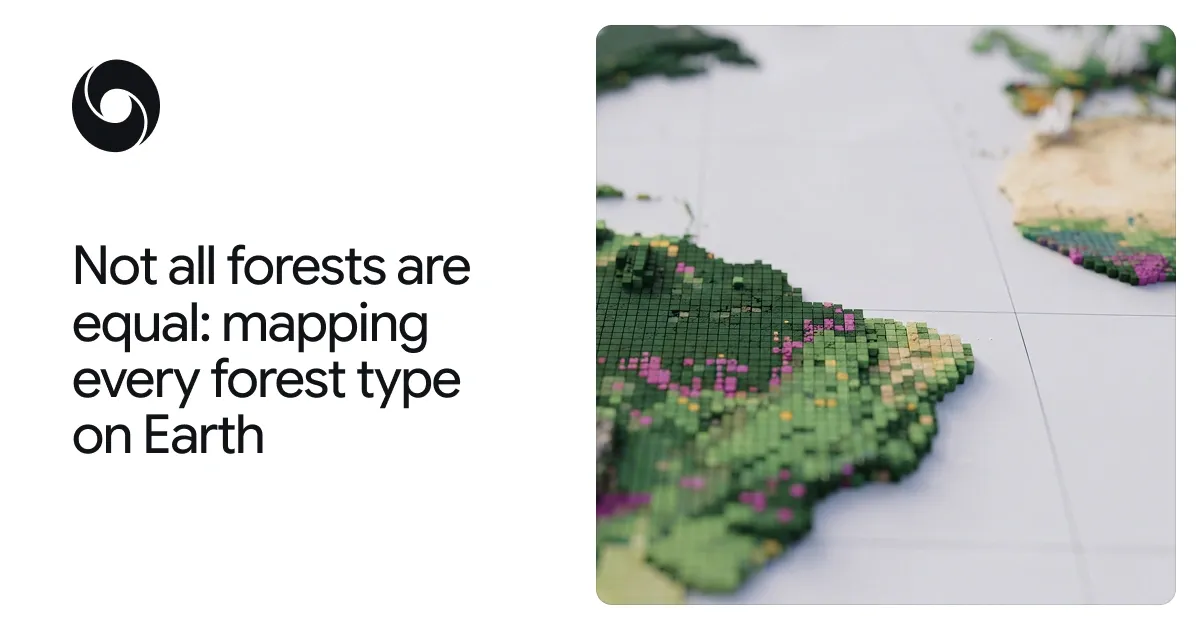
A new 10-meter resolution map shows which of the world’s forests are natural, planted, or farmed, and how they are changing over time
Protecting the planet’s forests starts with a simple question: what type of forest are we looking at? From space, an old-growth rainforest, a eucalyptus plantation, and an oil palm estate can look like the same patch of green. But they hold very different amounts of carbon and biodiversity. Telling them apart, and knowing how each patch has changed over time, shows us where conservation is working and where natural forests are being converted into plantations and farms.
Today, Google DeepMind and Google Research, together with the World Resources Institute (WRI) and the International Institute for Applied Systems Analysis (IIASA), are releasing Forest Typology (ForTy) 2020, a global map that categorizes every 10-by-10-meter patch of land on Earth into six distinct forest and land-use types, a key baseline for the EU’s deforestation regulation. Alongside it, we’re sharing an early time series that tracks how these forests changed each year from 2017 to 2025, including where natural forests were replaced by plantations or farms. For the first time, users can see at 10-meter detail worldwide, year by year, not just where forest was lost, but what replaced it: a timber plantation, a tree-crop farm or other land.
Why “tree cover” isn’t enough
All forests store carbon and, together, forests are home to most of the world’s land-based plant and animal species. But a forest’s ecological value also depends on its history: a primary forest that has never been cleared holds far more carbon and biodiversity than a single-species timber plantation that is harvested every decade or two.
Most global maps only indicate whether trees are present. That’s a challenge for those trying to protect natural forests. The European Union’s regulation on deforestation-free products (EUDR), for example, requires that products like coffee, cocoa or palm oil do not originate from land that was forest in 2020 and has since been converted to agriculture. Similarly, wood products, such as furniture, must also be free of forest degradation: they can’t come from primary forests that have since been converted into plantation or planted forests, or from naturally regenerating forests that have since been converted into plantation forests. As a result, companies and regulators need to know not just where trees are, but what kind of forest they form (primary or regrowing, planted or plantation, forest or farm) and what replaces that forest after a harvest.
Last year, we jointly released Natural Forests of the World 2020, a 10-meter resolution global map that separated natural forests from all other tree cover. It offered a starting point to help companies and regulators implement the EU Deforestation Regulation, and to support commodity producers in meeting their commitments not to convert natural forest. That map answered one question for every patch of land: was it natural forest in 2020 or not? ForTy goes further, showing what kind of forest is there, from primary forest to timber plantation to tree crops, and, with the new time series, how that changes each year.
How ForTy classifies the world’s forests
Specifically, ForTy sorts land into six categories based on definitions from the UN Food and Agriculture Organization (FAO):
- Primary forest: native forest with no visible signs of human disturbance.
- Naturally regenerating forest: forest that grew back on its own, for example after logging or fire.
- Planted forest: forest that people planted or seeded, and managed over long cycles.
- Plantation forest: fast-growing, intensively managed tree farms, often of one species.
- Tree crops and agroforestry: farms that grow things other than wood, like oil palm, rubber, cocoa, or fruit.
- Other land: everything else, from grassland and cropland to cities and water.