This article is part of a series of articles on automating Data Cleaning for any tabular dataset.
You can test the feature described in this article on your own dataset using the CleanMyExcel.io service, which is free and requires no registration.
Start with the why
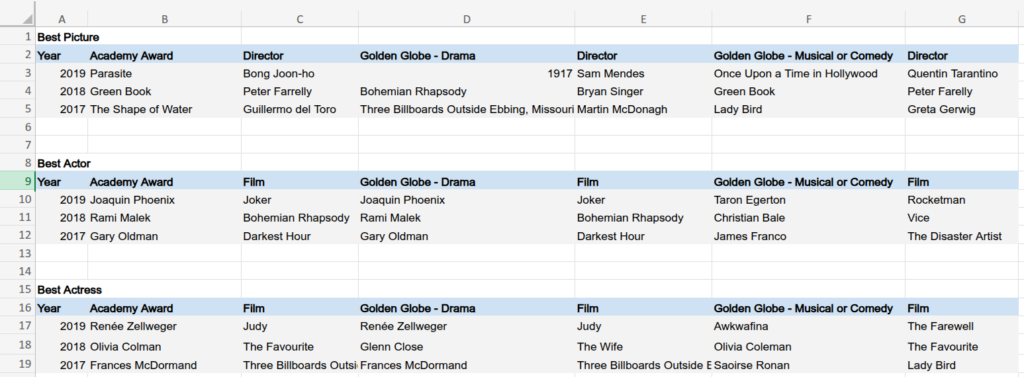
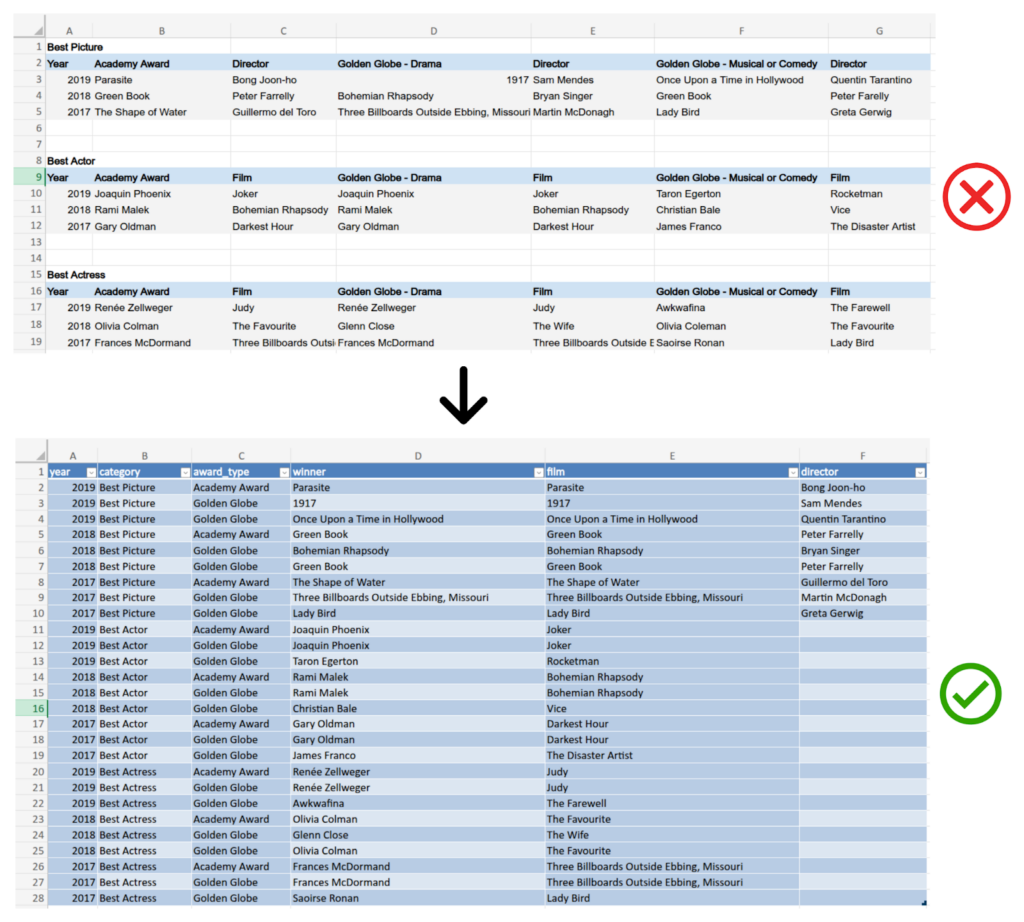
Let’s consider this Excel spreadsheet, which contains information on awards given to films. It is sourced from the book Cleaning Data for Effective Data Science and is available here.
This is a typical and common spreadsheet that everyone may own and deal with in their daily tasks. But what is wrong with it?
To answer that question, let us first recall the end goal of using data: to derive insights that help guide our decisions in our personal or business lives. This process requires at least two crucial things:
- Reliable data: clean data without issues, inconsistencies, duplicates, missing values, etc.
- Tidy data: a well-normalised data frame that facilitates processing and manipulation.
The second point is the primary foundation of any analysis, including dealing with data quality.
Returning to our example, imagine we want to perform the following actions:
1. For each film involved in multiple awards, list the award and year it is associated with.
2. For each actor/actress winning multiple awards, list the film and award they are associated with.
3. Check that all actor/actress names are correct and well-standardised.
Naturally, this example dataset is small enough to derive those insights by eye or by hand if we structure it (as quickly as coding). But imagine now that the dataset contains the entire awards history; this would be time-consuming, painful, and error-prone without any automation.
Reading this spreadsheet and directly understanding its structure by a machine is difficult, as it does not follow good practices of data arrangement. That is why tidying data is so important. By ensuring that data is structured in a machine-friendly way, we can simplify parsing, automate quality checks, and enhance business analysis—all without altering the actual content of the dataset.
Example of a reshaping of this data:
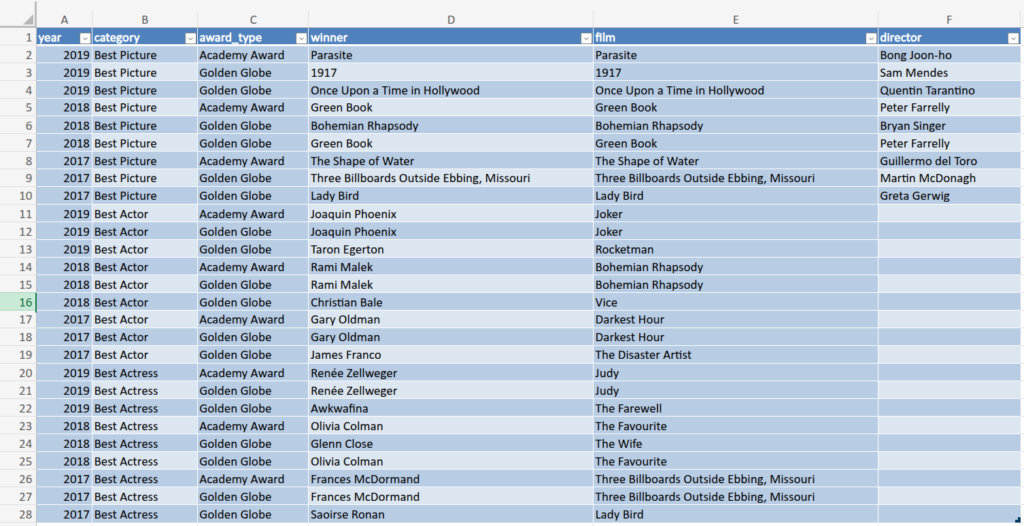
Now, anyone can use low/no-code tools or code-based queries (SQL, Python, etc.) to interact easily with this dataset and derive insights.
The main challenge is how to turn a shiny and human-eye-pleasant spreadsheet into a machine-readable tidy version.
What is tidy data? A well-shaped data frame?
The term tidy data was described in a well‐known article named Tidy Data by Hadley Wickham and published in the Journal of Statistical Software in 2014. Below are the key quotes required to understand the underlying concepts better.
Data tidying
“Structuring datasets to facilitate manipulation, visualisation and modelling.”
“Tidy datasets provide a standardised way of linking the structure of a dataset (its physical layout) with its semantics (its meaning).”
Data structure
“Most statistical datasets are rectangular tables composed of rows and columns. The columns are almost always labelled, and the rows are sometimes labelled.”
Data semantics
“A dataset is a collection of values, usually either numbers (if quantitative) or strings (if qualitative). Values are organised in two ways. Every value belongs to both a variable and an observation. A variable contains all values that measure the same underlying attribute (such as height, temperature or duration) across units. An observation contains all values measured on the same unit (for example, a person, a day or a race) across attributes.”
“In a given analysis, there may be multiple levels of observation. For example, in a trial of a new allergy medication, we might have three types of observations:
- Demographic data collected from each person (age, sex, race),
- Medical data collected from each person on each day (number of sneezes, redness of eyes), and
- Meteorological data collected on each day (temperature, pollen count).”
Tidy data
“Tidy data is a standard way of mapping the meaning of a dataset to its structure. A dataset is considered messy or tidy depending on how its rows, columns and tables correspond to observations, variables and types. In tidy data:
- Each variable forms a column.
- Each observation forms a row.
- Each type of observational unit forms a table.”
Common problems with messy datasets
Column headers might be values rather than variable names.
- Messy example: A table where column headers are years (2019, 2020, 2021) instead of a “Year” column.
- Tidy version: A table with a “Year” column and each row representing an observation for a given year.
Multiple variables might be stored in one column.
- Messy example: A column named “Age_Gender” containing values like 28_Female
- Tidy version: Separate columns for “Age” and “Gender”
Variables might be stored in both rows and columns.
- Messy example: A dataset tracking student test scores where subjects (Math, Science, English) are stored as both column headers and repeated in rows instead of using a single “Subject” column.
- Tidy version: A table with columns for “Student ID,” “Subject,” and “Score,” where each row represents one student’s score for one subject.
Multiple types of observational units might be stored in the same table.
- Messy example: A sales dataset that contains both customer information and store inventory in the same table.
- Tidy version: Separate tables for “Customers” and “Inventory.”
A single observational unit might be stored in multiple tables.
- Messy example: A patient’s medical records are split across multiple tables (Diagnosis Table, Medication Table) without a common patient ID linking them.
- Tidy version: A single table or properly linked tables using a unique “Patient ID.”
Now that we have a better understanding of what tidy data is, let’s see how to transform a messy dataset into a tidy one.
Thinking about the how
“Tidy datasets are all alike, but every messy dataset is messy in its own way.” Hadley Wickham (cf. Leo Tolstoy)
Although these guidelines sound clear in theory, they remain difficult to generalise easily in practice for any kind of dataset. In other words, starting with the messy data, no simple or deterministic process or algorithm exists to reshape the data. This is mainly explained by the singularity of each dataset. Indeed, it is surprisingly hard to precisely define variables and observations in general and then transform data automatically without losing content. That is why, despite massive improvements in data processing over the last decade, data cleaning and formatting are still done “manually” most of the time.
Thus, when complex and hardly maintainable rules-based systems are not suitable (i.e. to precisely deal with all contexts by describing decisions in advance), machine learning models may offer some benefits. This grants the system more freedom to adapt to any data by generalising what it has learned during training. Many large language models (LLMs) have been exposed to numerous data processing examples, making them capable of analysing input data and performing tasks such as spreadsheet structure analysis, table schema estimation, and code generation.
Then, let’s describe a workflow made of code and LLM-based modules, alongside business logic, to reshape any spreadsheet.
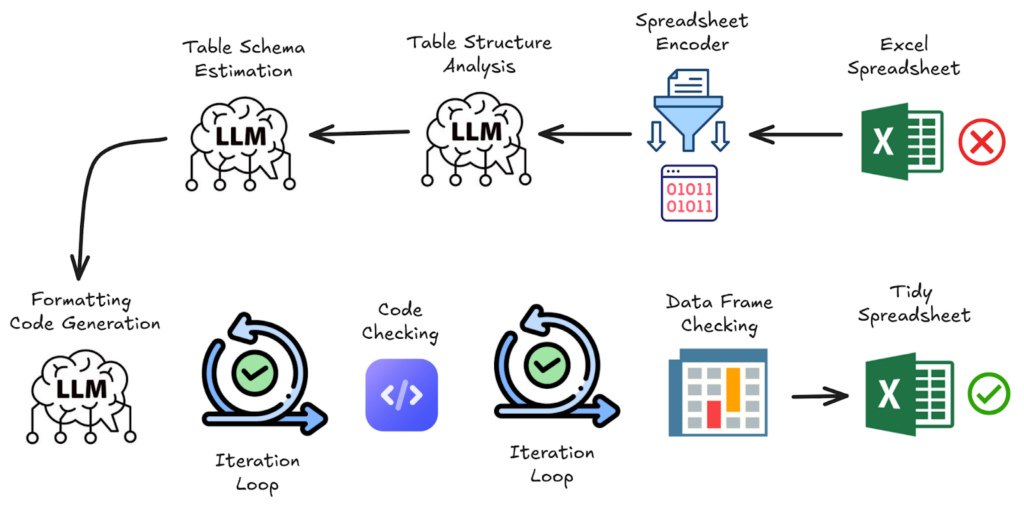
Spreadsheet encoder
This module is designed to serialise into text the main information needed from the spreadsheet data. Only the necessary subset of cells contributing to the table layout is retained, removing non-essential or overly repetitive formatting information. By retaining only the necessary information, this step minimises token usage, reduces costs, and enhances model performance.. The current version is a deterministic algorithm inspired by the paper SpreadsheetLLM: Encoding Spreadsheets for Large Language Models, which relies on heuristics. More details about it will be the topic of a next article.
Table structure analysis
Before moving forward, asking an LLM to extract the spreadsheet structure is a crucial step in building the next actions. Here are examples of questions addressed:
- How many tables are present, and what are their locations (regions) in the spreadsheet?
- What defines the boundaries of each table (e.g., empty rows/columns, specific markers)?
- Which rows/columns serve as headers, and do any tables have multi-level headers?
- Are there metadata sections, aggregated statistics, or notes that need to be filtered out or processed separately?
- Are there any merged cells, and if so, how should they be handled?
Table schema estimation
Once the analysis of the spreadsheet structure has been completed, it is now time to start thinking about the ideal target table schema. This involves letting the LLM process iteratively by:
- Identifying all potential columns (multi-row headers, metadata, etc.)
- Comparing columns for domain similarities based on column names and data semantics
- Grouping related columns
The module outputs a final schema with names and a short description for each retained column.
Code generation to format the spreadsheet
Considering the previous structure analysis and the table schema, this last LLM-based module should draft code that transforms the spreadsheet into a proper data frame compliant with the table schema. Moreover, no useful content must be omitted (e.g. aggregated or computed values may still be derived from other variables).
As generating code that works well from scratch at the first iteration is challenging, two internal iterative processes are added to revise the code if needed:
- Code checking: Whenever code cannot be compiled or executed, the trace error is provided to the model to update its code.
- Data frame validation: The metadata of the created data frame—such as column names, first and last rows, and statistics about each column—is checked to validate whether the table conforms to expectations. Otherwise, the code is revised accordingly.
Convert the data frame into an Excel file
Finally, if all data fits properly into a single table, a worksheet is created from this data frame to respect the tabular format. The final asset returned is an Excel file whose active sheet contains the tidy spreadsheet data.
Et voilà! The sky’s the limit for making the most of your newly tidy dataset.
Feel free to test it with your own dataset using the CleanMyExcel.io service, which is free and requires no registration.
Final note on the workflow
Why is a workflow proposed instead of an agent for that purpose?
At the time of writing, we consider that a workflow based on LLMs for precise sub-tasks is more robust, stable, iterable, and maintainable than a more autonomous agent. An agent may offer advantages: more freedom and liberty in actions to perform tasks. Nonetheless, they may still be hard to deal with in practice; for example, they may diverge quickly if the objective is not clear enough. I believe this is our case, but that does not mean that this model would not be applicable in the future in the same way as SWE-agent coding is performing, for example.
Next articles in the series
In upcoming articles, we plan to explore related topics, including:
- A detailed description of the spreadsheet encoder mentioned earlier.
- Data validity: ensuring each column meets the expectations.
- Data uniqueness: preventing duplicate entities within the dataset.
- Data completeness: handling missing values effectively.
- Evaluating data reshaping, validity, and other key aspects of data quality.
Stay tuned!
Thank you to Marc Hobballah for reviewing this article and providing feedback.
All images, unless otherwise noted, are by the author.