Something is rotten in the city of Nunapitchuk. In recent years, a crack has formed in the middle of a house. Sewage has leached into the earth. Soil has eroded around buildings, leaving them perched atop precarious lumps of dirt. There are eternal puddles. And mold. The ground can feel squishy, sodden.
This small town in northern Alaska is experiencing a sometimes overlooked consequence of climate change: thawing permafrost. And Nunapitchuk is far from the only Arctic town to find itself in such a predicament.
Permafrost, which lies beneath about 15% of the land in the Northern Hemisphere, is defined as ground that has remained frozen for at least two years. Historically, much of the world’s permafrost has remained solid and stable for far longer, allowing people to build whole towns atop it. But as the planet warms, a process that is happening more rapidly near the poles than at more temperate latitudes, permafrost is thawing and causing a host of infrastructural and environmental problems.
Now scientists think they may be able to use satellite data to delve deep beneath the ground’s surface and get a better understanding of how the permafrost thaws, and which areas might be most severely affected because they had more ice to start with. Clues from the short-term behavior of those especially icy areas, seen from space, could portend future problems.
Using information gathered both from space and on the ground, they are working with affected communities to anticipate whether a house’s foundation will crack—and whether it is worth mending that crack or is better to start over in a new house on a stable hilltop. These scientists’ permafrost predictions are already helping communities like Nunapitchuk make those tough calls.
But it’s not just civilian homes that are at risk. One of the top US intelligence agencies, the National Geospatial-Intelligence Agency (NGA), is also interested in understanding permafrost better. That’s because the same problems that plague civilians in the high north also plague military infrastructure, at home and abroad. The NGA is, essentially, an organization full of space spies—people who analyze data from surveillance satellites and make sense of it for the country’s national security apparatus.
Understanding the potential instabilities of the Alaskan military infrastructure—which includes radar stations that watch for intercontinental ballistic missiles, as well as military bases and National Guard posts—is key to keeping those facilities in good working order and planning for their strengthened future. Understanding the potential permafrost weaknesses that could affect the infrastructure of countries like Russia and China, meanwhile, affords what insiders might call “situational awareness” about competitors.
The work to understand this thawing will only become more relevant, for civilians and their governments alike, as the world continues to warm.
The ground beneath
If you live much below the Arctic Circle, you probably don’t think a lot about permafrost. But it affects you no matter where you call home.
In addition to the infrastructural consequences for real towns like Nunapitchuk, thawing permafrost contains sequestered carbon—twice as much as currently inhabits the atmosphere. As the permafrost thaws, the process can release greenhouse gases into the atmosphere. That release can cause a feedback loop: Warmer temperatures thaw permafrost, which releases greenhouse gases, which warms the air more, which then—you get it.
The microbes themselves, along with previously trapped heavy metals, are also set dangerously free.
For many years, researchers’ primary options for understanding some of these freeze-thaw changes involved hands-on, on-the-ground surveys. But in the late 2000s, Kevin Schaefer, currently a senior scientist at the Cooperative Institute for Research in Environmental Sciences at the University of Colorado Boulder, started to investigate a less labor-intensive idea: using radar systems aboard satellites to survey the ground beneath.
This idea implanted itself in his brain in 2009, when he traveled to a place called Toolik Lake, southwest of the oilfields of Prudhoe Bay in Alaska. One day, after hours of drilling sample cores out of the ground to study permafrost, he was relaxing in the Quonset hut, chatting with colleagues. They began to discuss how space-based radar could potentially detect how the land sinks and heaves back up as temperatures change.
Huh, he thought. Yes, radar probably could do that.
Scientists call the ground right above permafrost the active layer. The water in this layer of soil contracts and expands with the seasons: during the summer, the ice suffusing the soil melts and the resulting decrease in volume causes the ground to dip. During the winter, the water freezes and expands, bulking the active layer back up. Radar can help measure that height difference, which is usually around one to five centimeters.
Schaefer realized that he could use radar to measure the ground elevation at the start and end of the thaw. The electromagnetic waves that bounce back at those two times would have traveled slightly different distances. That difference would reveal the tiny shift in elevation over the seasons and would allow him to estimate how much water had thawed and refrozen in the active layer and how far below the surface the thaw had extended.
With radar, Schaefer realized, scientists could cover a lot more literal ground, with less effort and at lower cost.
“It took us two years to figure out how to write a paper on it,” he says; no one had ever made those measurements before. He and colleagues presented the idea at the 2010 meeting of the American Geophysical Union and published a paper in 2012 detailing the method, using it to estimate the thickness of the active layer on Alaska’s North Slope.
When they did, they helped start a new subfield that grew as large-scale data sets started to become available around 5 to 10 years ago, says Roger Michaelides, a geophysicist at Washington University in St. Louis and a collaborator of Schaefer’s. Researchers’ efforts were aided by the growth in space radar systems and smaller, cheaper satellites.
With the availability of global data sets (sometimes for free, from government-run satellites like the European Space Agency’s Sentinel) and targeted observations from commercial companies like Iceye, permafrost studies are moving from bespoke regional analyses to more automated, large-scale monitoring and prediction.
The remote view
Simon Zwieback, a geospatial and environmental expert at the University of Alaska Fairbanks, sees the consequences of thawing permafrost firsthand every day. His office overlooks a university parking lot, a corner of which is fenced off to keep cars and pedestrians from falling into a brand-new sinkhole. That area of asphalt had been slowly sagging for more than a year, but over a week or two this spring, it finally started to collapse inward.
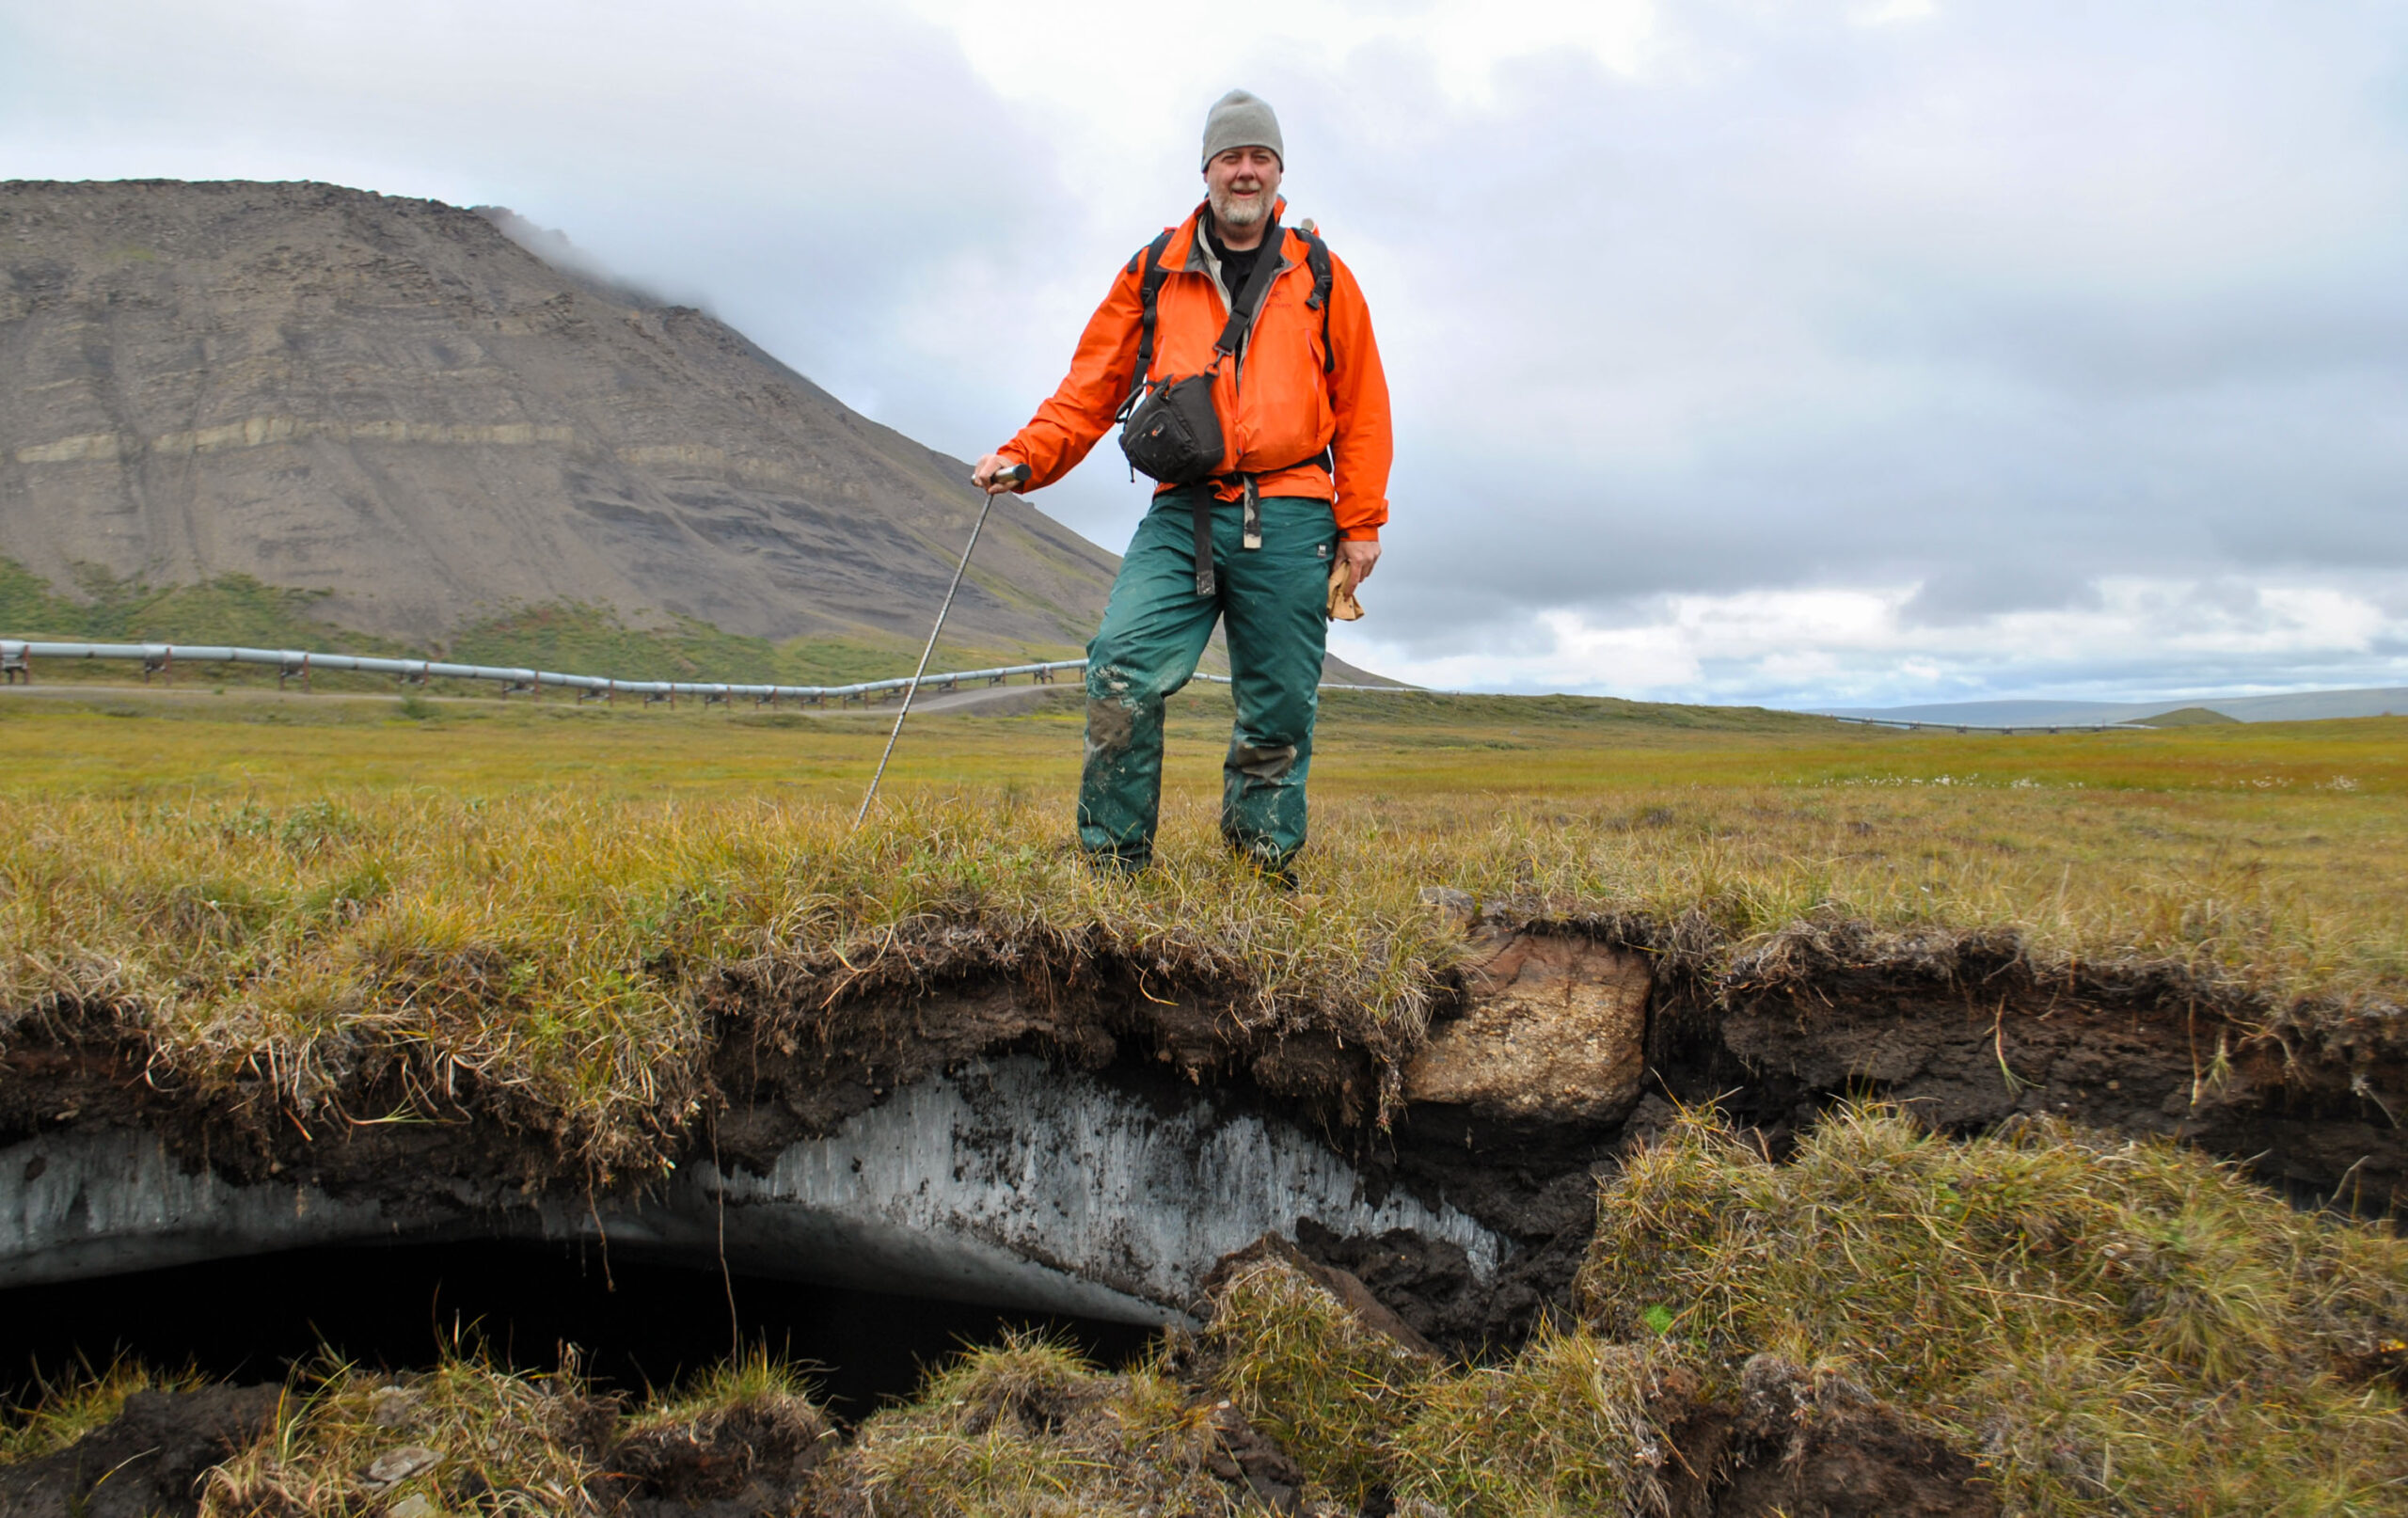
The new remote research methods are a large-scale version of Zwieback taking in the view from his window. Researchers look at the ground and measure how its height changes as ice thaws and refreezes. The approach can cover wide swaths of land, but it involves making assumptions about what’s going on below the surface—namely, how much ice suffuses the soil in the active layer and permafrost. Thawing areas with relatively low ice content could mimic thinner layers with more ice. And it’s important to differentiate the two, since more ice in the permafrost means more potential instability.
To check that they’re on the right track, scientists have historically had to go out into the field. But a few years ago, Zwieback started to explore a way to make better and deeper estimates of ice content using the available remote sensing data. Finding a way to make those kinds of measurements on a large scale was more than an academic exercise: Areas of what he calls “excess ice” are most liable to cause instability at the surface. “In order to plan in these environments, we really need to know how much ice there is, or where those locations are that are rich in ice,” he says.
Zwieback, who did his undergraduate and graduate studies in Switzerland and Austria, wasn’t always so interested in permafrost, or so deeply affected by it. But in 2014, when he was a doctoral student in environmental engineering, he joined an environmental field campaign in Siberia, at the Lena River Delta, which resembles a gigantic piece of coral fanning out into the Arctic Ocean. Zwieback was near a town called Tiksi, one of the world’s northernmost settlements. It’s a military outpost and starting point for expeditions to the North Pole, featuring an abandoned plane near the ocean. Its Soviet-era concrete buildings sometimes bring it to the front page of the r/UrbanHell subreddit.
Here, Zwieback saw part of the coastline collapse, exposing almost pure ice. It looked like a subterranean glacier, but it was permafrost. “That really had an indelible impact on me,” he says.
Later, as a doctoral student in Zurich and postdoc in Canada, he used his radar skills to understand the rapid changes that the activity of permafrost impressed upon the landscape.
And now, with his job in Fairbanks and his ideas about the use of radar sensing, he has done work funded by the NGA, which has an open Arctic data portal.
In his Arctic research, Zwieback started with the approach underlying most radar permafrost studies: looking at the ground’s seasonal subsidence and heave. “But that’s something that happens very close to the surface,” he says. “It doesn’t really tell us about these long-term destabilizing effects,” he adds.
In warmer summers, he thought, subtle clues would emerge that could indicate how much ice is buried deeper down.
For example, he expected those warmer-than-average periods to exaggerate the amount of change seen on the surface, making it easier to tell which areas are ice-rich. Land that was particularly dense with ice would dip more than it “should”—a precursor of bigger dips to come.
The first step, then, was to measure subsidence directly, as usual. But from there, Zwieback developed an algorithm to ingest data about the subsidence over time—as measured by radar—and other environmental information, like the temperatures at each measurement. He then created a digital model of the land that allowed him to adjust the simulated amount of ground ice and determine when it matched the subsidence seen in the real world. With that, researchers could infer the amount of ice beneath.
Next, he made maps of that ice that could potentially be useful to engineers—whether they were planning a new subdivision or, as his funders might be, keeping watch on a military airfield.
“What was new in my work was to look at these much shorter periods and use them to understand specific aspects of this whole system, and specifically how much ice there is deep down,” Zwieback says.
The NGA, which has also funded Schaefer’s work, did not respond to an initial request for comment but did later provide feedback for fact-checking. It removed an article on its website about Zwieback’s grant and its application to agency interests around the time that the current presidential administration began to ban mention of climate change in federal research. But the thawing earth is of keen concern.
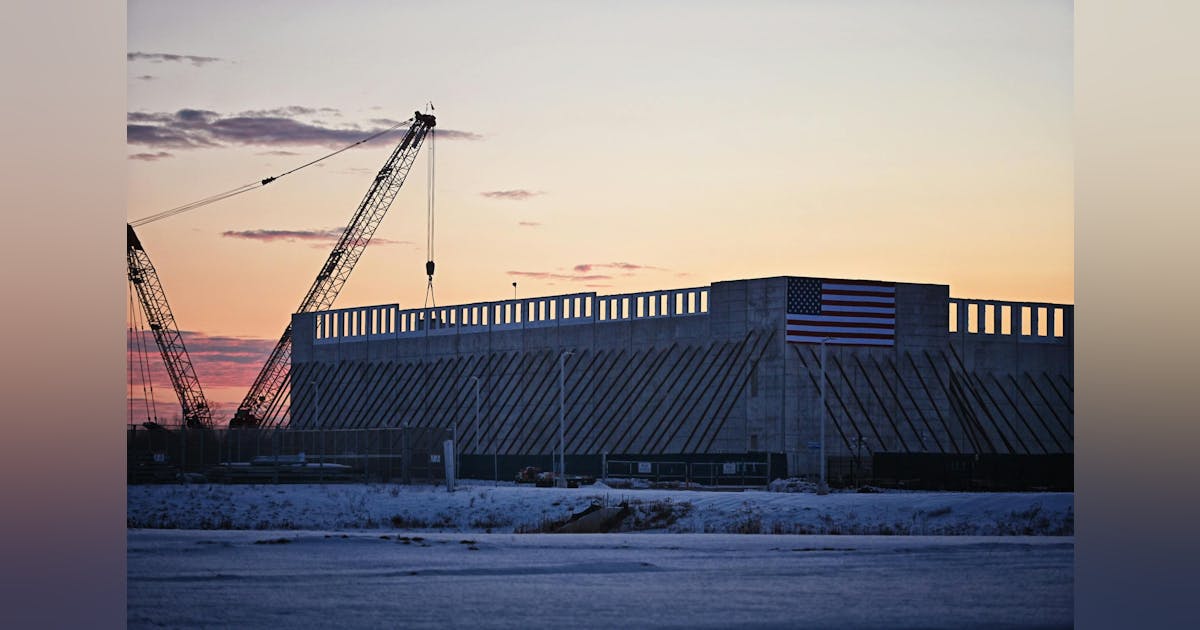
To start, the US has significant military infrastructure in Alaska: It’s home to six military bases and 49 National Guard posts, as well as 21 missile-detecting radar sites. Most are vulnerable to thaw now or in the near future, given that 85% of the state is on permafrost.
Beyond American borders, the broader north is in a state of tension. Russia’s relations with Northern Europe are icy. Its invasion of Ukraine has left those countries fearing that they too could be invaded, prompting Sweden and Finland, for instance, to join NATO. The US has threatened takeovers of Greenland and Canada. And China—which has shipping and resource ambitions for the region—is jockeying to surpass the US as the premier superpower.
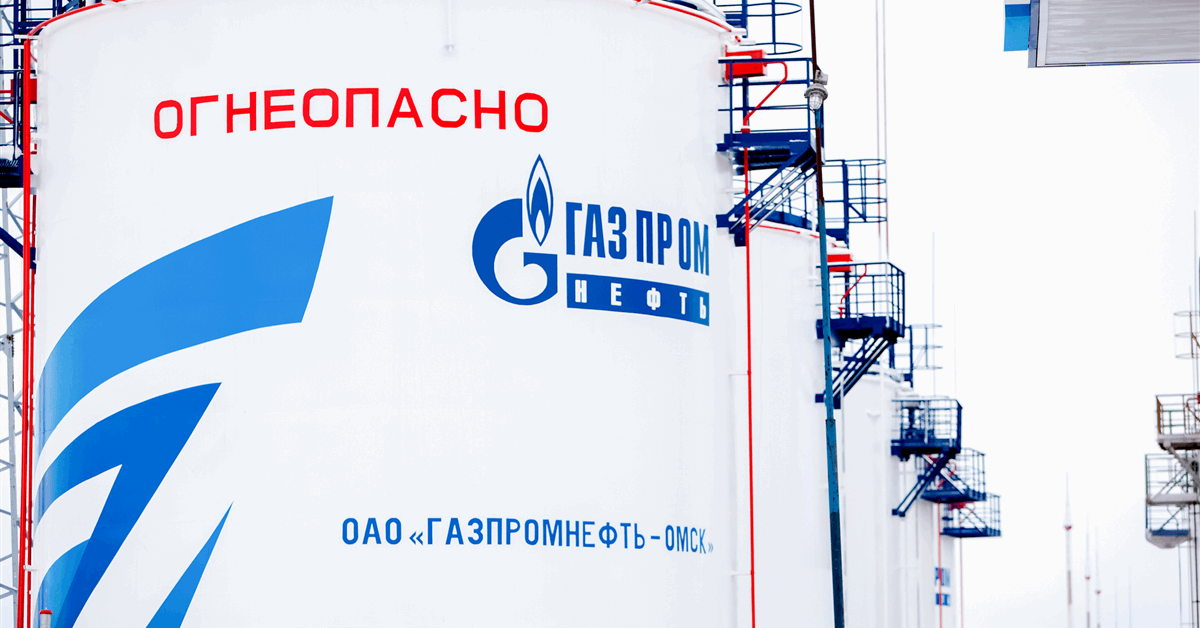
Permafrost plays a role in the situation. “As knowledge has expanded, so has the understanding that thawing permafrost can affect things NGA cares about, including the stability of infrastructure in Russia and China,” read the NGA article. Permafrost covers 60% of Russia, and thaws have affected more than 40% of buildings in northern Russia already, according to statements from the country’s minister of natural resources in 2021. Experts say critical infrastructure like roads and pipelines is at risk, along with military installations. That could weaken both Russia’s strategic position and the security of its residents. In China, meanwhile, according to a report from the Council on Strategic Risks, important moving parts like the Qinghai-Tibet Railway, “which allows Beijing to more quickly move military personnel near contested areas of the Indian border,” is susceptible to ground thaw—as are oil and gas pipelines linking Russia and China.
In the field
Any permafrost analysis that relies on data from space requires verification on Earth. The hope is that remote methods will become reliable enough to use on their own, but while they’re being developed, researchers must still get their hands muddy with more straightforward and longer tested physical methods. Some use a network called Circumpolar Active Layer Monitoring, which has existed since 1991, incorporating active-layer data from hundreds of measurement sites across the Northern Hemisphere.
Sometimes, that data comes from people physically probing an area; other sites use tubes permanently inserted into the ground, filled with a liquid that indicates freezing; still others use underground cables that measure soil temperature. Some researchers, like Schaefer, lug ground-penetrating radar systems around the tundra. He’s taken his system to around 50 sites and made more than 200,000 measurements of the active layer.
The field-ready ground-penetrating radar comes in a big box—the size of a steamer trunk—that emits radio pulses. These pulses bounce off the bottom of the active layer, or the top of the permafrost. In this case, the timing of that reflection reveals how thick the active layer is. With handles designed for humans, Schaefer’s team drags this box around the Arctic’s boggier areas.
The box floats. “I do not,” he says. He has vivid memories of tromping through wetlands, his legs pushing straight down through the muck, his body sinking up to his hips.
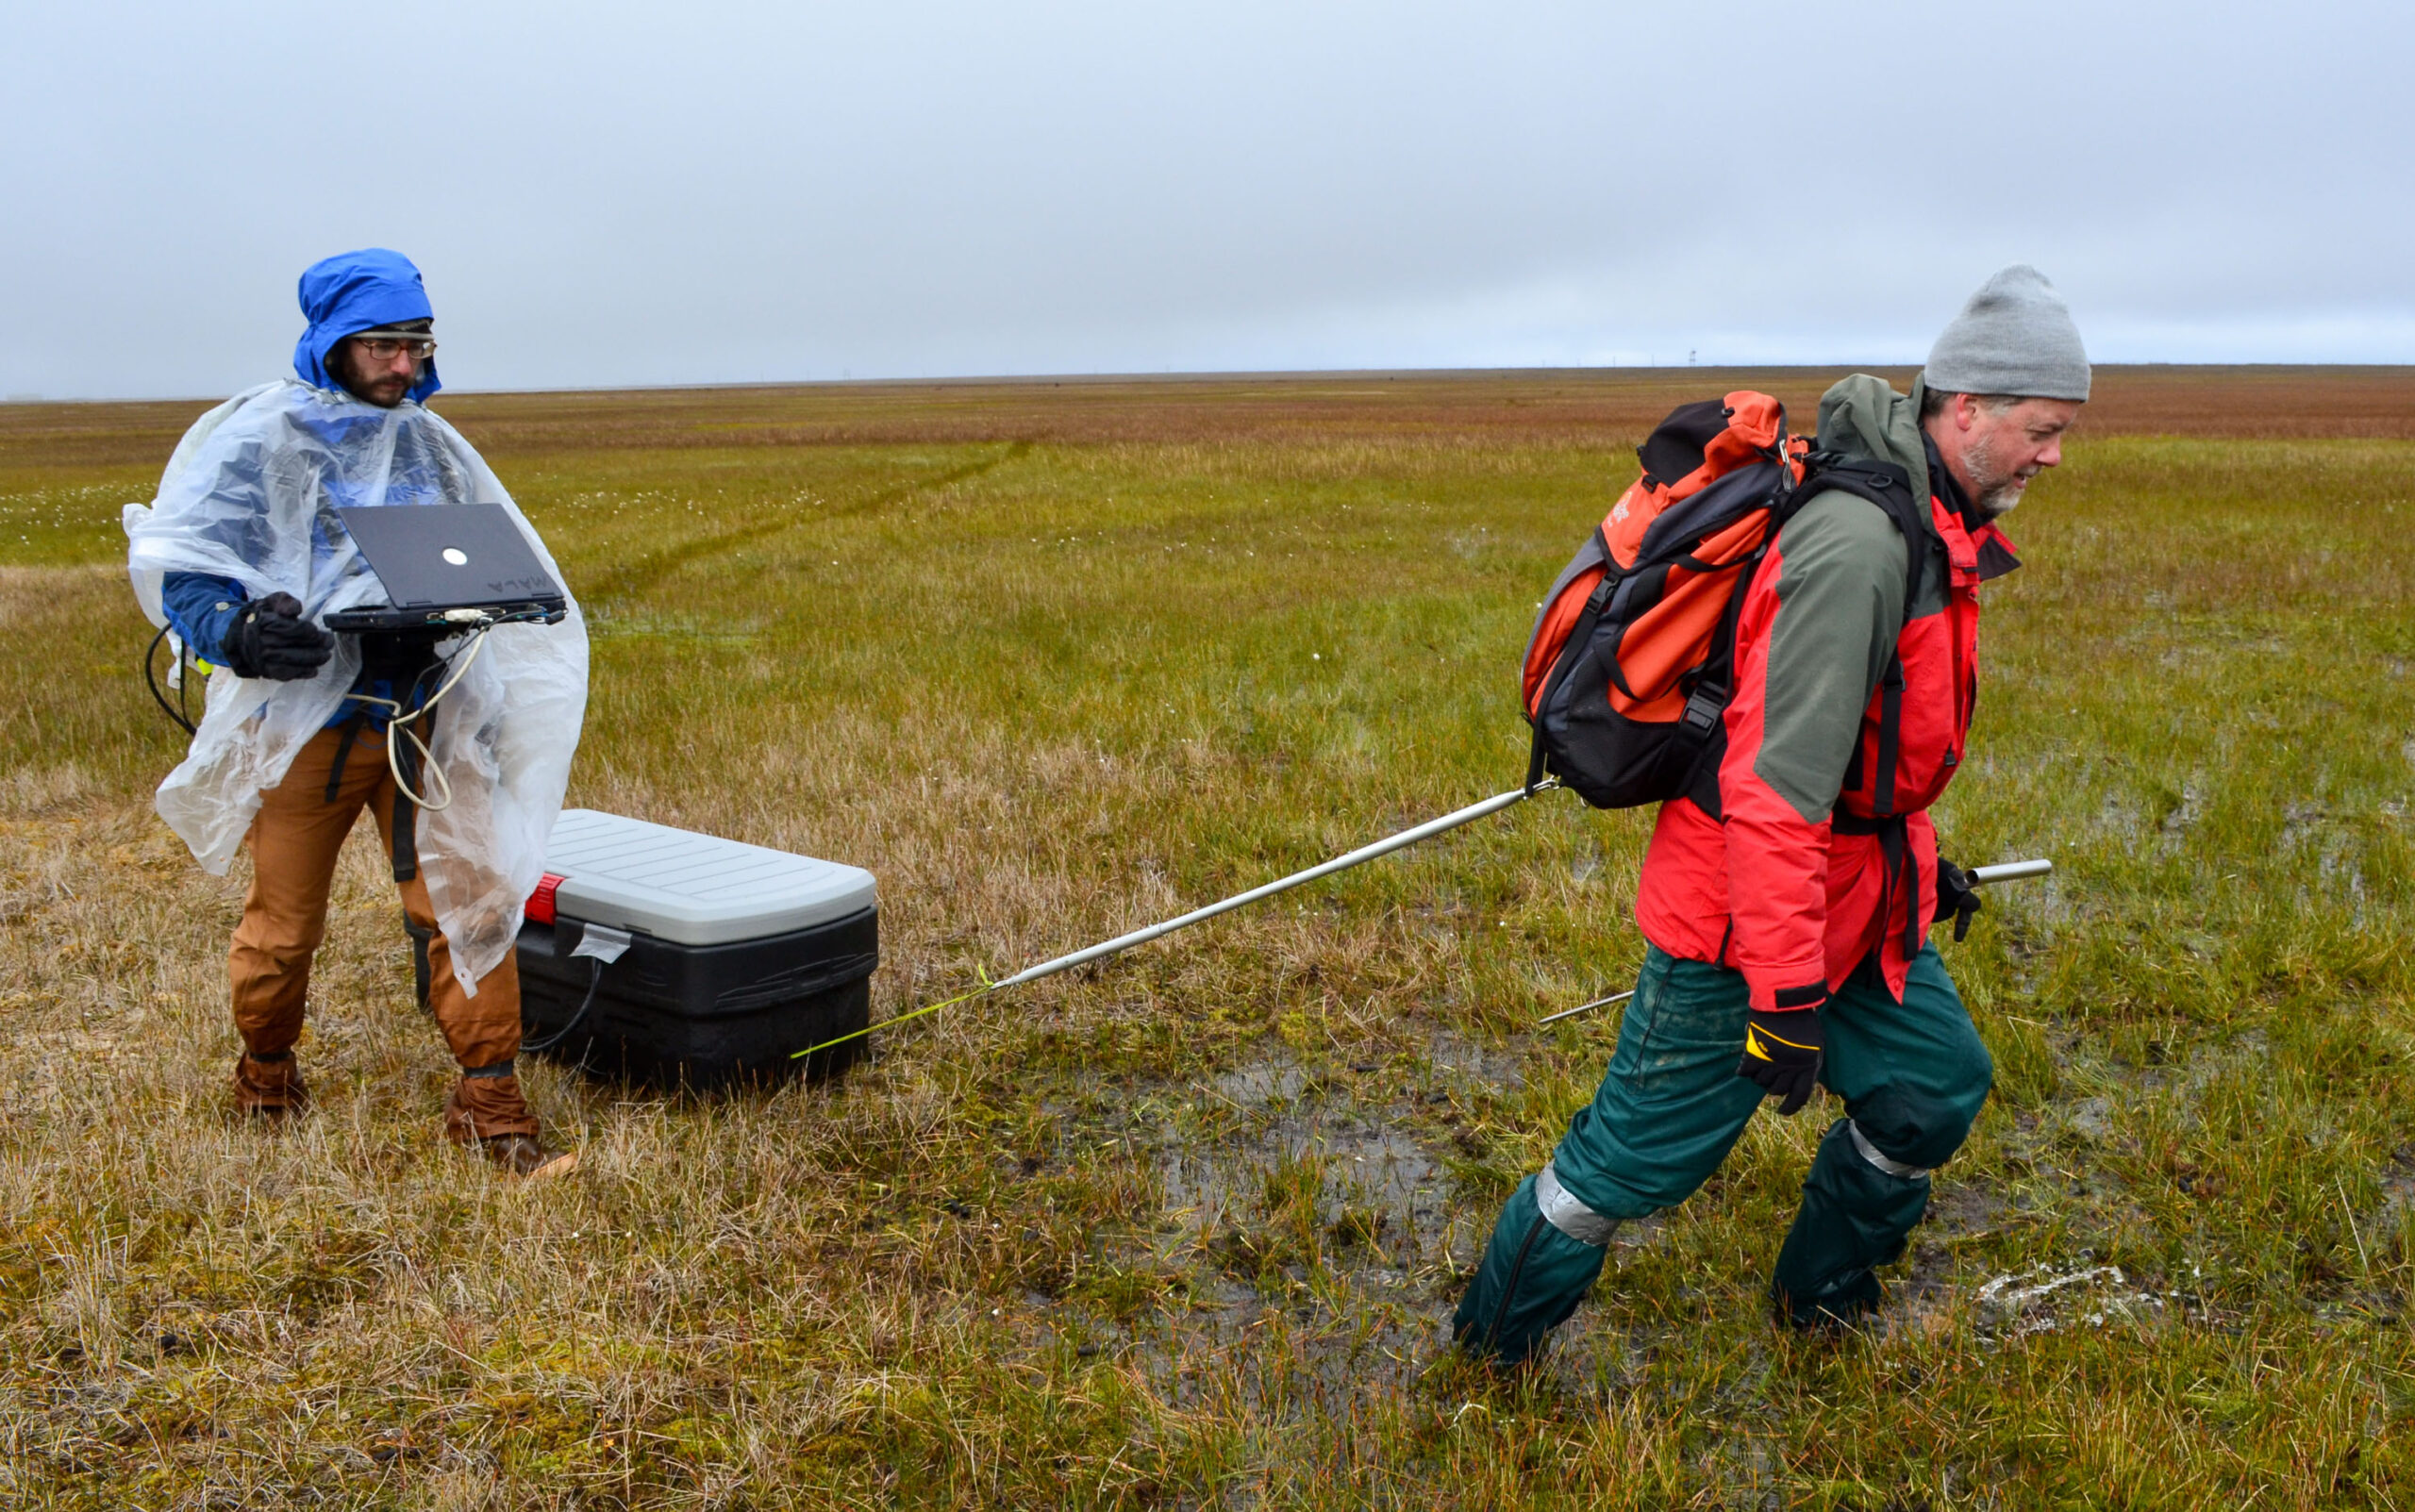
Zwieback also needs to verify what he infers from his space data. And so in 2022, he went to the Toolik Field station, a National Science Foundation–funded ecology research facility along the Dalton Highway and adjacent to Schaefer’s Toolik Lake. This road, which goes from Fairbanks up to the Arctic Ocean, is colloquially called the Haul Road; it was made famous in the TV show Ice Road Truckers. From this access point, Zwieback’s team needed to get deep samples of soil whose ice content could be analyzed in the lab.
Every day, two teams would drive along the Dalton Highway to get close to their field sites. Slamming their car doors, they would unload and hop on snow machines to travel the final distance. Often they would see musk oxen, looking like bison that never cut their hair. The grizzlies were also interested in these oxen, and in the nearby caribou.
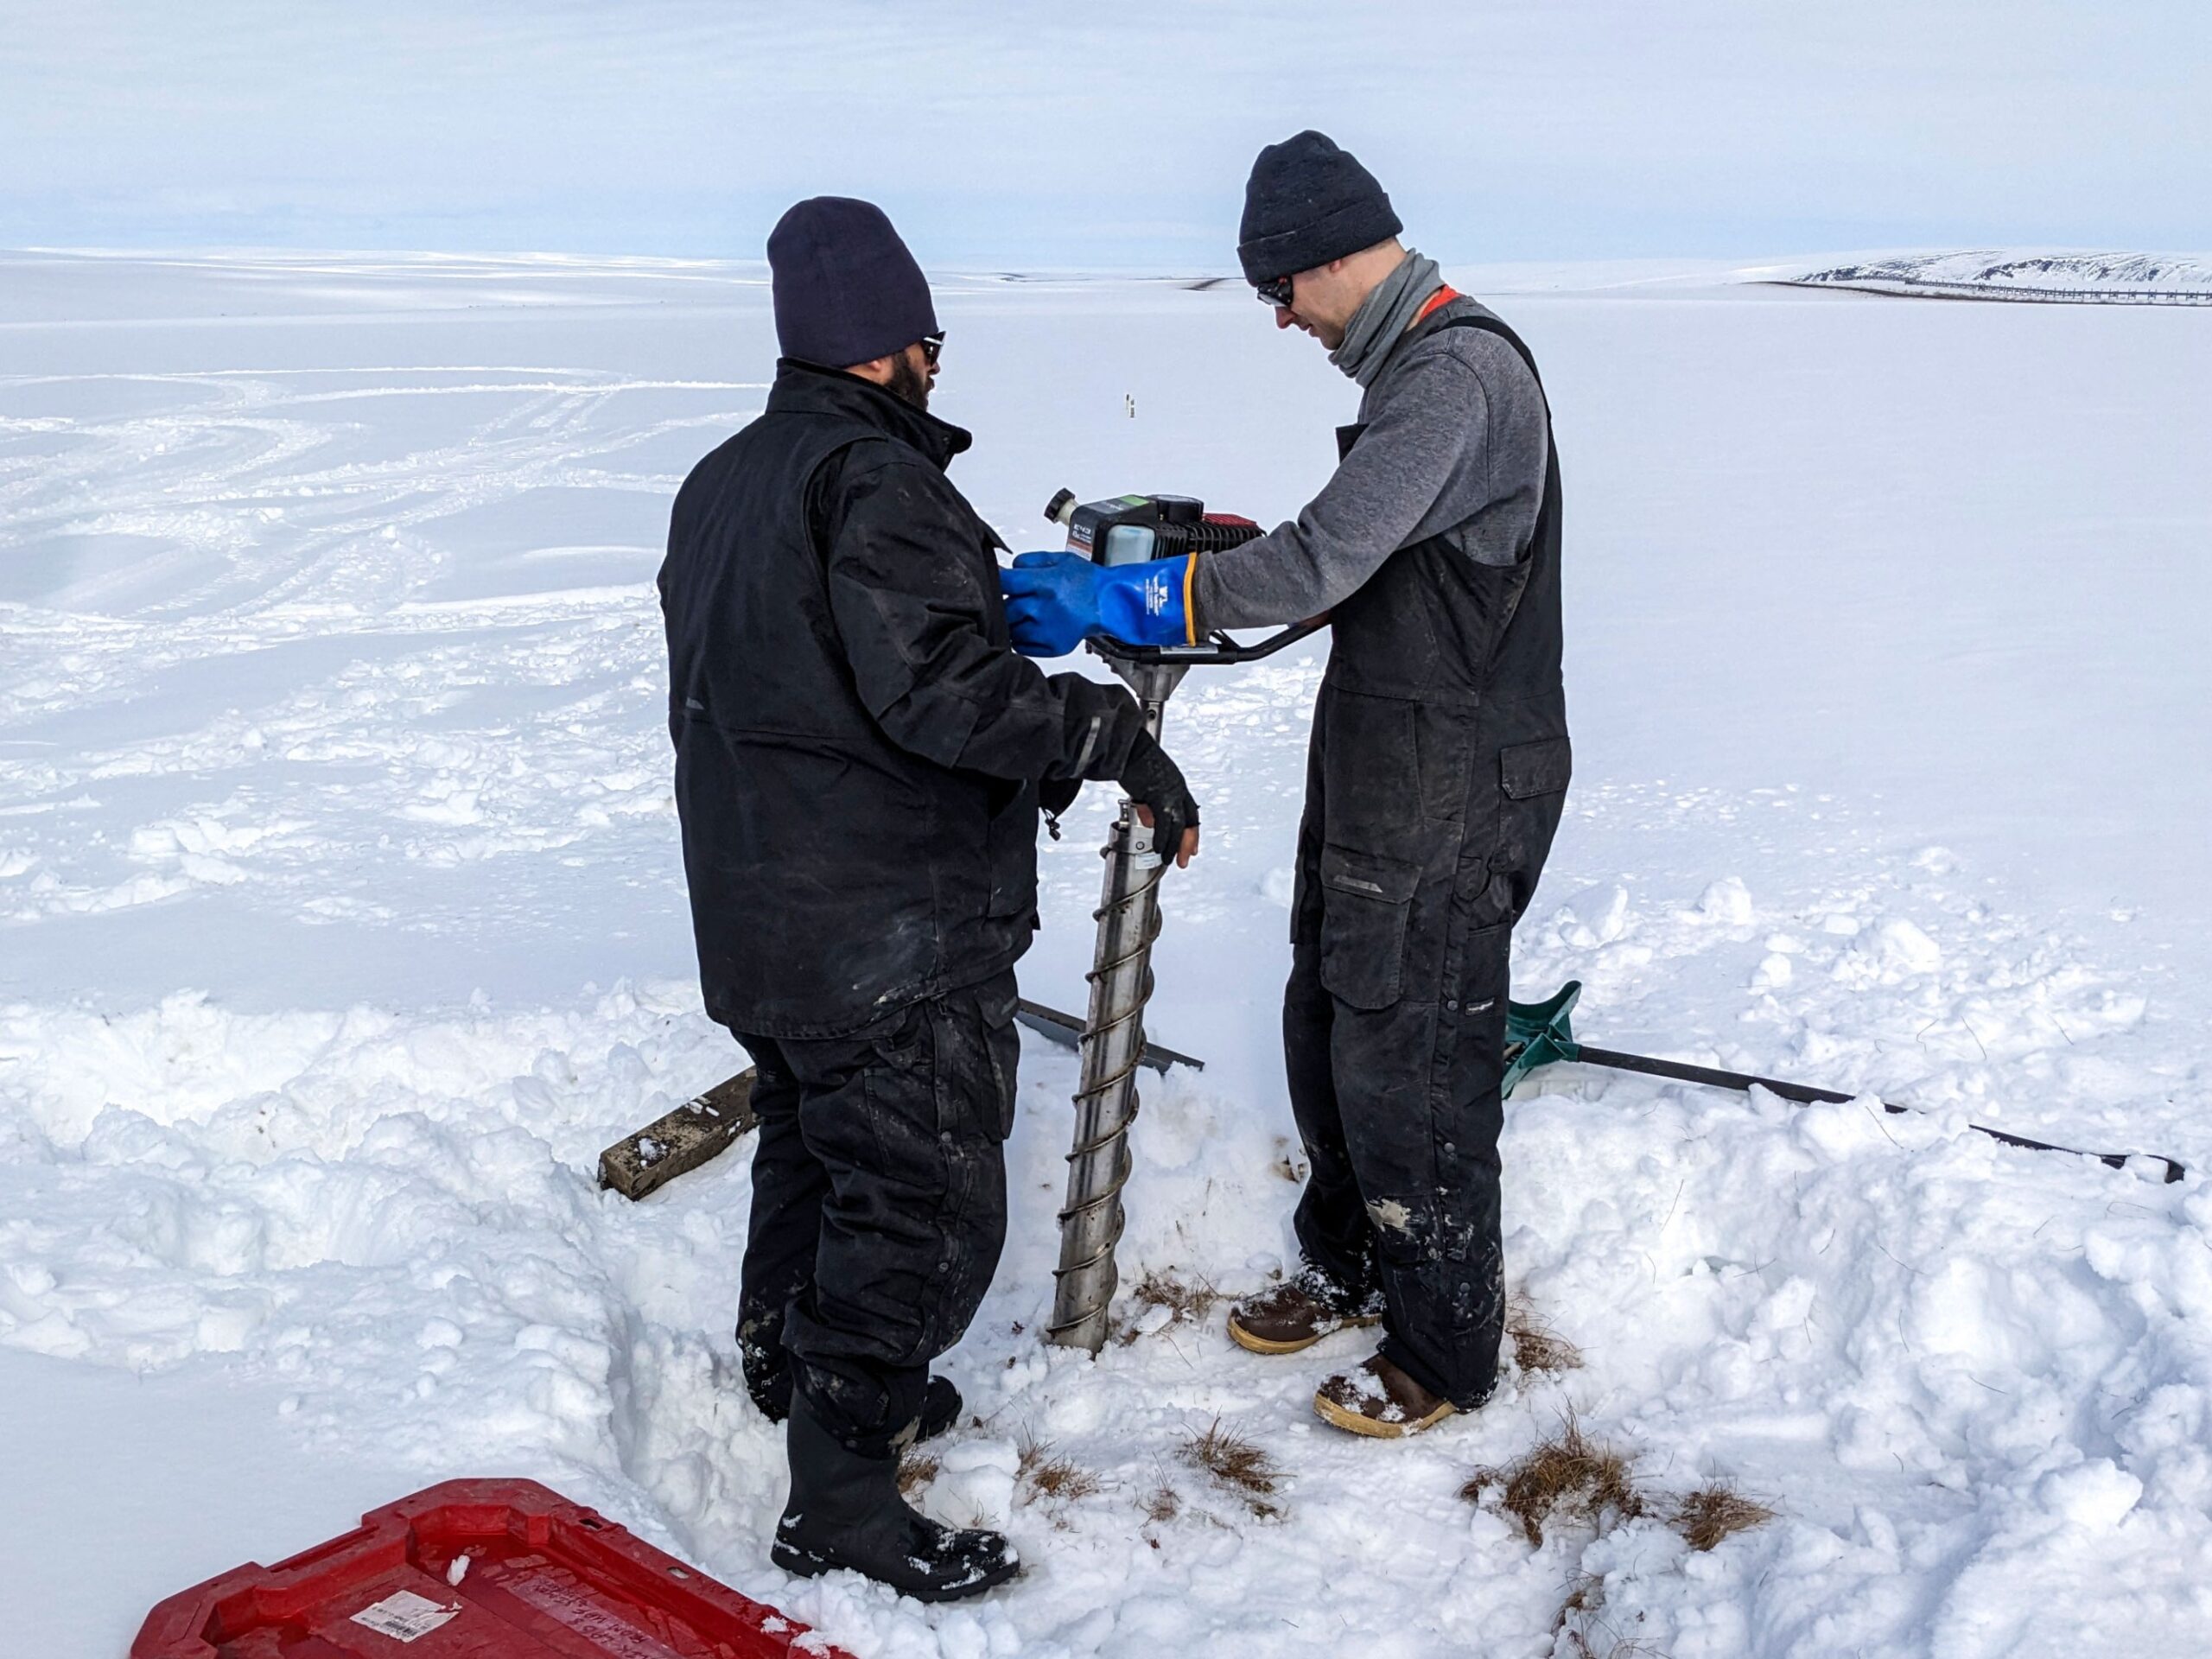
At the sites they could reach, they took out a corer, a long, tubular piece of equipment driven by a gas engine, meant to drill deep into the ground. Zwieback or a teammate pressed it into the earth. The barrel’s two blades rotated, slicing a cylinder about five feet down to ensure that their samples went deep enough to generate data that can be compared with the measurements made from space. Then they pulled up and extracted the cylinder, a sausage of earth and ice.
All day every day for a week, they gathered cores that matched up with the pixels in radar images taken from space. In those cores, the ice was apparent to the eye. But Zwieback didn’t want anecdata. “We want to get a number,” he says.
So he and his team would pack their soil cylinders back to the lab. There they sliced them into segments and measured their volume, in both their frozen and their thawed form, to see how well the measured ice content matched estimates from the space-based algorithm.
The initial validation, which took months, demonstrated the value of using satellites for permafrost work. The ice profiles that Zwieback’s algorithm inferred from the satellite data matched measurements in the lab down to about 1.1 feet, and farther in a warm year, with some uncertainty near the surface and deeper into the permafrost.
Whereas it cost tens of thousands of dollars to fly in on a helicopter, drive in a car, and switch to a snowmobile to ultimately sample a small area using your hands, only to have to continue the work at home, the team needed just a few hundred dollars to run the algorithm on satellite data that was free and publicly available.
Michaelides, who is familiar with Zwieback’s work, agrees that estimating excess ice content is key to making infrastructural decisions, and that historical methods of sussing it out have been costly in all senses. Zwieback’s method of using late-summer clues to infer what’s going on at that depth “is a very exciting idea,” he says, and the results “demonstrate that there is considerable promise for this approach.”
He notes, though, that using space-based radar to understand the thawing ground is complicated: Ground ice content, soil moisture, and vegetation can differ even within a single pixel that a satellite can pick out. “To be clear, this limitation is not unique to Simon’s work,” Michaelides says; it affects all space-radar methods. There is also excess ice below even where Zwieback’s algorithm can probe—something the labor-intensive on-ground methods can pick up that still can’t be seen from space.
Mapping out the future
After Zwieback did his fieldwork, NGA decided to do its own. The agency’s attempt to independently validate his work—in Prudhoe Bay, Utqiagvik, and Fairbanks—was part of a project it called Frostbyte.
Its partners in that project—the Army’s Cold Regions Research Engineering Laboratory and Los Alamos National Laboratory—declined requests for interviews. As far as Zwieback knows, they’re still analyzing data.
But the intelligence community isn’t the only group interested in research like Zwieback’s. He also works with Arctic residents, reaching out to rural Alaskan communities where people are trying to make decisions about whether to relocate or where to build safely. “They typically can’t afford to do expensive coring,” he says. “So the idea is to make these data available to them.”
Schaefer is also trying to bridge the gap between his science and the people it affects. Through a company called Weather Stream, he is helping communities identify risks to infrastructure before anything collapses, so they can take preventative action.
Making such connections has always been a key concern for Erin Trochim, a geospatial scientist at the University of Alaska Fairbanks. As a researcher who works not just on permafrost but also on policy, she’s seen radar science progress massively in recent years—without commensurate advances on the ground.
For instance, it’s still hard for residents in her town of Fairbanks—or anywhere—to know if there’s permafrost on their property at all, unless they’re willing to do expensive drilling. She’s encountered this problem, still unsolved, on property she owns. And if an expert can’t figure it out, non-experts hardly stand a chance. “It’s just frustrating when a lot of this information that we know from the science side, and [that’s] trickled through the engineering side, hasn’t really translated into the on-the-ground construction,” she says.
There is a group, though, trying to turn that trickle into a flood: Permafrost Pathways, a venture that launched with a $41 million grant through the TED Audacious Project. In concert with affected communities, including Nunapitchuk, it is building a data-gathering network on the ground, and combining information from that network with satellite data and local knowledge to help understand permafrost thaw and develop adaptation strategies.
“I think about it often as if you got a diagnosis of a disease,” says Sue Natali, the head of the project. “It’s terrible, but it’s also really great, because when you know what your problem is and what you’re dealing with, it’s only then that you can actually make a plan to address it.”
And the communities Permafrost Pathways works with are making plans. Nunapitchuk has decided to relocate, and the town and the research group have collaboratively surveyed the proposed new location: a higher spot on hardpacked sand. Permafrost Pathways scientists were able to help validate the stability of the new site—and prove to policymakers that this stability would extend into the future.
Radar helps with that in part, Natali says, because unlike other satellite detectors, it penetrates clouds. “In Alaska, it’s extremely cloudy,” she says. “So other data sets have been very, very challenging. Sometimes we get one image per year.”
And so radar data, and algorithms like Zwieback’s that help scientists and communities make sense of that data, dig up deeper insight into what’s going on beneath northerners’ feet—and how to step forward on firmer ground.
Sarah Scoles is a freelance science journalist based in southern Colorado and the author, most recently, of the book Countdown: The Blinding Future of Nuclear Weapons.