Stay Ahead, Stay ONMINE

How OpenAI’s Performance Factory keeps ChatGPT fast

The staggering pace of agentic development has made traditional approaches to performance engineering unsustainable. To keep up, we built the Performance Factory, an autonomous system that uses the full capabilities of Codex and our models to find and fix regressions at an unprecedented speed. The Performance Factory, which runs in the cloud and automates investigating and resolving performance problems, enables us to keep pace with the ambition of our roadmap.In the Performance Factory, our engineers define workflows for recurring jobs and write instructions for the Codex agents that carry them out. In particular, the Regression Workflow opens a task when a performance alert fires. An agent investigates the slowdown, records its findings in the task, and proposes a fix for an engineer to review. After deployment, another agent picks up the same task to check whether performance has returned to baseline. From investigating to authoring the fix to verifying mitigation, this first workflow in the Performance Factory has automated the entire process of fixing regressions. In just over three months, the Regression Workflow tracked more than 1,700 investigations and root caused over 600 cases. That’s 17 automated investigations every day.Here, we’ll share how our use of Codex evolved into what’s now the Performance Factory, walk through our first running workflow, and share early lessons from building and running agent workflows in production.The path from manual investigations to automated workflowsAs we used Codex for more of our performance work, we noticed a progression in how our team worked. We hope other service teams can learn from our process as they adopt agentic workflows in other domains.Software work evolves from manual labor to partnering with machines to agent factories.1. Pre-Codex. Before Codex, engineers manually examined metrics and logs, compared traces, debugged live machines, and read code to investigate a slowdown. This work was time consuming, and knowing where to look often required deep knowledge of the service. Relevant signals were easy to miss. When we encountered the same kinds of problems repeatedly—like regressions in ChatGPT’s first token latency—we built advanced tools, like CPU and allocation profilers, to make those investigations easier. Over time, we accumulated more than 30 performance tools.2. Codex as a partner. Once we had Codex as a partner, engineers could ask, “Why did this get slower?” and work with Codex to investigate, even in an unfamiliar system. Codex could search large codebases, find relevant metrics and traces, follow interactions across services, and do appropriate profiling to piece together what had happened. But engineers still had to steer the process, knowing which performance tools to use and how to guide the investigation. Difficult investigations were more debuggable for more people, with less expertise and time required.3. Reusable skills. To automate further, we captured our performance team’s investigation process in a shared skill called perf-forensics. It tells Codex which tools are available, when to use them, and how to work through a slowdown so Codex can try to resolve the problem from a few angles:Find when the slowdown beganIdentify the affected requestsInvestigate whether deployments or configuration changes could explain itWe tested and refined the perf-forensics skill using evals based on past regressions. For the types of regressions we focused on (for example, ChatGPT latency and availability drops), we could now give Codex an alert and get back a diagnosis in a single run, without guiding it through each step.4. The human proxy. As we added and refined perf-related Codex skills like perf-forensics, we started to feel like a proxy between our alerts and Codex. An alert would fire, and an engineer would simply copy and paste it into Codex with the right skill, then paste the findings back into Slack.5. Automated investigations. Next, we moved investigations to the cloud so an alert could start a Codex session automatically. Codex investigated the slowdown and posted its findings in the Slack thread, but the automation ended with that reply. An engineer still had to pick up the diagnosis, develop a fix, and check whether it worked after deployment. As alerts accumulated, even figuring out which regressions needed attention meant sifting through Slack threads.6. The factory. We built the Performance Factory to run end-to-end agentic performance engineering workflows. It tracks what each active task needs next and assigns an agent when that step is ready. Each task keeps its state and findings, so work can pass between agents and engineers and resume after a code review or deployment. For a regression, the work starts with investigating an alert and ends with verifying recovery in production. We can turn common optimizations into workflows that run regularly across our services. A workflow that spots a potential optimization can open a task in another workflow to test and implement it.The Performance Factory system’s four partsThe Performance Factory is made up of four components: a task tracker with configurable workflows, a dispatch loop that assigns ready work to agents, an API that runs Codex in the cloud, and subscriptions that wake agents when something changes (such as a GitHub review comment posting or a deployment completing).Performance Factory consists of a task service, dispatch loop, cloud execution, and subscriptions.Task service with configurable workflowsThe task service is where engineers define workflows by adding configuration files and prompts for the agents to follow, written in Markdown. The configuration lists the states a task can move through, the allowed transitions, and which steps need an engineer. Separate prompts tell agents what to do at each step.Plain textA code change task contains a configuration file, along with Markdown prompts for implementing and reviewing.Each piece of work becomes a task in a workflow, and all workflows are visible in a UI. Engineers can see what’s open, follow progress, and share a task with a teammate who might have more context or be able to help with the next step.Dispatch loop that assigns workA dispatch loop periodically checks which tasks are ready for the next step. It assigns an agent to each task by starting a Codex turn with the instructions for the task’s current state. The agent records its progress on the task and moves it to the next state if it completes the step.Codex in the cloudOnce a task is assigned, the agent needs a place to do the work, with access to the same tools an engineer would use. We built an internal API to programmatically invoke a Codex turn in the cloud. The Codex turn runs on an environment inside our network, with access to our code repositories and the observability tools our engineers use, such as metrics, logs, traces, CPU profiles, and memory snapshots.The agent runs under a service identity, so we can scope its permissions and see which actions came from our performance agents. Moving agentic work to the cloud lets us run work in parallel without relying on engineers’ laptops being open or manually managing individual cloud development boxes.Subscriptions that wake the agent when something changesSome work has to wait for a person or a deployment; an agent shouldn’t have to keep running in the meantime. When a task needs to wait, it can subscribe to events like review comments or failed CI checks on a GitHub pull request to get notified when it’s time to pick the work back up. When an incoming event matches the subscription, the task becomes ready again and the dispatch loop can then assign an agent to continue the work.The first workflow: from alert to recoveryFinding, root causing, and solving regressions is the first workflow we built inside the Performance Factory. We call it the Regression Workflow. A performance regression moves through several stages: needs investigation, root caused, fix proposed, and resolved, so we built the automated workflow to reflect and move a task through those same stages.When one of its configured performance alerts fires, the Regression Workflow opens a task that agents pick up and move across these stages. The task records its status and key findings outside of any one agent’s context so that other agents or engineers can pick up the work. Engineers can follow the work in Slack or the Regression Workflow UI, add context, and review proposed changes. After a fix is deployed, an agent checks whether the performance has recovered to its original state before resolving the task.Performance Factory regression workflowA regression is detected.An agent finds the cause and proposes a fix.An engineer takes over and decides what ships.After deployment, the agent wakes up to check recovery.Still regressed? Back to investigation.A regression is detected.A regression is detected.PauseDetectedSystemFind root causeAgentPropose fixAgentReview & deployEngineerVerify recoveryAgentResolved Active stage: DetectedThe Regression Workflow’s steps include finding the root cause, proposing a fix, reviewing and deploying, and verifying recovery.Agents find the root causeFinding the root cause (or causes) is the first major step in the workflow. The agent starts by figuring out which metrics got worse, when they started to change, and which service requests were affected. The perf-forensics skill gives Codex access to the tools our performance engineers use and a playbook for working through those questions.An alert fires when a metric crosses a threshold, but the regression may have started hours earlier. The agent looks back through the data to find when the metric first got worse. It then compares groups of requests: did similar requests actually get slower, or were we serving more requests that were already slow? Those findings point to different causes.Once it knows when and where to look, the agent examines deployments and feature flag changes, then reads the relevant code. It checks when a change actually reached the affected requests and uses logs or traces to test whether the code could explain what happened.Adversarial review strengthens the diagnosisEarly on, agents sometimes stopped at the first plausible explanation they found, and some of those diagnoses turned out to be wrong. To catch these mistakes, we added an adversarial review: a separate Codex session that tries to disprove the proposed diagnosis. The reviewer rechecks the assumptions and tests counterfactuals. If a rollout caused the slowdown, did similar requests that weren’t exposed stay healthy? If the suspected change was rolled back, did the affected metric recover?In one investigation, an agent traced failing ChatGPT conversations to errors in image downloads and marked the cause as found. The Codex reviewer noticed that the internal service responsible for locating files had already recovered while image requests were still failing. The diagnosis did not explain the continuing failures, so the AI reviewer reopened the investigation and recorded what still needed to be established.We’ve had success breaking larger jobs into focused Codex turns. In a manual review of 100 root cause suggestions, we graded 70% as accurate, with 30% needing further refinement or not fully establishing causality. In the Regression Workflow, different turns investigate regressions, challenge diagnoses, and propose fixes to increase accuracy numbers through checks and balances.Fixing the regression is the hard partOnce the diagnosis passes adversarial review, the workflow asks Codex to implement a fix and open a pull request. An engineer reviews the PR and decides whether to merge it. We’ve put a significant amount of work into making this handoff as easy as possible. Each task has a report with an automatically generated summary of the regression, its impact, the root cause, and the proposed fix. We’ve tuned these summaries to be easy to scan, including metrics time series, CPU flame graphs, and traces to help engineers quickly understand the findings and inspect the evidence. Engineers can edit the PR directly or use the diagnosis to write their own fix. If they leave comments on the PR, the workflow wakes an agent to address them.An example task report for a regression shows key details, root cause, and proposed fix.After an engineer deploys the fix, the workflow wakes an agent to check whether performance has returned to its earlier baseline. If it has, the agent marks the task as resolved. If performance has only partially recovered, the agent resolves the original regression and opens a new task for the remaining slowdown, which may have a different cause. If there’s no improvement, the agent records what happened and sends the regression back for investigation.Getting fixes right has been harder than finding the cause. For example, we’ve seen cases where the agent-proposed changes are more complicated than necessary or introduce new issues. Similar to the root cause step, we added an adversarial review of each proposed fix to check whether they address the root cause and help catch bugs or unintended consequences. Some fixes also require higher level architectural decisions. For example, adding a cache might improve performance but introduce stale data. Changes like these benefit from guidance from an engineer who knows the service and can weigh the tradeoffs.We’re building an evaluation and improvement loop using these cases. By comparing the fixes agents propose with the changes engineers ultimately merge, we can better understand where proposals fall short, build evals, and improve the workflow. We’re also working on using synthetic performance tests so agents can measure proposed fixes and revise them before asking an engineer for review. We’re also exploring how agents could use our other agentic review tools to identify low-risk changes and eventually ship those fixes without a human in the loop.What we learnedBuilding and running the Performance Factory has taught us a lot about developing and operating agent workflows in production. Here are some lessons for teams building their own agentic workflows.Protect engineers’ attentionThe raw output from a Codex investigation can be a wall of text that’s hard to parse. It takes effort to figure out what the agent is claiming and track down the graphs to see whether the data backs it up. We want engineers to spend their attention on decisions rather than reconstructing the agent’s work.Agents can investigate more regressions than a team has time to read about. Our first version gave engineers a UI full of findings, but someone still had to decide which information mattered. One regression can also appear as several incidents across alerts, monitors, and channels. The workflow now links related incidents, groups them by the metrics teams care about, and ranks their estimated impact. Engineers can focus on adding context, weighing tradeoffs, and deciding what to ship.Evaluate changes to your agentsUpdating an investigation skill or upgrading the model can make the agent better at diagnosing some cases and worse at others, so we need to test their impact before updating them. We test two things separately: 1) how well the agent investigates and 2) how useful its summaries are to engineers.Evaluating investigationsFor investigations, we backtest against past production incidents. We turn those incidents into a suite of test cases we can rerun when we change the skill. A Codex agent attempts to investigate and resolve the incident, and we compare the agent’s behavior to the actual past resolution data. Each case starts with a fresh Codex investigator and the original signal, stripped of details that might give away the answer.Historical tests need care. Metrics and traces expire, while evidence collected after recovery can give away the cause. A test is only useful if we understand what evidence the investigator could see. The agent can inspect code and query production telemetry within set limits. It cannot use saved memories (notes from earlier investigations), read the incident writeup, or see results from previous runs. We also inspect its transcript afterward for information that might have spoiled the test.We score when the problem began, how large it was, and which requests were affected. We also evaluate how the agent uses evidence to rank possible causes and explain what remains uncertain. An agent can get the timing right and still blame the wrong deployment, so we score those separately.Evaluating agent-to-engineer handoffsWe evaluate task summaries using snapshots of saved tasks. These make particularly good backtests because summarization does not depend on external metrics or traces that expire. A separate grader checks whether an engineer unfamiliar with the system can understand what happened and why it matters, whether useful charts were kept, and whether the proposed next step is supported by the evidence.Turn recurring failures into self-repairLastly, our agents need monitoring just as much as the services they investigate. A broken profiler or a missing permission can keep an agent from verifying what caused a slowdown. Those failures can be hard to spot in the final report, so we run an agent every day to look through messages and logs from recent runs for tool failures and access errors.We use the Performance Factory to self-repair and fix the problems this check uncovers. When the same tool error blocks several investigations, the agent creates a task to fix it. If the cause is clear, an agent proposes a fix, and an engineer reviews the change and decides whether to merge it. After merging changes like this, we also use evals to check whether agents can get past the step that previously blocked them.What’s next: broader applications, proactive monitoringThe Regression Workflow is just one instance of the agent factory pattern that moves tasks through explicit states. Agents advance the task when more work is ready; separate reviewers challenge the conclusions; engineers step in when the next decision requires judgment. Other workflows can reuse the same machinery with different states, instructions, and events.From one workflow to many. The Performance Factory can coordinate agents across workflows, with agents in one workflow creating tasks for another.Currently, our Regression Workflow starts when an alert fires. However, we’re working on more proactive ways for the Performance Factory to find slowdowns and optimizations even when no alert fires. We want agents to use the large amount of fine-grained performance data we already collect to spot regressions our alerts miss or discover optimizations. By comparing different kinds of data (batches of CPU and memory profiles, heap dumps, and request traces across releases), an agent might notice a small increase in CPU for a given request. It can then open a task in the Regression Workflow to trace the increase to its cause, implement a fix, and open a PR for an engineer to review.In cases where we already know what to look for, we’re working to encode known signals into more Performance Factory workflows. Our service rightsizing skill, for example, helps agents spot autoscaling settings that keep more replicas running than a service needs. When we learn to recognize a pattern like that, we want to build and regularly run a workflow for it across all our services, constantly optimizing in a rapidly changing environment. With the Performance Factory, what an engineer learns from one slowdown can shape how we investigate and fix the next one, even months later in a different service.Next time you’re using ChatGPT and notice a slowdown, there’s a good chance the Performance Factory is already figuring out why. Today, the bottleneck may be waiting for an engineer to review and merge the fix. We’re already exploring whether agents can do this themselves. As product development keeps accelerating with Codex, performance systems need to become increasingly autonomous and self-improving to keep up. Codex already helps us build ChatGPT faster. Now it’s helping us keep ChatGPT fast.

The staggering pace of agentic development has made traditional approaches to performance engineering unsustainable. To keep up, we built the Performance Factory, an autonomous system that uses the full capabilities of Codex and our models to find and fix regressions at an unprecedented speed. The Performance Factory, which runs in the cloud and automates investigating and resolving performance problems, enables us to keep pace with the ambition of our roadmap.

In the Performance Factory, our engineers define workflows for recurring jobs and write instructions for the Codex agents that carry them out. In particular, the Regression Workflow opens a task when a performance alert fires. An agent investigates the slowdown, records its findings in the task, and proposes a fix for an engineer to review. After deployment, another agent picks up the same task to check whether performance has returned to baseline. From investigating to authoring the fix to verifying mitigation, this first workflow in the Performance Factory has automated the entire process of fixing regressions. In just over three months, the Regression Workflow tracked more than 1,700 investigations and root caused over 600 cases. That’s 17 automated investigations every day.

Here, we’ll share how our use of Codex evolved into what’s now the Performance Factory, walk through our first running workflow, and share early lessons from building and running agent workflows in production.

The path from manual investigations to automated workflows

As we used Codex for more of our performance work, we noticed a progression in how our team worked. We hope other service teams can learn from our process as they adopt agentic workflows in other domains.
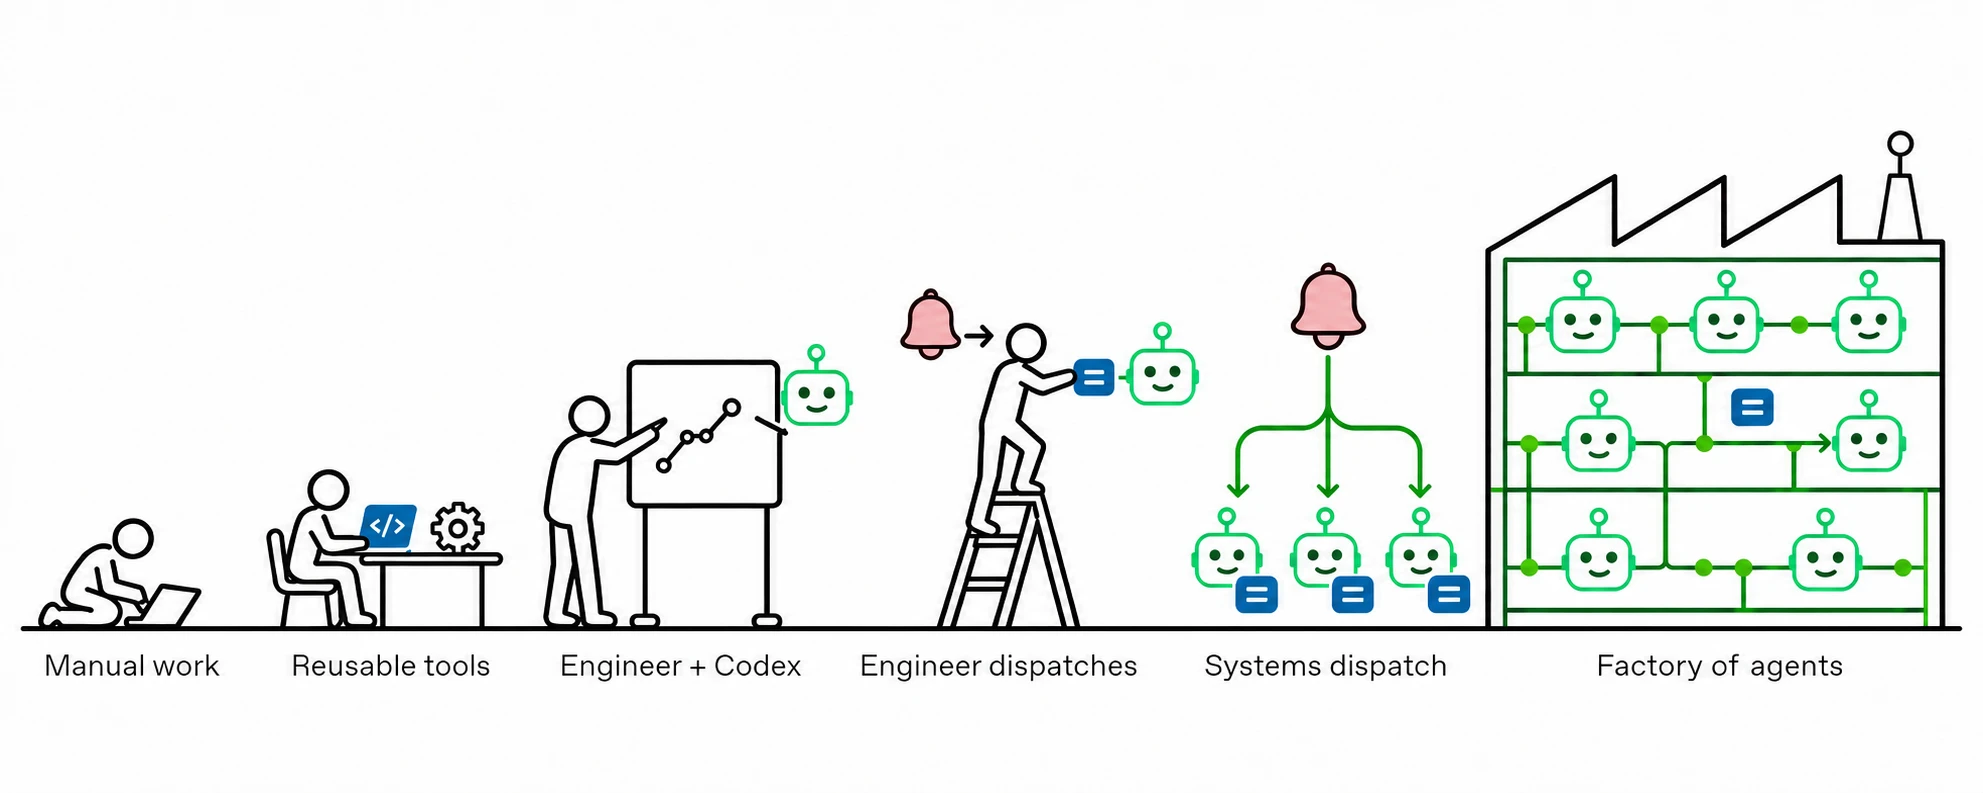
The evolution of performance engineering: manual work, reusable tools, engineers working with Codex, engineers dispatching tasks, systems dispatching tasks, and a factory of agents coordinating automated workflows.

Software work evolves from manual labor to partnering with machines to agent factories.

1. Pre-Codex. Before Codex, engineers manually examined metrics and logs, compared traces, debugged live machines, and read code to investigate a slowdown. This work was time consuming, and knowing where to look often required deep knowledge of the service. Relevant signals were easy to miss. When we encountered the same kinds of problems repeatedly—like regressions in ChatGPT’s first token latency—we built advanced tools, like CPU and allocation profilers, to make those investigations easier. Over time, we accumulated more than 30 performance tools.

2. Codex as a partner. Once we had Codex as a partner, engineers could ask, “Why did this get slower?” and work with Codex to investigate, even in an unfamiliar system. Codex could search large codebases, find relevant metrics and traces, follow interactions across services, and do appropriate profiling to piece together what had happened. But engineers still had to steer the process, knowing which performance tools to use and how to guide the investigation. Difficult investigations were more debuggable for more people, with less expertise and time required.

3. Reusable skills. To automate further, we captured our performance team’s investigation process in a shared skill called perf-forensics. It tells Codex which tools are available, when to use them, and how to work through a slowdown so Codex can try to resolve the problem from a few angles:

  • Find when the slowdown began

  • Identify the affected requests

  • Investigate whether deployments or configuration changes could explain it

We tested and refined the perf-forensics skill using evals based on past regressions. For the types of regressions we focused on (for example, ChatGPT latency and availability drops), we could now give Codex an alert and get back a diagnosis in a single run, without guiding it through each step.

4. The human proxy. As we added and refined perf-related Codex skills like perf-forensics, we started to feel like a proxy between our alerts and Codex. An alert would fire, and an engineer would simply copy and paste it into Codex with the right skill, then paste the findings back into Slack.

5. Automated investigations. Next, we moved investigations to the cloud so an alert could start a Codex session automatically. Codex investigated the slowdown and posted its findings in the Slack thread, but the automation ended with that reply. An engineer still had to pick up the diagnosis, develop a fix, and check whether it worked after deployment. As alerts accumulated, even figuring out which regressions needed attention meant sifting through Slack threads.

6. The factory. We built the Performance Factory to run end-to-end agentic performance engineering workflows. It tracks what each active task needs next and assigns an agent when that step is ready. Each task keeps its state and findings, so work can pass between agents and engineers and resume after a code review or deployment. For a regression, the work starts with investigating an alert and ends with verifying recovery in production. We can turn common optimizations into workflows that run regularly across our services. A workflow that spots a potential optimization can open a task in another workflow to test and implement it.

The Performance Factory system’s four parts

The Performance Factory is made up of four components: a task tracker with configurable workflows, a dispatch loop that assigns ready work to agents, an API that runs Codex in the cloud, and subscriptions that wake agents when something changes (such as a GitHub review comment posting or a deployment completing).
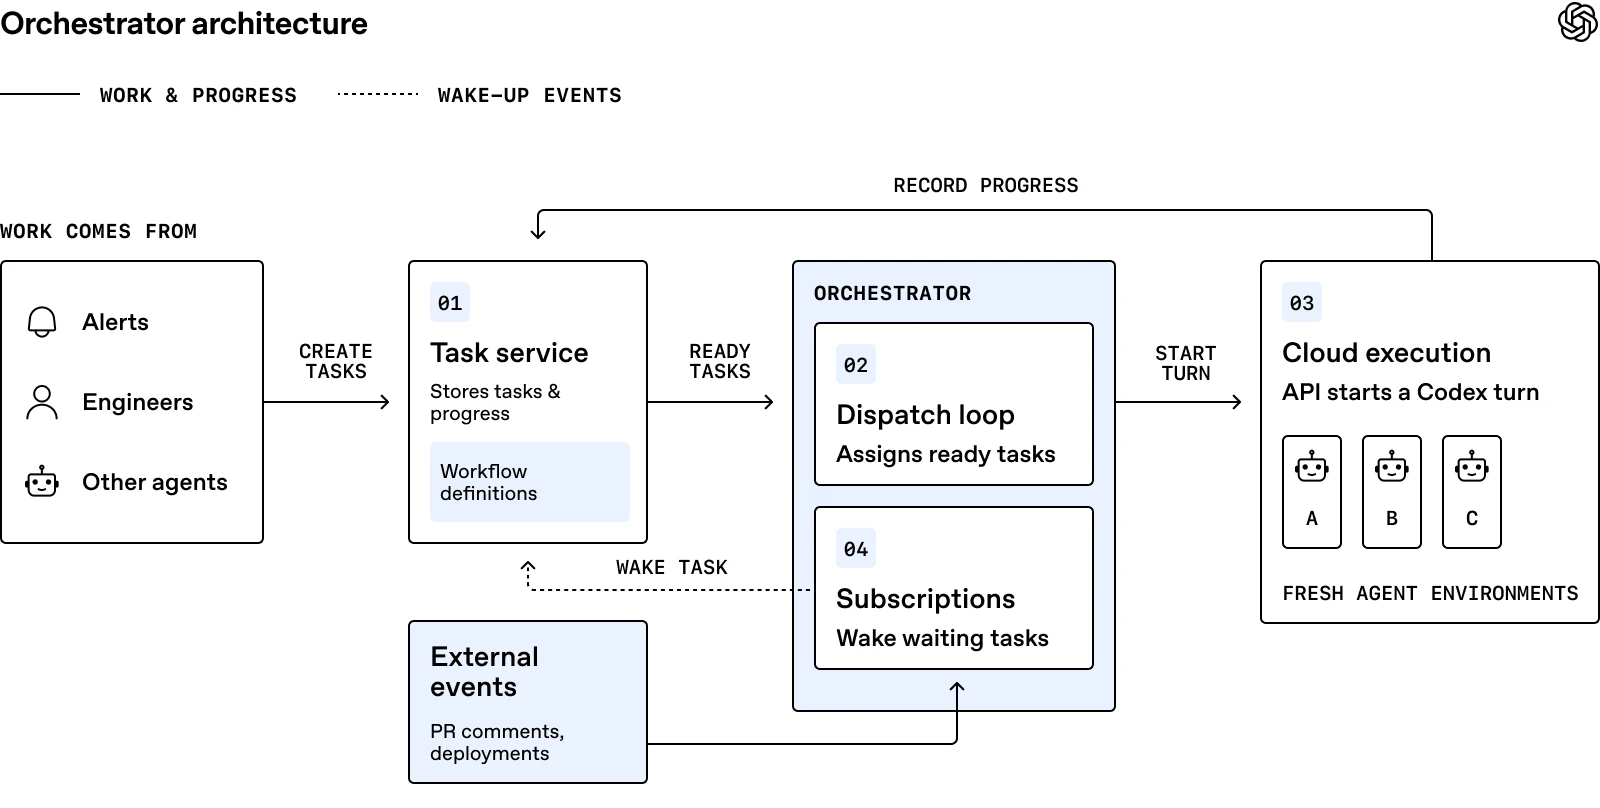
Performance Factory orchestration workflow: alerts, engineers, and other agents create tasks; the task service sends ready tasks to a dispatch loop, which starts Codex turns in the cloud. Agents record progress, while subscriptions wake waiting tasks after PR comments or deployments.

Performance Factory consists of a task service, dispatch loop, cloud execution, and subscriptions.

Task service with configurable workflows

The task service is where engineers define workflows by adding configuration files and prompts for the agents to follow, written in Markdown. The configuration lists the states a task can move through, the allowed transitions, and which steps need an engineer. Separate prompts tell agents what to do at each step.

Plain text

A code change task contains a configuration file, along with Markdown prompts for implementing and reviewing.

Each piece of work becomes a task in a workflow, and all workflows are visible in a UI. Engineers can see what’s open, follow progress, and share a task with a teammate who might have more context or be able to help with the next step.

Dispatch loop that assigns work

A dispatch loop periodically checks which tasks are ready for the next step. It assigns an agent to each task by starting a Codex turn with the instructions for the task’s current state. The agent records its progress on the task and moves it to the next state if it completes the step.

Codex in the cloud

Once a task is assigned, the agent needs a place to do the work, with access to the same tools an engineer would use. We built an internal API to programmatically invoke a Codex turn in the cloud. The Codex turn runs on an environment inside our network, with access to our code repositories and the observability tools our engineers use, such as metrics, logs, traces, CPU profiles, and memory snapshots.

The agent runs under a service identity, so we can scope its permissions and see which actions came from our performance agents. Moving agentic work to the cloud lets us run work in parallel without relying on engineers’ laptops being open or manually managing individual cloud development boxes.

Subscriptions that wake the agent when something changes

Some work has to wait for a person or a deployment; an agent shouldn’t have to keep running in the meantime. When a task needs to wait, it can subscribe to events like review comments or failed CI checks on a GitHub pull request to get notified when it’s time to pick the work back up. When an incoming event matches the subscription, the task becomes ready again and the dispatch loop can then assign an agent to continue the work.

The first workflow: from alert to recovery

Finding, root causing, and solving regressions is the first workflow we built inside the Performance Factory. We call it the Regression Workflow. A performance regression moves through several stages: needs investigation, root caused, fix proposed, and resolved, so we built the automated workflow to reflect and move a task through those same stages.

When one of its configured performance alerts fires, the Regression Workflow opens a task that agents pick up and move across these stages. The task records its status and key findings outside of any one agent’s context so that other agents or engineers can pick up the work. Engineers can follow the work in Slack or the Regression Workflow UI, add context, and review proposed changes. After a fix is deployed, an agent checks whether the performance has recovered to its original state before resolving the task.

Performance Factory regression workflow

A regression is detected.

  1. DetectedSystem
  2. Find root causeAgent
  3. Propose fixAgent
  4. Review & deployEngineer
  5. Verify recoveryAgent
  6. Resolved

Active stage: Detected

The Regression Workflow’s steps include finding the root cause, proposing a fix, reviewing and deploying, and verifying recovery.

Agents find the root cause

Finding the root cause (or causes) is the first major step in the workflow. The agent starts by figuring out which metrics got worse, when they started to change, and which service requests were affected. The perf-forensics skill gives Codex access to the tools our performance engineers use and a playbook for working through those questions.

An alert fires when a metric crosses a threshold, but the regression may have started hours earlier. The agent looks back through the data to find when the metric first got worse. It then compares groups of requests: did similar requests actually get slower, or were we serving more requests that were already slow? Those findings point to different causes.

Once it knows when and where to look, the agent examines deployments and feature flag changes, then reads the relevant code. It checks when a change actually reached the affected requests and uses logs or traces to test whether the code could explain what happened.

Adversarial review strengthens the diagnosis

Early on, agents sometimes stopped at the first plausible explanation they found, and some of those diagnoses turned out to be wrong. To catch these mistakes, we added an adversarial review: a separate Codex session that tries to disprove the proposed diagnosis. The reviewer rechecks the assumptions and tests counterfactuals. If a rollout caused the slowdown, did similar requests that weren’t exposed stay healthy? If the suspected change was rolled back, did the affected metric recover?

In one investigation, an agent traced failing ChatGPT conversations to errors in image downloads and marked the cause as found. The Codex reviewer noticed that the internal service responsible for locating files had already recovered while image requests were still failing. The diagnosis did not explain the continuing failures, so the AI reviewer reopened the investigation and recorded what still needed to be established.

We’ve had success breaking larger jobs into focused Codex turns. In a manual review of 100 root cause suggestions, we graded 70% as accurate, with 30% needing further refinement or not fully establishing causality. In the Regression Workflow, different turns investigate regressions, challenge diagnoses, and propose fixes to increase accuracy numbers through checks and balances.

Fixing the regression is the hard part

Once the diagnosis passes adversarial review, the workflow asks Codex to implement a fix and open a pull request. An engineer reviews the PR and decides whether to merge it. We’ve put a significant amount of work into making this handoff as easy as possible. Each task has a report with an automatically generated summary of the regression, its impact, the root cause, and the proposed fix. We’ve tuned these summaries to be easy to scan, including metrics time series, CPU flame graphs, and traces to help engineers quickly understand the findings and inspect the evidence. Engineers can edit the PR directly or use the diagnosis to write their own fix. If they leave comments on the PR, the workflow wakes an agent to address them.
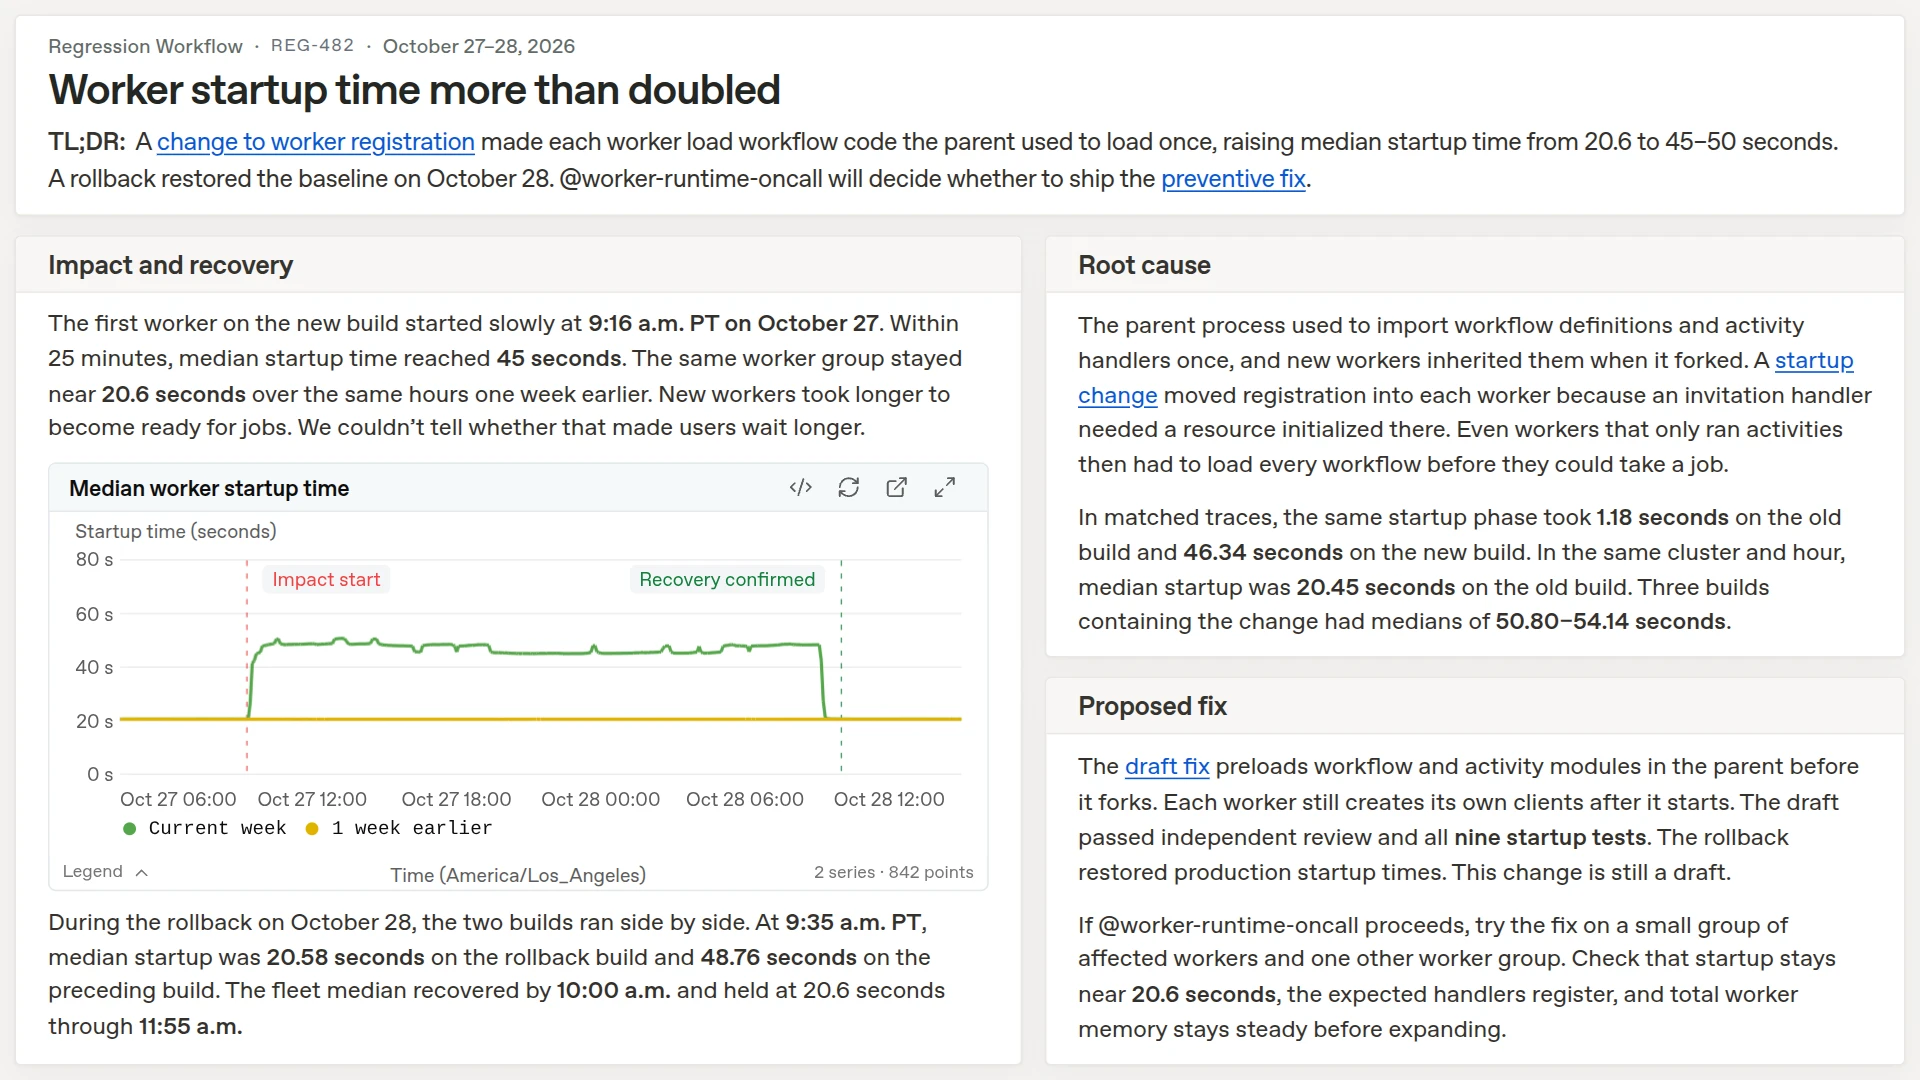
Performance Factory report showing worker startup time more than doubling, with impact and recovery, root cause, and proposed fix.

An example task report for a regression shows key details, root cause, and proposed fix.

After an engineer deploys the fix, the workflow wakes an agent to check whether performance has returned to its earlier baseline. If it has, the agent marks the task as resolved. If performance has only partially recovered, the agent resolves the original regression and opens a new task for the remaining slowdown, which may have a different cause. If there’s no improvement, the agent records what happened and sends the regression back for investigation.

Getting fixes right has been harder than finding the cause. For example, we’ve seen cases where the agent-proposed changes are more complicated than necessary or introduce new issues. Similar to the root cause step, we added an adversarial review of each proposed fix to check whether they address the root cause and help catch bugs or unintended consequences. Some fixes also require higher level architectural decisions. For example, adding a cache might improve performance but introduce stale data. Changes like these benefit from guidance from an engineer who knows the service and can weigh the tradeoffs.

We’re building an evaluation and improvement loop using these cases. By comparing the fixes agents propose with the changes engineers ultimately merge, we can better understand where proposals fall short, build evals, and improve the workflow. We’re also working on using synthetic performance tests so agents can measure proposed fixes and revise them before asking an engineer for review. We’re also exploring how agents could use our other agentic review tools to identify low-risk changes and eventually ship those fixes without a human in the loop.

What we learned

Building and running the Performance Factory has taught us a lot about developing and operating agent workflows in production. Here are some lessons for teams building their own agentic workflows.

Protect engineers’ attention

The raw output from a Codex investigation can be a wall of text that’s hard to parse. It takes effort to figure out what the agent is claiming and track down the graphs to see whether the data backs it up. We want engineers to spend their attention on decisions rather than reconstructing the agent’s work.

Agents can investigate more regressions than a team has time to read about. Our first version gave engineers a UI full of findings, but someone still had to decide which information mattered. One regression can also appear as several incidents across alerts, monitors, and channels. The workflow now links related incidents, groups them by the metrics teams care about, and ranks their estimated impact. Engineers can focus on adding context, weighing tradeoffs, and deciding what to ship.

Evaluate changes to your agents

Updating an investigation skill or upgrading the model can make the agent better at diagnosing some cases and worse at others, so we need to test their impact before updating them. We test two things separately: 1) how well the agent investigates and 2) how useful its summaries are to engineers.

Evaluating investigations

For investigations, we backtest against past production incidents. We turn those incidents into a suite of test cases we can rerun when we change the skill. A Codex agent attempts to investigate and resolve the incident, and we compare the agent’s behavior to the actual past resolution data. Each case starts with a fresh Codex investigator and the original signal, stripped of details that might give away the answer.

Historical tests need care. Metrics and traces expire, while evidence collected after recovery can give away the cause. A test is only useful if we understand what evidence the investigator could see. The agent can inspect code and query production telemetry within set limits. It cannot use saved memories (notes from earlier investigations), read the incident writeup, or see results from previous runs. We also inspect its transcript afterward for information that might have spoiled the test.

We score when the problem began, how large it was, and which requests were affected. We also evaluate how the agent uses evidence to rank possible causes and explain what remains uncertain. An agent can get the timing right and still blame the wrong deployment, so we score those separately.

Evaluating agent-to-engineer handoffs

We evaluate task summaries using snapshots of saved tasks. These make particularly good backtests because summarization does not depend on external metrics or traces that expire. A separate grader checks whether an engineer unfamiliar with the system can understand what happened and why it matters, whether useful charts were kept, and whether the proposed next step is supported by the evidence.

Turn recurring failures into self-repair

Lastly, our agents need monitoring just as much as the services they investigate. A broken profiler or a missing permission can keep an agent from verifying what caused a slowdown. Those failures can be hard to spot in the final report, so we run an agent every day to look through messages and logs from recent runs for tool failures and access errors.

We use the Performance Factory to self-repair and fix the problems this check uncovers. When the same tool error blocks several investigations, the agent creates a task to fix it. If the cause is clear, an agent proposes a fix, and an engineer reviews the change and decides whether to merge it. After merging changes like this, we also use evals to check whether agents can get past the step that previously blocked them.

What’s next: broader applications, proactive monitoring

The Regression Workflow is just one instance of the agent factory pattern that moves tasks through explicit states. Agents advance the task when more work is ready; separate reviewers challenge the conclusions; engineers step in when the next decision requires judgment. Other workflows can reuse the same machinery with different states, instructions, and events.

From one workflow to many. The Performance Factory can coordinate agents across workflows, with agents in one workflow creating tasks for another.

Currently, our Regression Workflow starts when an alert fires. However, we’re working on more proactive ways for the Performance Factory to find slowdowns and optimizations even when no alert fires. We want agents to use the large amount of fine-grained performance data we already collect to spot regressions our alerts miss or discover optimizations. By comparing different kinds of data (batches of CPU and memory profiles, heap dumps, and request traces across releases), an agent might notice a small increase in CPU for a given request. It can then open a task in the Regression Workflow to trace the increase to its cause, implement a fix, and open a PR for an engineer to review.

In cases where we already know what to look for, we’re working to encode known signals into more Performance Factory workflows. Our service rightsizing skill, for example, helps agents spot autoscaling settings that keep more replicas running than a service needs. When we learn to recognize a pattern like that, we want to build and regularly run a workflow for it across all our services, constantly optimizing in a rapidly changing environment. With the Performance Factory, what an engineer learns from one slowdown can shape how we investigate and fix the next one, even months later in a different service.

Next time you’re using ChatGPT and notice a slowdown, there’s a good chance the Performance Factory is already figuring out why. Today, the bottleneck may be waiting for an engineer to review and merge the fix. We’re already exploring whether agents can do this themselves. As product development keeps accelerating with Codex, performance systems need to become increasingly autonomous and self-improving to keep up. Codex already helps us build ChatGPT faster. Now it’s helping us keep ChatGPT fast.

Shape
Shape
Stay Ahead

Explore More Insights

Stay ahead with more perspectives on cutting-edge power, infrastructure, energy,  bitcoin and AI solutions. Explore these articles to uncover strategies and insights shaping the future of industries.

Shape

F5 scrambles to fix more critical BIG-IP security flaws

CVE-2026-121805: When an iRule that processes client traffic using the PEM:subscriber command is configured on a virtual server, undisclosed requests can cause the Traffic Management Microkernel (TMM) to terminate and may lead to remote code execution (RCE); CVE-2026-120292: When an HTTP profile and an iRule using the MR:message route command

Read More »

Energy Secretary Keeps Critical Generation Available in Mid-Atlantic

WASHINGTON—U.S. Secretary of Energy Chris Wright today issued an emergency order to address critical grid reliability issues facing the mid-Atlantic region of the United States. The order directs PJM Interconnection L.L.C. (PJM), in coordination with Constellation Energy Corporation (Constellation Energy), to ensure Units 3 and 4 of the Eddystone Generating Station in Pennsylvania remain available to operate and to employ economic dispatch to minimize costs for the American people. The units were originally slated to shut down on May 31, 2025.   “The energy sources that perform when you need them most are the most valuable,” said U.S. Secretary of Energy Chris Wright. “President Trump and the Energy Department are committed to keeping critical generation available when demand is highest, reducing the risk of blackouts and ensuring Americans have affordable, reliable, and secure power—regardless of whether the wind is blowing or the sun is shining.”  Secretary Wright first ordered that the two Eddystone Generating Station units remain online past their planned retirement date in a May 30, 2025 emergency order. Subsequent orders were issued later in 2025 and 2026. Keeping these units operational has strengthened energy security in the PJM region, ensuring reliable electricity for American families and businesses. This order is in effect beginning on November 21, 2026, through February 18, 2027. 

Read More »

ExxonMobil takes FID on Angola Block 15 extension project

The Block 15 Lifespan Extension Project, about 145 km off Angola’s northern coast, will utilize existing infrastructure to develop additional resources throughout the Kizomba Hub area. The investment decision completes project FIDs following approval of Kizomba C redevelopment in 2025. ANPG also noted a hydrocarbon discovery in the block at the Tchihumba West-01ST1 exploration well, about 350 km northwest of Luanda. The discovery is the 21st in the block and the second this year. The well, drilled by the Valaris DS-9 in about 1,400 m of water, encountered 65.4 m of sandstone reservoir with hydrocarbon presence and good petrophysical properties. ExxonMobil is operator at Block 15 (36%) with partners Azule Energy Exploration (ANG) Ltd. (24%), Azule Energy ANG BV (18%), Equinor Angola (12%), and Sonongol E&P (10%).

Read More »

Market reforms bolster grid, may lower costs this winter: FERC

Listen to the article 4 min This audio is auto-generated. Please let us know if you have feedback. Electric market reforms in the West and Northeast may bolster grid reliability and, in some cases, lower costs this winter, according to the Federal Energy Regulatory Commission’s annual winter market and reliability report, released Thursday. Expanded markets help offset drought impacts In the West, the California Independent System Operator launched the Extended Day Ahead Market and the Southwest Power Pool expanded into the Western Interconnection earlier this year. “EDAM and SPP’s expansion should provide ratepayers in much of the West with production cost savings and improved reliability in winter 2026-2027, particularly during cold weather events,” FERC staff said in the report. This winter, the markets’ improved coordination of generation and reduced need for reserve power supplies will help offset lower power output from the Glen Canyon and Hoover dams due to historically low water levels in the Colorado River basin, staff said. “On a day-to-day basis, these conditions can create congestion and affect system operators’ ability to respond to voltage support challenges, event response mitigation needs, or any additional grid stressors,” staff said in the report. About 45% of the continental United States and 95% of the Intermountain West region is in a drought, according to the report. Hydro, oil pose challenges for Northeast In the Northeast, ISO New England lowered its capacity performance pay rate, which should lower electricity prices during emergency conditions or capacity performance events this winter, staff said. Also, the New York Independent System Operator changed its installed capacity market rules to reflect uncertainty about how much power Hydro–Québec will deliver over the 1,250-MW Champlain Hudson Power Express transmission line in the winter, they noted. The U.S. subsidiary of the Canadian utility Hydro-Québec — the primary reservation holder — has an obligation

Read More »

Dangote awards contracts advancing Lekki refining complex expansion

Dangote Group’s Dangote Petroleum Refinery and Petrochemicals FZE (DPRP) has awarded separate contracts to Kirloskar Group of India’s Kirloskar Brothers Ltd. (KBL) and Kirloskar Ebara Pumps Ltd. (KEPL)—a KBL joint venture with Ebara Corp. of Japan—for delivery of engineering services and equipment as part of a phased capacity expansion currently underway at DPRP’s 650,000-b/d refinery and petrochemical complex in the Lekki Free Zone near Lagos, Nigeria. In a Nov. 20 regulatory filing submitted to both BSE Ltd. and The National Stock Exchange of India Ltd., KBL said the combined value of the orders under the contracts amounted to about $38.94 million, $21.34 million of which would cover KEPL’s scope of work, with KBL to retain the remaining $17.60 million as compensation for a leg of the project. The service provider offered no additional details regarding either its own of KEPL’s scope of deliverables under the agreement other than that the work was to include engineering expertise and provision of “specialized pumping solutions for demanding energy applications.” The Lekki complex expansion involves increasing the refinery’s crude processing capacity by an additional 750,000 b/d to 1.4 million b/d in two phases to be executed between 2025-28 and 2028-30, respectively. The proposed expansion also includes plans to increase the site’s production of propylene by 750,000 tonnes/year (tpy), as well as adding 400,000 tpy of fresh production capacity for linear alkylbenzene (LAB).

Read More »

How NV5 Digital Twins Help Oil & Gas Facilities Reduce Downtime and Improve Safety

Refining, midstream, and production operators face increasing pressure to reduce downtime, improve safety, and make faster decisions with increasingly complex asset data. One leading international energy company partnered with NV5 Geospatial to deploy high-fidelity digital twins that unified engineering, inspection, and operational data across multiple facilities. The result: faster planning and approvals, safer operations, fewer travel requirements, and measurable reductions in outage windows.   The Challenge  The company’s refineries and offshore/onshore facilities are high-consequence environments where even brief shutdowns can cost millions per day. Engineering drawings, P&IDs, laser scans, SCADA/IoT feeds, and maintenance systems existed in separate silos making it difficult for staff to access a shared, current view of assets or to plan complex maintenance activities safely and efficiently.   Additionally, the organization sought to reduce field exposure for subject-matter experts (SMEs) by enabling remote collaboration and to improve predictability in outage planning and maintenance “switchovers,” where downtime forecasting directly affects operational revenue.   The Solution  NV5 Digital Twin = Geospatial system of record + automation.  NV5 delivered a scalable, field-to-cloud workflow that fused reality capture, engineering data, and live system integration into a unified, photorealistic 3D environment.   Reality Capture  Rotary-wing acquisition using NV5’s custom multi-sensor pod with RIEGL VUX-240 LiDAR (~300 ppsm) and 150MP nadir + oblique imagery (1″ GSD), flown with 80% side/forward lap for high-fidelity photomesh creation.  NV5 coordinated with local air-traffic control and operated from a nearby hangar to minimize mobilization time.  IS-BAO Stage 3 aviation safety certification and on-staff licensed surveyors ensured quality and compliance.   This level of detail enables operators to virtually inspect assets, plan maintenance activities, and validate engineering decisions without repeated site visits. Processing and Integration  SBET-calibrated LiDAR and imagery were processed into advanced classified point clouds, DEM/DSM surfaces, and textured 3D meshes (delivered OBJ/Esri Scene Layer, and Cesium 3D Tiles 1.1 formats).  Engineering

Read More »

FERC approves Sabine Pass LNG expansion, four other major gas projects

The US Federal Energy Regulatory Commission (FERC) approved 5 gas infrastructure projects Nov. 19, including a nearly 20-million-tonne/year (tpy) expansion of Cheniere Energy’s Sabine Pass LNG export plant in Louisiana, two associated feedgas pipeline projects, and new gas transportation and storage infrastructure in 5 other states. The approvals encompass roughly $3 billion in proposed pipeline and storage investments, excluding construction costs for the Sabine Pass liquefaction expansion. Cheniere estimates the full Sabine Pass Stage V LNG expansion will cost $15 billion, according to a June 2025 filing with the US Department of Energy. Sabine Pass Stage V expansion FERC authorized Cheniere Energy subsidiaries Sabine Pass Liquefaction LLC and Sabine Pass Liquefaction Stage V LLC to construct and operate 3 additional liquefaction trains at the existing Sabine Pass LNG plant in Cameron Parish, La. The expansion would add up to 20 million tpy of LNG production capacity to the existing 30 million tpy 6-train plant.  Phase 1 calls for Train 7, with peak production capacity of about 6 million tpy, and a boil-off gas reliquefaction unit capable of producing about 1 million tpy. Phase 2 would add Trains 8 and 9, each with peak production capacity of 6 mtpa, along with supporting infrastructure and upgrades to marine loading infrastructure.  Cheniere has not yet taken final investment decision, but expects to greenlight Phase 1 by early 2027, subject to regulatory approvals and financing arrangements. The company previously said initial LNG exports could begin in 2030, with commercial service potentially starting in mid-2031. FERC also authorized two pipeline projects to supply additional feedgas to the expanded terminal. The $1.63 billion Sabine Crossing Pipeline project would build 55.6 miles of 48-in. OD pipeline between southeast Texas and Sabine Pass, along with a new 210,000-hp compressor station and related infrastructure. The pipeline would transport up

Read More »

The Data Center Backlash Has a Playbook

The data center industry’s next development constraint may have less to do with megawatts than with the politics of where those megawatts are deployed. The warning became difficult to ignore on November 3, when American voters approved 33 local ballot measures restricting data center development or expressing opposition to it, according to Ballotpedia’s analysis of the 2026 midterm elections. The results included outright bans, partial prohibitions, temporary moratoriums, and new requirements for community oversight. Voters also rejected 13 measures that would have favored development or expressed support for it. For an industry accustomed to evaluating prospective sites through the availability of power, land, fiber, capital, and construction resources, the election results reinforced another increasingly consequential consideration: whether the communities hosting digital infrastructure are willing to accept its growing physical and economic footprint. As Data Center Frontier recently examined in its post-election assessment of the industry’s political future, the national push to accelerate AI infrastructure construction is colliding with a more complicated political reality at the state and local levels. Opposition crosses party lines, while questions surrounding utility rates, water, environmental impacts, and local economic benefits have moved from planning commission meetings into broader electoral debate. That changing environment was the subject of a conversation recorded at the DCF Trends Summit 2026 in Reston, Virginia, where DCF contributing editor Doug Black sat down with Adam Waitkunas, president of Milldam Public Relations, and Julia Chuang, founder of LocalQ Labs and an associate professor of sociology at the University of Maryland. Their discussion explored a fundamental shift in the development equation: community opposition is becoming more organized and politically consequential, but also more observable through data. The challenge for developers is to understand that risk early enough to influence site selection and project design, while recognizing that public trust cannot be manufactured through

Read More »

Oak Ridge’s AI Factory Moment: Lux, Nuclear Power, and the Next Data Center Frontier

For much of its history, Oak Ridge has been associated with the Manhattan Project and the subsequent development of America’s nuclear research and production capabilities. Established during World War II, the community became home to major facilities for uranium enrichment, nuclear materials processing, scientific research, and ultimately high-performance computing. Today, that legacy is being repurposed for a new generation of industrial development. The former K-25 uranium enrichment complex, once a critical part of the nation’s atomic weapons program, has been transformed into the East Tennessee Technology Park (ETTP), where extensive environmental cleanup and redevelopment have made former federal property available for commercial use. At an October 27 gathering in Oak Ridge, federal officials and nuclear industry representatives highlighted more than $15 billion in announced nuclear-related projects across the region, an investment wave subsequently documented in a November 17 DOE report on Oak Ridge’s emerging energy hub. The investment figure largely represents planned private-sector development rather than completed capital spending. Regional officials also anticipate demand for thousands of construction workers over the next five years, with additional permanent manufacturing and operating positions potentially following as projects advance. In March, DOE completed its largest Oak Ridge land transfer to date, conveying more than 700 acres for economic reuse. The transfer included a 624-acre parcel designated for Orano USA’s planned uranium enrichment complex and a 77-acre parcel associated with Oklo’s proposed nuclear fuel recycling development. Overall, more than 2,500 acres have been transferred from federal ownership for redevelopment, following decades of cleanup and the demolition of hundreds of former industrial structures. For nuclear developers, the appeal is straightforward: large industrial sites, existing utility and transportation infrastructure, proximity to federal laboratories, and an established community of nuclear engineers, technicians, researchers, and specialized manufacturers. For data center developers, the implications are somewhat different but no

Read More »

Dell and Microsoft drive private AI as enterprises seek greater data control

Dell Technologies and Microsoft are expanding their private cloud partnership with a new set of infrastructure offerings designed to let enterprises run AI models closer to their data, reduce reliance on public cloud services and maintain control over sensitive information. The announcement, made during Microsoft’s Ignite conference, extends Dell’s AI Factory with Nvidia initiative to Dell Private Cloud environments. It also reflects a growing industry push toward internally deployed AI inferencing, particularly among organizations dealing with sensitive corporate information, regulatory requirements and data residency restrictions, Dell stated. The expanded offering combines Dell Private Cloud, Microsoft Azure Local, Microsoft Foundry Local and Nvidia acceleration. The objective is to provide organizations with an integrated infrastructure for deploying heavy AI workloads inside their own data centers and firewalls, the companies said.

Read More »

StarlingX 13.0 updates the network stack for distributed edge deployments

Edge sites do not always come with the network gear that a data center takes for granted. That’s a challenge the open-source StarlingX project from the OpenInfra Foundation is now tackling in its 13.0 update. StarlingX is an open-source distributed cloud platform that combines Linux, Kubernetes, OpenStack, and Ceph. The OpenInfra Foundation hosts the project, and operators including Verizon, Vodafone, T-Systems and KDDI use it for 5G and Open Radio Access Network (O-RAN) infrastructure. Earlier this year, the StarlingX 12.0 update added precision timing capabilities to help networking stay on time. The 13.0 update tackles a different set of issues. Key features include: Gateway API support. Calico-based support is available to hosted applications, while platform services still use Ingress NGINX Optional certificate authority. The Enterprise Java Beans Certificate Authority (EJBCA) runs on the platform and serves certificates to hosted applications. Subcloud restore. A backup restores directly onto a factory-installed node at a subcloud, a remote edge site, with no operating system reinstall. Direct upgrades. Operators can upgrade from two releases back with a single reboot per host. Layer 2 switching. A new Open vSwitch application lets servers at sites with no router next to them bridge traffic and connect directly to aggregation routers. “The OpenvSwitch application adds Layer 2 switching to the K8S platform,” Greg Waines, a senior member of technical staff at Wind River and a StarlingX Technical Steering Committee member, told Network World. “A server can bridge traffic between its SR-IOV network interfaces and other servers, and it can forward traffic to the site routers.”

Read More »

Sovereign AI is about control, not just location

Guetari was open about the term itself being fuzzy. “Sovereignty is very vague and not always clear,” he told me. “It’s about control, auditability, observability.” He drew a line between data locality, meaning the data stays in-country, and sovereignty, which he described as being “more about control, control of what happens to your data and your workload.” He then made the case for why F5 belongs in that conversation: “This is what we have been doing for two decades.” F5 has always sat in the data path, deciding what an application can communicate with, enforcing security rules, and logging what happened. For a regulated bank or government agency, the ability to reconstruct exactly what happened after an incident is worth more than a press release about a data center’s location. The token is the new unit of economics The most interesting part of my conversation with Guetari wasn’t about security. It was about business models. He argued that every successful technology business has found the right unit to monetize. “The cloud is selling the unit of the cloud, which is the CPU core, very well. SaaS is the seat,” he said. “Telcos have been very successful early on using the voice minute, and then they moved to the gigabyte. Sooner or later, that unit will be the token, and most telcos will have to move to the token. And the ones who will not go to token, unfortunately, will be just pipes.”

Read More »

Palo Alto Networks bets $4.5B on enterprise AI with Applied Compute acquisition

GPUs and data centers To train and host those models, Palo Alto plans to build its own compute capacity, CFO Dipak Golechha said on the call. The spending “will mostly go to GPUs and servers,” with a smaller share for the facilities that house them, he said. Palo Alto will “continue to source from our cloud partners” and add dedicated capacity over time, Golechha said. Arora said the company aims for more than100 megawatts of compute in the next three to five years. Gogia said Palo Alto has sovereignty credentials for security data, including customer-held keys and a European Cortex service governed by Deutsche Telekom. “None of that yet extends to GPUs,” he said, adding that a US-headquartered operator faces the same jurisdictional questions as the hyperscalers it rents capacity from. “A sovereign hosting offer with no named region, operator or date is a promise looking for an address,” Gogia said. Compliance officers should ask Palo Alto for a region list, the operator, and a dated certification plan, he said.

Read More »

Microsoft will invest $80B in AI data centers in fiscal 2025

And Microsoft isn’t the only one that is ramping up its investments into AI-enabled data centers. Rival cloud service providers are all investing in either upgrading or opening new data centers to capture a larger chunk of business from developers and users of large language models (LLMs).  In a report published in October 2024, Bloomberg Intelligence estimated that demand for generative AI would push Microsoft, AWS, Google, Oracle, Meta, and Apple would between them devote $200 billion to capex in 2025, up from $110 billion in 2023. Microsoft is one of the biggest spenders, followed closely by Google and AWS, Bloomberg Intelligence said. Its estimate of Microsoft’s capital spending on AI, at $62.4 billion for calendar 2025, is lower than Smith’s claim that the company will invest $80 billion in the fiscal year to June 30, 2025. Both figures, though, are way higher than Microsoft’s 2020 capital expenditure of “just” $17.6 billion. The majority of the increased spending is tied to cloud services and the expansion of AI infrastructure needed to provide compute capacity for OpenAI workloads. Separately, last October Amazon CEO Andy Jassy said his company planned total capex spend of $75 billion in 2024 and even more in 2025, with much of it going to AWS, its cloud computing division.

Read More »

John Deere unveils more autonomous farm machines to address skill labor shortage

Join our daily and weekly newsletters for the latest updates and exclusive content on industry-leading AI coverage. Learn More Self-driving tractors might be the path to self-driving cars. John Deere has revealed a new line of autonomous machines and tech across agriculture, construction and commercial landscaping. The Moline, Illinois-based John Deere has been in business for 187 years, yet it’s been a regular as a non-tech company showing off technology at the big tech trade show in Las Vegas and is back at CES 2025 with more autonomous tractors and other vehicles. This is not something we usually cover, but John Deere has a lot of data that is interesting in the big picture of tech. The message from the company is that there aren’t enough skilled farm laborers to do the work that its customers need. It’s been a challenge for most of the last two decades, said Jahmy Hindman, CTO at John Deere, in a briefing. Much of the tech will come this fall and after that. He noted that the average farmer in the U.S. is over 58 and works 12 to 18 hours a day to grow food for us. And he said the American Farm Bureau Federation estimates there are roughly 2.4 million farm jobs that need to be filled annually; and the agricultural work force continues to shrink. (This is my hint to the anti-immigration crowd). John Deere’s autonomous 9RX Tractor. Farmers can oversee it using an app. While each of these industries experiences their own set of challenges, a commonality across all is skilled labor availability. In construction, about 80% percent of contractors struggle to find skilled labor. And in commercial landscaping, 86% of landscaping business owners can’t find labor to fill open positions, he said. “They have to figure out how to do

Read More »

2025 playbook for enterprise AI success, from agents to evals

Join our daily and weekly newsletters for the latest updates and exclusive content on industry-leading AI coverage. Learn More 2025 is poised to be a pivotal year for enterprise AI. The past year has seen rapid innovation, and this year will see the same. This has made it more critical than ever to revisit your AI strategy to stay competitive and create value for your customers. From scaling AI agents to optimizing costs, here are the five critical areas enterprises should prioritize for their AI strategy this year. 1. Agents: the next generation of automation AI agents are no longer theoretical. In 2025, they’re indispensable tools for enterprises looking to streamline operations and enhance customer interactions. Unlike traditional software, agents powered by large language models (LLMs) can make nuanced decisions, navigate complex multi-step tasks, and integrate seamlessly with tools and APIs. At the start of 2024, agents were not ready for prime time, making frustrating mistakes like hallucinating URLs. They started getting better as frontier large language models themselves improved. “Let me put it this way,” said Sam Witteveen, cofounder of Red Dragon, a company that develops agents for companies, and that recently reviewed the 48 agents it built last year. “Interestingly, the ones that we built at the start of the year, a lot of those worked way better at the end of the year just because the models got better.” Witteveen shared this in the video podcast we filmed to discuss these five big trends in detail. Models are getting better and hallucinating less, and they’re also being trained to do agentic tasks. Another feature that the model providers are researching is a way to use the LLM as a judge, and as models get cheaper (something we’ll cover below), companies can use three or more models to

Read More »

OpenAI’s red teaming innovations define new essentials for security leaders in the AI era

Join our daily and weekly newsletters for the latest updates and exclusive content on industry-leading AI coverage. Learn More OpenAI has taken a more aggressive approach to red teaming than its AI competitors, demonstrating its security teams’ advanced capabilities in two areas: multi-step reinforcement and external red teaming. OpenAI recently released two papers that set a new competitive standard for improving the quality, reliability and safety of AI models in these two techniques and more. The first paper, “OpenAI’s Approach to External Red Teaming for AI Models and Systems,” reports that specialized teams outside the company have proven effective in uncovering vulnerabilities that might otherwise have made it into a released model because in-house testing techniques may have missed them. In the second paper, “Diverse and Effective Red Teaming with Auto-Generated Rewards and Multi-Step Reinforcement Learning,” OpenAI introduces an automated framework that relies on iterative reinforcement learning to generate a broad spectrum of novel, wide-ranging attacks. Going all-in on red teaming pays practical, competitive dividends It’s encouraging to see competitive intensity in red teaming growing among AI companies. When Anthropic released its AI red team guidelines in June of last year, it joined AI providers including Google, Microsoft, Nvidia, OpenAI, and even the U.S.’s National Institute of Standards and Technology (NIST), which all had released red teaming frameworks. Investing heavily in red teaming yields tangible benefits for security leaders in any organization. OpenAI’s paper on external red teaming provides a detailed analysis of how the company strives to create specialized external teams that include cybersecurity and subject matter experts. The goal is to see if knowledgeable external teams can defeat models’ security perimeters and find gaps in their security, biases and controls that prompt-based testing couldn’t find. What makes OpenAI’s recent papers noteworthy is how well they define using human-in-the-middle

Read More »